


1. Background
Multiple sclerosis (MS) is a demyelinating disease with multiple symptoms in different organs (1-3). Without a suitable treatment, this disease can progress into advanced stages and cause serious disabilities (4-8). There are different medications used to limit the activity and consequences of this disease, such as injectable, oral, and infused medications (9-11). One of the medications introduced to avoid the disease progression is TYSABRI (natalizumab) (12). The MS plaques have an inflammatory nature, and TYSABRI seems to decrease inflammation at the blood-brain barrier (13). This medication seems to be successful in reducing MS attacks and relapses (14-17). Accordingly, it has been widely used despite the increased risk of progressive multifocal leukoencephalopathy and its controversial long-term use (18, 19).
Development of new lesions can be a sign of disease progression; therefore, detection of these lesions is of great importance in monitoring the disease (20). Magnetic resonance (MR) images of the patients can be examined to determine the effectiveness of treatment and the MS plaque volume (21). Neurologists or radiologists often compare successive images visually or subjectively in medical centers, which may lead to some human errors. In a successful treatment, the volume of MS plaques does not change or decrease. Today, to reduce human errors, objective or quantitative assessments of successive images are suggested. For this purpose, a software program was developed (22).
2. Objectives
This study aimed to assess the congruence between subjective diagnoses made by radiologists or neurologists and the objective results of the software, developed exclusively for evaluating the MS plaque volume.
3. Patients and Methods
Thirty-five MS patients participated in this study. The patients had undergone one year of TYSABRI treatment. All patients received 300-mg TYSABRI intravenously every month. To evaluate the MS plaques, MRI imaging was performed before and after treatment. Both imaging procedures were performed at the same imaging center, based on the same imaging protocol, as shown in Table 1. A 1.5-T Siemens MAGNETOM Avanto MRI scanner was used for imaging. A fluid attenuation inversion recovery (FLAIR) pulse sequence was used before and after treatment.
To assess the MS plaque volume, a MATLAB-based software (MATLAB R2016 b) was designed to evaluate both enhancing and non-enhancing MS plaques. This software can segment MS lesions from MRI images and calculate their volume. In the first step, DICOM images extracted from the picture archiving and communications systems (PACS, INFINITT, South Korea) were coded. Next, the user manually segmented the brain regions to avoid the interference of bonny structures with the automatic segmentation of MS lesions. The brightness of different slices might slightly differ; therefore, the histogram of all slices was analyzed and rescaled in a limited range to resolve the problem of different brightness levels.
| TR (ms) | TE (ms) | TI (ms) | FA | #Phase Encoding Steps | Matrix |
|---|---|---|---|---|---|
| 7500 | 102 | 2295.6 | 150 | 160 | 256 × 154 |
The Imaging Parameters of the FLAIR Pulse Sequence
In the rescaled images, the brightness ranges of MS lesion and normal brain were estimated as the threshold signal intensities of normal or plaque regions. One was assigned to pixels with brightness in the determined range, and zero was assigned to other pixels; consequently, a mask image was acquired. The mask image matrix was multiplied by the matrix of the original image to extract the MS plaque region. By using this method, the number of MS plaque voxels and their volume could be estimated.
The developed software was validated by comparing its results with those of the Medical Imaging Interaction Toolkit (MITK), which is a well-known commercial toolkit (22). To determine the agreement of this software with other commercial software programs, which are typically used for this purpose, its results were also compared with those of another commercial software package, namely, Jim version 7.0 (Xinapse Systems Ltd., UK; http://www.xinapse.com). To validate the software, the images of 15 patients were selected randomly and analyzed using both software programs. The quantitative assessment of successive MRI images was performed using the developed software.
Three specialists, including two neurologists and a radiologist, subjectively evaluated both MRI images of the patients and identified the reduction or increase in MS plaques before and after treatment. The specialists completed a form, containing the patient’s ID code. They recorded their diagnosis by marking one of the following options: “increased plaque volume after treatment” or “reduced plaque volume after treatment”. However, in some cases, they could not detect any changes; therefore, they selected the option of “no change”. To maintain consistency between the specialist’s diagnosis and the software results, volume changes less than 5% in the software results were considered as “no change”. The physicians remained unaware of the results of the objective assessments.
Kolmogorov-Smirnov test was used to assess the normal distribution of data, and one-way ANOVA test was used to evaluate differences in the volume of MS plaques between the first and second images. Agreement between the observers and also between the observers and the software was assessed by kappa coefficient test in SPSS version 22. The Kappa coefficients of 0.00-0.20 and 0.21 - 0.40 indicated slight and fair agreement, respectively.
4. Results
Thirty-five MS patients, including 21 females and 14 males, with the mean age of 32.46 years (range: 24 - 40 years), participated in this study. The developed software was evaluated by comparing the results with the results of Jim package. Figure 1 presents the Bland-Altman plot of the two software data. Based on the software results, the mean MS plaque volume in the first (before treatment) and second (after treatment) images was 1.59 × 10⁴ ± 1.22 × 10⁴ and 1.80 × 10⁴ ± 1.41 × 104 mm3, respectively, which was not significantly different (P = 0.52). According to the results of Kolmogorov-Smirnov test, the data had a normal distribution.

A Bland-Altman plot for the assessment of agreement between the results of our developed MATLAB software and Jim Version 7
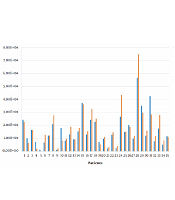
Based on the quantitative measurements by the software, the MS plaque volume reduced in 13 (37.14%) patients and increased in 22 (62.86%) patients after one year of TYSABRI treatment. As mentioned in the method section, since the specialists could not detect any changes in some cases, changes less than 5% were considered as “no change” in the software (n = 5) (Table 2). Figures 2 and 3 present the lesion volume in each patient before and after treatment and the percentage of difference.
| MS volume changes | First observer | Second observer | Third observer | Software results |
|---|---|---|---|---|
| Decreased MS plaques | 14 | 6 | 5 | 10 |
| Increased MS plaques | 9 | 16 | 12 | 20 |
| No change | 12 | 13 | 18 | 5 |
The Detailed Assessment Results of Different Observers and the Software in Terms of Change in the Total MS Plaque Volume in Each Patient [Number of Patients with Change (Increased or Decreased MS Plaque Volume) and no Change After a Year of Treatment]
")
The lesion volume in each patient before and after treatment (software assessment)
")
The percentage of differences in the lesion volume before and after treatment (software assessment)
The software estimated the MS plaque volume in successive years and calculated the percentage of decrease or increase in the MS plaque volume. According to the software, changes in the MS plaque burden ranged from a 79.75% decrease to an 86.75% increase. The details are shown in Table 3.
| Absolute percentage of decrease or increase in the MS plaque burden | Frequency |
|---|---|
| < 10 | 8 |
| 10 - 20 | 7 |
| 20 - 30 | 2 |
| 30 - 40 | 5 |
| 40 - 50 | 1 |
| > 50 | 12 |
The Absolute Percentages and Frequencies of Decrease or Increase in the MS Plaque Burden (Software Assessment)
The physicians assessed the images before and after treatment and determined the changes in the MS plaque volume in each patient. The detailed results are presented in Table 2. Agreement between the observers and also between each observer and the software was assessed using the kappa coefficient test, as shown in Tables 4 and 5.
| Inter-observer agreement | Observed agreement (%) | Kappa coefficient | 95% Confidence interval (CI) |
|---|---|---|---|
| First and second observers | 31.43 | 0.028 | -0.175 to 0.230 |
| Second and third observers | 48.57 | 0.173 | -0.090 to 0.436 |
| First and third observers | 42.86 | 0.169 | -0.041 to 0.378 |
Agreement Between the Observers
| Software and observers | Observed agreement (%) | Kappa coefficient | 95% Confidence interval (CI) |
|---|---|---|---|
| First observer | 54.29 | 0.234 | -0.004 to 0.472 |
| Second observer | 45.71 | 0.228 | 0.072 to 0.383 |
| Third observer | 51.43 | 0.212 | 0.031 to 0.393 |
Agreement Between the Software and Each Observer
5. Discussion
Monitoring of MS patients is very important during drug treatments, and MRI in regular intervals is needed. Successive images should be compared to determine if the disease is managed or progressing. Routinely, images are compared visually in the medical centers of Iran, and diagnosis of the disease status is subjective. On the other hand, objective results can help reduce human errors in the assessment of disease progression. In the present study, a dedicated software was developed using MATLAB software for segmentation of the MS plaques.
The qualitative assessment (Figure 1) revealed a good agreement between our developed MATLAB code and Jim 7 software in segmentation of MS plaques. The quantitative comparison of MS plaque volume also showed no significant difference between the two software programs (P = 0.82); therefore, the validity of the developed software was verified for segmenting MS plaques in the brain. The validity of the software for segmentation of MS plaques in the spinal cord was previously verified by comparing the results with MITK (22).
According to the present results, there was no significant difference in the mean MS plaque volume between the first and second MRI images (P = 0.52). This is due to the fact that the MS plaque volume increased in some patients and decreased in some others after a year of treatment. The successive MRI images were objectively and subjectively compared in terms of the volume of MS plaques to determine the status of the disease after treatment. Table 2 shows that there was only a fair agreement between the observers and the software. According to Table 4, there was an agreement of 31.34 to 48.57% between the specialists. Based on the kappa coefficient, there was only a slight agreement between the observers.
According to Table 5, an agreement of 45.71 to 54.29% was observed between each observer and the software. Based on the kappa coefficient, there was a fair agreement between the subjective and objective assessments. There are three reasons for this difference. First, changes in the successive images were small in some cases. According to Table 3 and Figure 3, there were eight patients with a difference of less than 10% between images before and after treatment and seven patients with a difference of 10 - 20%; therefore, the specialists could not easily detect these small changes. Second, according to previous studies (12-14), physicians expected improvements in the patients’ condition; this anticipation might have affected their judgment. The reasons for the failure of TYSABRI treatment in 62.86% of the patients should be examined in an independent study.
As a third explanation, physicians compared the plaques in successive images using anatomic landmarks, such as the ventricles, as a reference; given the subtle differences in the slice locations in successive MRI images of each patient, errors may occur in estimating the increase or decrease in the lesion burden. According to the results, agreement between different specialists was < 50%, and agreement between the specialists and the software was < 55%. In other words, if a patient visits different specialists during the follow-up, the physicians’ decisions on the improvement or progression of disease after treatment can differ, which may change the patient's treatment process.
According to the results, it can be concluded that application of a valid software for the objective comparison of successive images during the treatment of MS patients can help physicians monitor the patients more effectively, leading to improved disease control. Besides, diagnosis is reproducible using an objective software rather than a subjective assessment by a physician for the assessment of disease progression.
