

1. Background
The atherosclerotic process, which is primarily characterized by endothelial dysfunction (ED), can result in coronary artery disease (CAD), with high morbidity and mortality rates worldwide. Acceleration of atherosclerosis, which is a slow, but irrepressible process, can also lead to stroke and peripheral artery disease. It is known that various molecules released by the endothelium regulate the vascular tone and smooth muscle proliferation and prevent platelet aggregation (1). In a process that starts with damage to this active organ, monocytes migrate to the damaged endothelial region and contribute to the onset and progression of the atherosclerotic process and formation of coronary plaques (2). Moreover, monocytes lead to the release of many pro-inflammatory cytokines after migration to the damaged area (3). Also, monocytes accumulate in lipids and differentiate into macrophages (4). Macrophages deposited in lipids release some destructive metalloproteinases, such as elastase and collagenase (5, 6). Eventually, endothelial inflammation and activation of thrombotic pathways trigger atherosclerosis by initiating ED.
The role of lipids in the atherosclerotic process and plaque formation is well established. High-density lipoprotein-cholesterol (HDL-c) plays a vital role in the cholesterol transport pathway, removing cholesterol particles from monocyte-derived macrophages (7); therefore, it prevents the formation of plaques and lipid peroxidation (8). Besides, activation of monocytes and reduction of HDL levels lead to the acceleration of the atherosclerotic process (9, 10). Therefore, the monocyte-to-HDL ratio (MHR) may be a suitable marker for atherosclerosis and cardiovascular disease. Previous studies reported that MHR is high in inflammatory processes, such as CAD, hypertension, diabetes, and hyperlipidemia (11, 12).
Coronary computed tomography (CT) angiography (CCTA) is a non-invasive tool, which has recently become popular. Moreover, the CAD-reporting and data system (CAD-RADS) was developed to standardize the assessment of coronary arteries and atherosclerosis markers (13). Besides quantification of coronary plaques, CCTA helps determine plaque composition and identify some features of plaque vulnerability. Generally, vulnerable plaques are characterized by a large plaque volume and CT features, including positive remodeling, low attenuation, napkin-ring sign, and spotty calcifications (14). The napkin-ring sign is a specific sign of high-risk atherosclerotic coronary artery plaques on CCTA, which indicates possible cardiac events in the future (15). The rupture of vulnerable plaques is a precursor to lesions in myocardial infarction; therefore, identification of vulnerable plaques is crucial (15).
Besides CAD-RADS scoring, the left ventricular mass (LVM) and the LVM index (LVMI), determined by dividing the LVM by the body surface area (BSA), can be used to detect cardiac events and heart disease (16, 17). The LVM measurements are frequently performed using echocardiography and magnetic resonance imaging (MRI) (18). It is possible to measure the LVM routinely in coronary scans using the new generation of CT devices. The present study first investigated the relationship between CAD-RADS scores and MHR and then examined MHR as a predictive marker for the CAD-RADS score.
2. Objectives
This study aimed to investigate the association of CAD-RADS score with LVM and MHR and to examine the role of MHR as a predictive marker for CAD-RADS score.
3. Patients and Methods
A total of 210 patients, referred to the radiological imaging center of our hospital for cardiovascular scans between January 2019 and January 2021, were included in this study by retrospectively evaluating the CCTA examinations. CCTA was performed to rule out significant luminal stenosis in stable patients with suspected coronary stenosis. The participants’ CCTA examinations, sociodemographic characteristics, and laboratory test results were retrospectively collected. A radiologist with six years of experience in cardiovascular disease re-evaluated all CT examinations of the patients. Patients with acute or chronic infections, kidney failure, liver disease, hematological or solid cancer, and thyroid disease were excluded from the study.
The exclusion criteria were as follows: (1) lack of fasting blood test results or incomplete test results (n = 14); (2) history of coronary artery stent placement (n = 18 patients); (3) coronary bypass surgery (n = 12); and (4) lack of classification according to the CAD-RADS system due to the lack of a clear examination of coronary arteries (n = 6). Besides, patients with missing drug use information were excluded from the study. All patients with hypertension included in this study were using antihypertensive drugs, and all patients with diabetes were using antidiabetic drugs. After screening, 160 patients with complete data were included in the study.
3.1. Coronary CT Evaluation
For CCTA imaging, a Somatom Drive 2x128 Dual Source CT scanner (Siemens Healthineers, Erlangen, Germany) was used with the following scanner settings: (1) gantry rotation time, 0.28 ms; and (2) detector collimation, 0.5 × 256. The tube voltage and current (100 - 120 kV and 280 - 300 mA, respectively) were determined based on the participant’s body mass index (BMI). A cardioselective beta-blocker (25 - 100 mg metoprolol) was administered orally one week before scanning for patients with a heart rate of 60 bpm. An intravenous line (18 gauge) was also inserted into the left antecubital vein. Intravenous beta-blockers were administered to patients with higher heart rates before CT imaging.
The CT scans were automatically performed using an automatic bolus tracking technique. A region of interest was placed onto the left atrium. Image acquisition was initiated four seconds after the signal density level reached 100 hounsfield units (HU). A contrast volume of 1 mL/kg with 90 mL of non-ionic contrast media (on average) was administered. Next, 20 mL of saline was administered at a rate of 5.5 - 6 mL per second to increase the contrast concentration in the left side of the heart; consequently, segmentation of the right and left heart chambers was facilitated. Data acquisition was prospectively triggered by electrocardiography (ECG) at 65% of the R-R interval and completed within one cardiac cycle. All the CCTA data were reconstructed at a slice thickness of 0.75 mm and a slice increment of 0.3 mm.
The imaging data were evaluated using the CT Cardiac Function software on Syngo.via Workstation (version VB 20A, 2019, Siemens Healthineers, Erlangen, Germany). The CT scan of the LVM was also evaluated on the workstation. The endocardial and epicardial borders were automatically defined. The data were then manually corrected, and LVM was obtained by calculating the left ventricular myocardial volume. Also, the end-diastolic volume (EDV), end-systolic volume (ESV), stroke volume (SV), ejection fraction (EF), cardiac output (CO), and LVM of the reformatted images were calculated automatically.
A radiologist investigated the presence of calcified and non-calcified plaques in the patients’ coronary arteries. For all patients, plaque and stenosis percentages were measured separately for the right coronary artery (RCA), left main coronary artery (LM), circumflex artery (Cx), and left anterior descending artery (LAD). The rate of stenosis caused by calcified and non-calcified plaques in the coronary arteries was scored using the CAD-RADS system. The radiologist determined vulnerable plaques on the patients’ CT images. Positive remodeling, plaque attenuation, plaque burden, spotty calcifications, and napkin-ring sign were evaluated for each coronary plaque to detect vulnerable plaques (19). The process of vulnerable plaque detection is presented in Figure 1.
 artery.")
A 74-year-old man with multiple vulnerable plaques. Stenosis of 50 - 70% and > 70% can be seen in the proximal and middle portions of the left anterior descending (LAD) artery.
3.2. CAD-RADS
The data obtained from CCTA images for detecting CAD provide a standardized index based on the CAD-RADS scale (13). The CAD-RADS scores of the patients were calculated according to the reference values. Table 1 shows the scoring of the scale. Patients were divided into groups according to the CAD-RADS scores (CAD-RADS-0, n = 27; CAD-RADS-1, n = 37; CAD-RADS-2, n = 28; CAD-RADS-3, n = 28; and CAD-RADS-4, n = 40). No CAD-RADS-5 lesions were detected in the patients.
| Classification | Percentage | Interpretation |
|---|---|---|
| CAD-RADS classification | ||
| 0 | 0 | No plaque or stenosis |
| 1 | 1 - 24 | Minimal stenosis or plaque with no stenosis |
| 2 | 25 - 49 | Mild stenosis |
| 3 | 50 - 69 | Moderate stenosis |
| 4 | 70 - 99 | Severe stenosis |
| N | Non-diagnostic study | |
| LVM classification | ||
| 0 | ||
| Female | 43 - 95 | Normal range |
| Male | 49 - 115 | |
| 1 | ||
| Female | 96 - 108 | Mildly abnormal |
| Male | 116 - 131 | |
| 2 | Moderately abnormal | |
| Female | 109 - 121 | |
| Male | 132 - 148 | |
| 3 | Severely abnormal | |
| Female | ≥ 122 | |
| Male | ≥ 149 | |
Abbreviations: CAD-RADS, coronary artery disease-reporting and data system; LVM, left ventricular mass.
3.3. LVM and LVM Index (LVMI)
The LVM was calculated automatically based on CCTA images (20): LVM = 0.8 × [1.04 × (Left ventricular end-diastolic diameter + End-diastolic interventricular septal thickness + End-diastolic posterior wall thickness)3] + 0.6
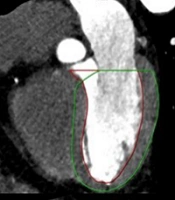
The LVM measurements are presented in Figure 2. First, BSA was calculated, and then, the LVMI was measured by dividing the LVM value by BSA (21):
 cavity and myocardium are identified automatically. The epicardial and endocardial contours are confirmed manually. The papillary muscles are excluded in the calculation of left ventricular mass (LVM).")
The left ventricular function analysis of a 73-year-old man. A trace of the left ventricular myocardium using end-diastolic contrast-enhanced CT angiography. The boundaries of the left ventricular (LV) cavity and myocardium are identified automatically. The epicardial and endocardial contours are confirmed manually. The papillary muscles are excluded in the calculation of left ventricular mass (LVM).
The patients were divided into groups according to the LVM values: normal range, mildly abnormal, moderately abnormal, and severely abnormal. The cardiovascular disease event classification according to the LVM is presented in Table 1.
3.4. Biochemical Parameters
The biochemical test results of the patients were determined one week before the CCTA scans. The MHR was also obtained by dividing the number of monocytes by HDL (MHR = monocyte count/HDL).
3.5. Ethical Considerations
The medical ethics committee of our university hospital approved the current study (approval number: 2021/3180).
3.6. Statistical Methods
All statistical analyses were performed in IBM SPSS for Windows version 20 (IBM Corp., Armonk, NY, USA). The results are presented as mean ± SD, median (range), and number (%). The normal distribution of data was evaluated using Levene’s test. One-way analysis of variance (ANOVA) and Tukey’s post-hoc test were also used for the analysis of data with a homogeneous distribution. On the other hand, data without a homogeneous distribution were evaluated using Kruskal-Wallis test and Mann-Whitney U test. Besides, categorical data were evaluated using chi-square test. Besides, Spearman’s rank test was used for correlation analyses. Independent variables associated with the CAD-RADS score were selected based on a univariate regression analysis. Next, a stepwise linear regression analysis was performed for the selected independent variables. The diagnostic efficacy of MHR for predicting the CAD-RADS score was evaluated using the receiver operating characteristic (ROC) curve analysis. Moreover, the optimal MHR cutoff points for the CAD-RADS scores were determined based on the Youden's J statistic. A P-value less than 0.05 was considered statistically significant.
4. Results
The age of CAD-RADS-3 (P < 0.001) and CAD-RADS-4 (P < 0.001) groups was significantly higher than that of the CAD-RADS-0 group. The number of male patients in the CAD-RADS-2, CAD-RADS-3, and CAD-RADS-4 groups was considerably higher than that of the CAD-RADS-0 and CAD-RADS-1 groups (P < 0.001). Moreover, the number of patients with hypertension was higher in the CAD-RADS-3, CAD-RADS-4, and CAD-RADS-5 groups compared to the CAD-RADS-0 and CAD-RADS-1 groups (P < 0.001). Also, the number of patients with diabetes was higher in the CAD-RADS-3 and CAD-RADS-4 groups compared to the other groups (P < 0.001).
The LVM was remarkably higher in the CAD-RADS-3, CAD-RADS-4, and CAD-RADS-5 groups as compared to the CAD-RADS-0 and CAD-RADS-1 groups (P < 0.001). Also, the LVMI of the CAD-RADS-3 and CAD-RADS-4 groups was significantly higher than that of the CAD-RADS-0 and CAD-RADS-1 groups (P = 0.006). The LVMI of the CAD-RADS-2 group was higher than that of the CAD-RADS-0 group, although the difference was not statistically significant. Other left ventricular measurements were similar between the groups (P > 0.05). The sociodemographic characteristics and the left ventricular measurements of the patients are presented in Table 2.
| Variables | All patients (n = 160) | CAD-RADS-0 (n = 27) | CAD-RADS-1 (n = 37) | CAD-RADS-2 (n = 28) | CAD-RADS-3 (n = 28) | CAD-RADS-4 (n = 40) | P-value |
|---|---|---|---|---|---|---|---|
| Age (y) | 56.4 ± 12.2 | 47.5 ± 9.8 | 54.9 ± 10.2 | 50.4 ± 10.6 b | 59.4 ± 10.6 c, d | 66.2 ± 10.1 c, e, f, g | < 0.001 h |
| Sex (M) | 92 (57.5) | 10 (37.0) | 13 (35.1) | 22 (78.5) | 19 (67.8) | 28 (70.0) | < 0.001 i |
| BMI (kg/m2) | 28.5 ± 4.0 | 26.8 ± 4.5 | 27.9 ± 2.9 | 28.5 ± 4.2 | 29.6 ± 3.2 | 29.6 ± 4.3 b | 0.025 h |
| HT | 62 (38.7) | 6 (22.2) | 10 (27.0) | 9 (32.1) | 13 (46.3) | 24 (60.0) | < 0.001 i |
| DM | 31 (19.3) | 3 (11.1) | 4 (10.8) | 4 (14.2) | 7 (25.0) | 13 (32.5) | 0.006 i |
| Lipid-lowering therapy | 146 (91.2) | 21 (77.7) | 33 (89.1) | 25 (89.2) | 27 (96.4) | 40 (100) | < 0.001 i |
| Smoking | 30 (18.7) | 3 (22.2) | 7 (18.9) | 6 (21.4) | 3 (10.7) | 11 (27.5) | 0.214 i |
| LVM (g) | 108.4 (41.4 - 202.8) | 101.1 (41.4 - 137.6) | 95.6 (58.8 - 159.7) | 112.3 (72.3 - 180.6) b, k | 118.3 (56.9 - 194.7) b, k | 128.3 (62.1 - 202.8) b, k | < 0.001 j |
| LVM-0 | 80 (50.0) | 16 (59.2) | 22 (59.5) | 14 (50.0) | 11 (39.2) | 17 (42.5) | 0.014 i |
| LVM-1 | 33 (20.6) | 5 (18.5) | 5 (13.5) | 9 (32.1) | 6 (21.5) | 8 (20.0) | |
| LVM-2 | 27 (16.9) | 6 (22.3) | 6 (16.2) | 3 (10.7) | 6 (21.5) | 6 (15.0) | |
| LVM-3 | 20 (12.5) | 0 | 4 (10.8) | 2 (7.2) | 5 (17.8) | 9 (22.5) | |
| LVMI (g/m2) | 53.8 (25.1 - 103.1) | 50.2 (25.1 - 73.4) | 48.3 (31.8 - 79.4) | 54.0 (35.3 - 100.1) k | 58.6 (31.5 - 100.4) b, k | 62.6 (36.3 - 103.1) b, k | 0.006 j |
| EF (%) | 57.6 ± 14.1 | 58.8 ± 12.3 | 56.1 ± 17.3 | 56.0 ± 15.4 | 59.8 ± 11.2 | 57.7 ± 12.9 | 0.796 h |
| SV (mL) | 72.6 ± 23.8 | 75.0 ± 24.4 | 67.2 ± 26.4 | 73.6 ± 28.1 | 75.4 ± 17.8 | 73.4 ± 21.6 | 0.630 h |
| ESV (mL) | 50.4 (15.1 - 195.9) | 52.1 (20.7 - 112.3) | 52.1 (19.9 - 115.2) | 55.5 (28.9 - 136.3) | 44.4 (17.5 - 88.4) | 47.0 (15.1 - 195.9) | 0.751 j |
| EDV (mL) | 123.3 (55.1 - 301.2) | 122.7 (81.2 - 188.6) | 117.6 (65.0 - 180.8) | 135.0 (65.9 - 207.3) | 127.3 (55.1 - 168.2) | 116.6 (71.1 - 301.2) | 0.619 j |
| CO (l/min) | 4.5 ± 1.6 | 4.5 ± 1.4 | 4.1 ± 1.7 | 4.3 ± 1.7 | 4.7 ± 1.5 | 4.6 ± 1.6 | 0.632 h |
| Vulnerable plaque | 25 (15.6) | 0 (0) | 1 (4.0) | 2 (8.0) | 2 (8.0) | 20 (80.0) | 0.001 i |
Abbreviations: CAD-RADS, coronary artery disease-reporting and data system; M, male; BMI, body mass index; HT, hypertension; DM, diabetes mellitus; LVM, left ventricular mass; LVMI, left ventricular mass index; EF, ejection fraction; SV, stroke volume; ESV, end-systolic volume; EDV, end-diastolic volume; CO, cardiac output.
a Values are expressed as No. (%), mean ± SD or value (range).
b P < 0.05 vs. CAD-RADS-0.
c P < 0.001.
d P < 0.05 vs. CAD-RADS-2.
e P < 0.001.
f P < 0.001.
g P < 0.05 vs. CAD-RADS-3.
h ANOVA.
i Chi-square test.
j Kruskal-Wallis test.
k P < 0.05 vs. CAD-RADS-1.
The MHR and high-sensitive C-reactive protein (hs-CRP) level were significantly higher in the CAD-RADS-2, CAD-RADS-3, and CAD-RADS-4 groups compared to the CAD-RADS-0 and CAD-RADS-1 groups (P < 0.001). The MHR was also higher in the CAD-RADS-1 group compared to the CAD-RADS-0 group (P < 0.001). The hs-CRP level was significantly higher in the CAD-RADS-2 group compared to the CAD-RADS-3 and CAD-RADS-4 groups (P < 0.001). The hs-CRP level in CAD-RADS-4 patients was higher than that of the CAD-RADS-3 group (P < 0.05). Besides, the monocyte count was higher in the CAD-RADS-2, CAD-RADS-3, and CAD-RADS-4 groups compared to the CAD-RADS-0 and CAD-RADS-1 groups (P < 0.001), while the level of HDL was lower (P < 0.001). All biochemical parameters of the patients are presented in Table 3.
| Variables | All patients (n = 160) | CAD-RADS-0 (n = 27) | CAD-RADS-1 (n = 37) | CAD-RADS-2 (n = 28) | CAD-RADS-3 (n = 28) | CAD-RADS-4 (n = 40) | P-value |
|---|---|---|---|---|---|---|---|
| FPG (mg/dL) | 109.8 ± 26.8 | 98.0 (78.0 - 172.9) | 102.0 (81.2 - 204.2) | 97.0 (75.8 - 133.1) | 108.2 (74.0 - 196.1) a, b | 105.8 (74.3 - 193.1) a, b | 0.030 c |
| Hs-CRP (mg/dL) | 14.7 (0.4 - 99.7) | 3.1 (0.4 - 10.5) | 3.5 (1.0 - 38.0) | 12.0 (1.9 - 52.8) d, e | 27.2 (2.4 - 93.5) d, e, f | 35.3 (11.2 - 99.7) d, e, f, g | < 0.001 c |
| Monocytes (x109/μL) | 0.53 (0.13 - 1.10) | 0.40 (0.13 - 0.64) | 0.48 (0.28 - 0.70) d | 0.57 (0.41 - 0.87) d, h | 0.63 (0.28 - 0.099) d, e | 0.65 (0.39 - 1.10) d, e, b | < 0.001 c |
| TC (mg/dL) | 187.8 ± 43.6 | 188.3 ± 34.5 | 202.5 ± 37.2 | 185.8 ± 52.6 | 203.9 ± 52.2 | 172.5 ± 49.5 h, g | 0.025 i |
| Triglyceride (mg/dL) | 155.0 ± 66.8 | 146.5 ± 64.4 | 151.3 ± 49.8 | 150.1 ± 86.6 | 179.8 ± 65.2 | 150.3 ± 66.1 | 0.314 i |
| LDL (mg/dL) | 112.7 ± 35.4 | 106.9 ± 29.5 | 123.9 ± 31.5 | 114.2 ± 41.2 | 114.7 ± 30.6 | 103.5 ± 39.1 | 0.120 i |
| HDL (mg/dL) | 45.2 ± 11.1 | 52.0 ± 13.3 | 48.2 ± 13.0 | 41.5 ± 10.4 a | 41.2 ± 8.0 a | 43.1 ± 6.8 a | < 0.001 i |
| MHR | 12.2 (3.9 - 34.1) | 7.3 (3.9 - 17.9) | 10.2 (4.1 - 16.7) d | 13.6 (10.5 - 22.8) d, e | 15.9 (5.4 - 31.2) d, e | 15.8 (7.2 - 34.1) d, e | < 0.001 c |
Abbreviations: CAD-RADS, coronary artery disease-reporting and data system; FPG, fasting plasma glucose; Hs-CRP, high-sensitive C-reactive protein; TC, total cholesterol; LDL, low-density protein; HDL, high-density protein; MHR, monocyte-to-high-density protein ratio.
a P < 0.05 vs. CAD-RADS-0.
b P < 0.05 vs. CAD-RADS-2.
c Kruskal-Wallis test.
d P < 0.001.
e P < 0.001.
f P < 0.001.
g P < 0.05 vs. CAD-RADS-3.
h P < 0.05 vs. CAD-RADS-1.
i ANOVA.
Based on the correlation analysis, there was a positive correlation between MHR and hs-CRP (r = 0.321, P < 0.001), LVM (r = 0.251, P = 0.003), and LVMI (r = 0.232, P = 0.007). There was also a positive correlation between the LVM and hs-CRP (r = 0.247, P = 0.004). The results of the correlation analysis are presented in Table 4. Moreover, vulnerable plaques were identified in 25 patients, 80% of whom had a CAD-RADS score of 4. The MHR (P = 0.010) and monocyte count (P = 0.006) of the patients with vulnerable plaques were higher than that of patients without vulnerable plaques. On the other hand, the HDL level was lower in patients with vulnerable plaques compared to those without vulnerable plaques; however, the difference was not statistically significant. All characteristics of the patients with vulnerable plaques are shown in Table 5.
| Parameters | MHR | LVM | ||
|---|---|---|---|---|
| r-value | P-value | r-value | P-value | |
| Age | 0.144 | 0.098 | 0.024 | 0.785 |
| BMI | 0.135 | 0.120 | 0.071 | 0.415 |
| FPG | 0.035 | 0.692 | 0.153 | 0.078 |
| Hs-CRP | 0.321 | < 0.001 | 0.247 | 0.004 |
| Monocytes | 0.737 | < 0.001 | 0.071 | 0.414 |
| TC | 0.214 | 0.013 | 0.165 | 0.057 |
| TG | 0.223 | < 0.001 | -0.271 | 0.002 |
| LDL | 0.199 | 0.021 | 0.178 | 0.039 |
| HDL | -0.532 | < 0.001 | 0.067 | 0.445 |
| LVM | 0.251 | 0.003 | 1.000 | 1.000 |
| LVMI | 0.232 | 0.007 | 0.251 | 0.003 |
| EF | 0.019 | 0.826 | 0.048 | 0.583 |
| SV | 0.109 | 0.209 | 0.486 | < 0.001 |
| ESV | 0.052 | 0.549 | 0.175 | 0.043 |
| EDV | 0.112 | 0.199 | 0.418 | < 0.001 |
| CO | 0.129 | 0.138 | 0.450 | < 0.001 |
Abbreviations: MHR, monocyte-to-high-density lipoprotein ratio; LVM, left ventricular mass; BMI, body mass index; FPG, fasting plasma glucose; Hs-CRP, high-sensitive C-reactive protein; TC, total cholesterol; TG, triglyceride; LDL, low-density lipoprotein; HDL, high-density lipoprotein; LVMI, left ventricular mass index; EF, ejection fraction; SV, stroke volume; ESV, end-systolic volume; EDV, end-diastolic volume; CO, cardiac output.
| Parameters | Vulnerable plaques (-) (n = 135) | Vulnerable plaques (+) (n = 25) | P-value |
|---|---|---|---|
| Age (y) | 54.5 ± 11.3 | 66.8 ± 11.5 | 0.001 |
| Sex (M) | 76 (56.3) | 16 (64.0) | 0.323 |
| BMI (kg/m2) | 28.4 ± 3.7 | 29.4 ± 5.1 | 0.345 |
| HT | 50 (37.0) | 12 (48.0) | 0.200 |
| DM | 26 (19.2) | 5 (20.0) | 0.553 |
| Lipid-lowering therapy | 121 (89.6) | 25 (100.0) | 0.056 |
| Smoking | 26 (19.2) | 4 (16.0) | 0.481 |
| LVM (g) | 108.6 ± 26.3 | 121.9 ± 38.3 | 0.107 |
| LVM-0 | 67 (49.6) | 13 (52.0) | 0.401 |
| LVM-1 | 30 (22.2) | 3 (12.0) | |
| LVM-2 | 24 (17.8) | 3 (12.0) | |
| LVM-3 | 14 (10.4) | 6 (24.0) | |
| LVMI (g/m2) | 55.5 ± 13.1 | 61.8 ± 19.3 | 0.130 |
| EF (%) | 58.6 ± 13.2 | 52.0 ± 17.0 | 0.077 |
| SV (mL) | 73.2 ± 23.7 | 69.3 ± 24.7 | 0.473 |
| ESV (mL) | 52.1 ± 22.6 | 68.8 ± 39.6 | 0.051 |
| EDV (mL) | 125.4 ± 33.5 | 138.2 ± 50.8 | 0.236 |
| CO (l/min) | 4.5 ± 1.6 | 4.5 ± 1.8 | 0.992 |
| FPG (mg/dL) | 108.5 ± 26.0 | 116.6 ± 30.4 | 0.221 |
| Hs-CRP (mg/dL) | 10.2 (0.42 - 93.5) | 35.5 (2.4 - 99.7) | 0.001 |
| Monocyte (× 109/μL) | 0.54 ± 0.17 | 0.67 ± 0.21 | 0.006 |
| Total cholesterol (mg/dL) | 188.9 ± 43.6 | 181.7 ± 43.8 | 0.452 |
| Triglyceride (mg/dL) | 154.0 ± 67.6 | 160.2 ± 63.1 | 0.661 |
| LDL (mg/dL) | 114.0 ± 35.0 | 105.4 ± 37.4 | 0.293 |
| HDL (mg/dL) | 45.3 ± 11.8 | 44.2 ± 6.7 | 0.521 |
| MHR | 12.6 ± 5.2 | 15.7 ± 5.1 | 0.010 |
| CAD-RADS-0 | 27 (20.0) | 0 (0.0) | 0.001 |
| CAD-RADS-1 | 36 (26.6) | 1 (4.0) | |
| CAD-RADS-2 | 26 (19.3) | 2 (8.0) | |
| CAD-RADS-3 | 26 (19.3) | 2 (8.0) | |
| CAD-RADS-4 | 20 (14.8) | 20 (80.0) |
Abbreviations: M, male; BMI, body mass index; HT, hypertension; DM, diabetes mellitus; LVM, left ventricular mass; LVMI, left ventricular mass index; EF, ejection fraction; SV, stroke volume; ESV, end-systolic volume; EDV, end-diastolic volume; CO, cardiac output; FPG, fasting plasma glucose; Hs-CRP, high-sensitive C-reactive protein; LDL, low-density lipoprotein; HDL, high-density lipoprotein; MHR, monocyte-to-high-density lipoprotein ratio; CAD-RADS, coronary artery disease-reporting and data system.
a Values are expressed as No. (%), mean ± SD or value (range).
Independent variables associated with the CAD-RADS score were determined in univariate regression analyses, followed by multivariate regression analyses. The results of multivariate analyses showed independent relationships between the CAD-RADS score and the level of hs-CRP (β = 407, P < 0.001), MHR (β = 351, P < 0.001), age (β = 0.254, P < 0.001), male sex (β = 0.179, P < 0.001), and diabetes mellitus (β = 0.122, P = 0.008). Moreover, the results of univariate analyses indicated independent relationships between the presence of vulnerable plaques and MHR (β = 211, P = 0.007) and hs-CRP (β = 0.378, P < 0.001). However, the multivariate analysis showed no significant association between MHR and hs-CRP. The multivariate analyses showed independent relationships between the presence of vulnerable plaques and the CAD-RADS score (β = 350, P < 0.001) and age (β = 0.189, P = 0.017). The results of the univariate and multivariate regression analyses are presented in Table 6.
| Variables | CAD-RADS (dependent variable) | Vulnerable plaque (dependent variable) | ||||||
|---|---|---|---|---|---|---|---|---|
| Univariate | Multivariate | Univariate | Multivariate | |||||
| Beta coefficient | P-value | Beta coefficient | P-value | Beta coefficient | P-value | Beta coefficient | P-value | |
| Age | 0.496 | < 0.001 | 0.254 | < 0.001 | 0.365 | < 0.001 | 0.189 | 0.017 |
| Male sex | 0.282 | < 0.001 | 0.179 | < 0.001 | 0.054 | 0.495 | ||
| BMI | 0.254 | 0.001 | 0.094 | 0.237 | ||||
| Current smoking | 0.098 | 0.215 | 0.029 | 0.715 | ||||
| HT | 0.289 | < 0.001 | 0.084 | 0.292 | ||||
| DM | 0.217 | 0.006 | 0.122 | 0.008 | 0.008 | 0.919 | ||
| HL | 0.299 | < 0.001 | 0.142 | 0.072 | ||||
| FPG | 0.228 | 0.004 | 0.110 | 0.166 | ||||
| Hs-CRP | 0.694 | < 0.001 | 0.407 | < 0.001 | 0.378 | < 0.001 | ||
| Monocytes | 0.581 | < 0.001 | 0.267 | 0.001 | ||||
| Total cholesterol | 0.128 | 0.107 | 0.060 | 0.446 | ||||
| Triglyceride | 0.101 | 0.204 | 0.033 | 0.674 | ||||
| LDL | 0.073 | 0.258 | 0.089 | 0.264 | ||||
| HDL | 0.284 | < 0.001 | 0.035 | 0.655 | ||||
| MHR | 0.613 | < 0.001 | 0.351 | < 0.001 | 0.211 | 0.007 | ||
| LVM | 0.354 | < 0.001 | 0.168 | 0.033 | ||||
| LVMI | 0.313 | < 0.001 | 0.158 | 0.045 | ||||
| EF | 0.020 | 0.800 | 0.170 | 0.031 | ||||
| SV | 0.038 | 0.632 | 0.059 | 0.455 | ||||
| ESV | 0.074 | 0.350 | 0.228 | 0.004 | ||||
| EDV | 0.078 | 0.324 | 0.126 | 0.111 | ||||
| CO | 0.069 | 0.385 | 0.001 | 0.991 | ||||
| CAD-RADS | 0.459 | < 0.001 | 0.350 | < 0.001 | ||||
Abbreviations: BMI, body mass index; HT, hypertension; DM, diabetes mellitus; HL, hyperlipidemia; FPG, fasting plasma glucose; Hs-CRP, high-sensitive C-reactive protein; LDL, low-density lipoprotein; HDL, high-density lipoprotein; MHR, monocyte-to-high-density lipoprotein ratio; LVM, left ventricular mass; LVMI, left ventricular mass index; EF, ejection fraction; SV, stroke volume; ESV, end-systolic volume; EDV, end-diastolic volume; CO, cardiac output; CAD-RADS, coronary artery disease-reporting and data system.
According to the ROC curve analysis, the optimal cutoff point of MHR for CAD-RADS-1 was 9.4, with sensitivity and specificity of 62.2 and 74.1%, respectively (AUC = 0.753; 95% CI: 0.628 - 0.878, P < 0.001), as shown in Figure 3A. Besides, the optimal cutoff point of MHR for CAD-RADS-2 was 11.5, with sensitivity and specificity of 82.8 and 78.1%, respectively (AUC = 0.879, 95% CI: 0.813 - 0.946, P < 0.001) (Figure 3B). Also, the optimal cutoff point of MHR for CAD-RADS-3 was 12.8, with sensitivity and specificity of 82.1 and 76.3%, respectively (AUC = 0.811, 95% CI = 0.717 - 0.905, P < 0.001) (Figure 3C). Finally, the optimal MHR cutoff point for CAD-RADS-4 was 14.0, with sensitivity and specificity of 70.0 and 71.9%, respectively (AUC = 0.739, 95% CI = 0.652 - 0.826, P < 0.001) (Figure 3D).
 curve of monocyte-to-HDL ratio (MHR) for predicting coronary artery disease-reporting and data system (CAD-RADS)-1; B, The ROC curve of MHR for predicting CAD-RADS-2; C, The ROC curve of MHR for predicting CAD-RADS-3; D, The ROC curve of MHR for predicting CAD-RADS-4.")
A, The receiver operating characteristic (ROC) curve of monocyte-to-HDL ratio (MHR) for predicting coronary artery disease-reporting and data system (CAD-RADS)-1; B, The ROC curve of MHR for predicting CAD-RADS-2; C, The ROC curve of MHR for predicting CAD-RADS-3; D, The ROC curve of MHR for predicting CAD-RADS-4.
5. Discussion
The current study suggested an independent relationship between MHR and CAD-RADS scores. The cutoff values of MHR (9.4 for score 1; 11.5 for score 2; 12.8 for score 3; and 14.0 for score 4) showed high sensitivity and specificity for the CAD-RADS scores. Similarly, MHR showed a positive correlation with LVM and LVMI. To the best of our knowledge, this study is the first to find a relationship between the CAD-RADS score and LVM and MHR. Based on the results, higher MHR was found in patients with vulnerable plaques compared to patients without vulnerable plaques. However, in the multivariate regression analysis, there was no independent relationship between vulnerable plaques and MHR.
Monocytes are leukocytes found in the blood, which pass into tissues and convert into macrophages (22). Monocytes and macrophages play vital roles in inflammatory processes and lead to the greater release of pro-inflammatory and prooxidant cytokines compared to other leukocyte types (23). Generally, monocytes play a crucial role in body defense. Nevertheless, because of excessive monocyte activation, the interaction of monocytes with platelets and endothelial cells increases and ED occurs (24, 25). ED is the first and most important stage in atherosclerosis; therefore, activated monocytes play a vital role in the atherosclerotic process (26).
Previous studies have speculated that the monocyte count is a predictive marker for CAD (27). Besides, cholesterol plays a remarkable role in the atherosclerotic process. Unlike other cholesterols, HDL reduces the expression of endothelial adhesion molecules and exerts antioxidant, anti-inflammatory, and anti-aggregant effects (28). It also prevents the atherosclerotic process by preventing the oxidation of low-density lipoprotein (LDL) molecules (29). Besides, it inhibits the activity of monocytes and prevents their conversion to macrophages (30). The increase in monocytes and decrease in HDL levels accelerate the atherosclerotic process.
MHR is an inexpensive and reliable marker for the early identification of the atherosclerotic process. It reflects the antioxidant-prooxidant balance and has been associated with accelerated atherosclerosis in many inflammatory diseases (31). An association has been reported between MHR and many known safe markers of atherosclerosis. In this regard, Wang et al. reported that MHR was associated with subclinical atherosclerosis and carotid intima-media thickness (32). Moreover, Acikgoz et al. suggested a relationship between MHR and flow-mediated dilatation (33). Canpolat et al. also showed an association between a slow coronary flow and increased MHR (34). Additionally, Zhou et al. found an independent relationship between the left ankle-brachial pulse wave velocity and MHR in Chinese people without hypertension, smoking, and alcohol use. They found that a cutoff value of 7.78 for MHR was significant for the risk of developing atherosclerosis (35).
Evidence suggests a strong correlation between the CAD-RADS score and the SYNTAX score (36). Balta et al. showed that MHR of 22.5 in patients with acute ST elevation was a predictive cutoff value with high sensitivity and specificity for no-reflow (37). Generally, the CAD-RADS is a noninvasive tool that allows for a detailed examination of the coronary artery structure and reveals cardiac death and myocardial infarction risk (36, 38). However, the relationship between CAD-RADS and MHR has not been investigated so far. In this study, a relationship was observed between MHR and the CAD-RADS score, and the cutoff values were determined for this score. The obtained results did not confirm MHR as a definitive marker for CAD-RADS. However, MHR may be an inexpensive and reliable predictive marker for CAD-RADS scoring. Overall, the current findings suggest that MHR is only a risk factor for atherosclerosis.
The rupture of atherosclerotic plaques and the following complications are common causes of morbidity and mortality worldwide. Monocytes, inflammation, and cholesterol contribute to the formation of vulnerable plaques (39). The present findings revealed that patients with vulnerable plaques had higher MHR and monocyte counts compared to patients without vulnerable plaques. Since monocytes are involved in the etiology of vulnerable plaques, MHR may be a marker for vulnerable plaques. Moreover, a relationship was found between MHR and vulnerable plaques based on the univariate analysis, but not the multivariate analysis. It is worth mentioning that the low number of patients with vulnerable plaques in the current study might have affected the results; therefore, further relevant studies are needed.
The LVM is a non-invasive parameter, calculated by echo or cardiac MRI. It can independently predict adverse cardiovascular events, cardiac hypertrophy type and severity, and early cardiac death. Individuals with LV hypertrophy had a 2.7-fold increased risk of death from myocardial infarction or coronary heart disease compared to individuals without LV hypertrophy (40). Previous studies suggests that LVM can be an independent and non-invasive marker for coronary atherosclerosis, which is associated with the CAD-RADS score (41). The new generation of coronary CT devices used in the present study could automatically calculate the LVM value. In our study, the LVM values increased in patients with high CAD-RADS scores. Since LVM has different values in men and women, a classification system was used. Based on the results, as the CAD-RADS score increased, the LVM classification increased.
According to our findings, the LVMI score, measured by dividing LVM by the body surface area, was associated with the CAD-RADS scores. There was also a significant relationship between LVM and CAD-RADS scores in the univariate analysis; however, no significant association was found in the multivariate analysis. We cannot conclude that CAD is associated with LVM unless hypertension is recognized as the primary factor for CAD. The current findings may suggest MHR as a marker for the CAD-RADS score, but not LVM. Based on the correlation analysis, a significant relationship was observed between LVM and LVMI and MHR. Therefore, MHR can be a marker for LVM and the left ventricular hypertrophy (indirectly); nonetheless, further relevant studies are needed.
The association of age and male sex with cardiac death and major adverse cardiovascular events is well-known. In this regard, Popa et al. found a significant independent relationship between the CAD-RADS score and age and male sex (42, 43). In the current study, an independent relationship was also observed between the CAD-RADS score and age and male sex; the CAD-RADS score was higher in men than in women. Overall, a lower HDL level in men compared to women increases the risk of CAD in men. Besides, the concentration of monocytes was higher in men compared to women, and more cytokine release occurred against stimuli (44).
The higher MHR and risk of cardiac disease in men compared to women are natural consequences of high monocyte and low HDL levels. Therefore, MHR is expected to increase in patients with high CAD-RADS scores. Overall, the relationship between diabetes and CAD and CAD-RADS score is well-established (42). Moreover, there is a strong relationship between hyperglycemia and CAD, even in the prediabetic stage. The present study indicated a correlation between diabetes and CAD-RADS score in the multivariate analysis. According to our results, compared to glucose levels, MHR may be more significantly related to high CAD-RADS scores. In the literature, the relationship between dyslipidemia and CAD is generally well-known. In the current study, the high number of patients using cholesterol medications in all groups and the patients’ low cholesterol levels might have suggested MHR as a better marker than dyslipidemia.
The main limitation of this study was the small sample size. Therefore, further studies with a large sample size are needed to validate the results. Also, subgroup analyses could not be performed due to the small sample size. This study was designed as a single-center retrospective study. There are also studies in the literature with a small sample size, which retrospectively examined the CAD-RADS score (45). It should be noted that the current study is a pilot study; therefore, further multi-center, prospective studies are needed on this subject. Moreover, in this study, the SYNTAX score of the patients was not calculated, while a previous study reported a significant correlation between the CAD-RADS and SYNTAX scores (P < 0.0001) (36). Another study showed a significant correlation between MHR and SYNTAX scores (46). Overall, the CAD-RADS classification may be sufficient to detect CAD non-invasively. Although a shortcoming of this study was the lack of SYNTAX score calculation, the CAD-RADS score might be adequate to identify CAD in patients.
Based on the present findings, there was a significant association between MHR and CAD-RADS score and increased LVM. Also, MHR, as an inexpensive and reliable test, may be useful for the early diagnosis and follow-up of atherosclerotic heart diseases. Therefore, further multi-center, prospective studies are needed to confirm MHR as a predictive marker for the CAD-RADS score and LVM.
