


1. Background
The small bowel has long been regarded as a blind spot by endoscopists due to its location, length, tortuosity, and complex anatomy. Also, several disorders of the small intestine, such as intestinal obstruction, ischemia, tumors, and inflammatory bowel disease, lack specific symptoms (1, 2). Therefore, rapid and accurate diagnosis of small bowel diseases (SBDs) has become a clinical challenge (2, 3). In recent years, the advent and application of imaging techniques have markedly improved the diagnosis of SBDs by allowing for the visualization of the gastrointestinal tract (4-6). Multislice spiral computed tomography (MSCT) enterography can accurately evaluate the blood supply of mesenteric vessels and intestinal wall and is the mainstay of imaging methods for determining the cause of intestinal obstruction and extraintestinal lesions (7, 8). Because of its operability, painlessness, cost-effectiveness, rapid imaging, and few contraindications, MSCT has been widely used in clinical practice (9).
Radiological reports are the most important means of communication between radiologists and referring physicians, and the majority of radiology reports for MSCT enterography are free-text reports (FTRs) (10). Traditional FTRs are characterized by excessive variability in length, language, and style, which can minimize the clarity of reports and make it difficult for referring clinicians to identify key information for patient care (11). In contrast, a structured report (SR) typically uses standardized phrases with consistent formatting. So far, several studies have demonstrated the advantages of SRs over conventional FTRs, which include improved report clarity and consistency, higher radiologist satisfaction, and greater efficiency (12, 13). However, the value of SRs in small bowel MSCT imaging remains unknown.
2. Objectives
The present study aimed to develop an SR template for small bowel MSCT enterography and to evaluate its convenience and practicability by improvement of writing efficiency, satisfaction scores, and sensitivity and specificity for SBDs. This study also aimed to compare the application of FTRs and SRs and to further investigate the convenience and practicability of SRs based on evaluations by physicians with different years of experience.
3. Patients and Methods
3.1. Patients
Patients who underwent MSCT enterography in our hospital were included in this study. The inclusion criteria were as follows: (1) patients with pathologically confirmed or clinically diagnosed small intestinal tumors, inflammation, or mesenteric vascular lesions; (2) patients with complete clinical and imaging data; and (3) patients aged above 18 years. A total of 120 cases were included in this study and randomly assigned to two groups of FTR and SR. For neoplastic and non-neoplastic lesions requiring surgery (e.g., intestinal necrosis and strangulated intestinal obstruction), surgical pathology was performed and used as the gold standard.
3.2. Development of an SR Template for Small Bowel Imaging
In March 2017, a team was formed to develop an SR template for small bowel imaging. The SR was developed for SBDs, and the SR team composed of experienced physicians from the departments of radiology, gastroenterology, gastrointestinal surgery, and oncology to ensure a comprehensive evaluation. Our SR team included eight radiologists, one imaging technician, two gastroenterologists, two gastrointestinal surgeons, and two oncologists. The retrospective analyses of MSCT enterography findings were performed by radiologists after 2014, and the symptoms reported in the literature and the previous study by our research team were collected (14, 15).
Next, the SRs for MSCT enterography were formulated and discussed by multidisciplinary experts. Finally, the SR template for MSCT enterography was generated (Appendix 1 - 3). It included clinical diagnosis, details of CT examination, imaging findings (e.g., intestinal filling scores, location, intestinal wall thickening, degree and symmetry of intestinal wall thickening, strengthening of intestinal wall, intestinal obstruction, and continuity of the small bowel mucosa), and imaging diagnosis.
This study was performed according to the Declaration of Helsinki (http://www.cirp.org/library/ethics/helsinki/) and was approved by the ethics committee and animal management committee of our organization.
3.3. Preparation Before Inspection
Bowel hypotonicity and filling were assessed as previously described (14). Patients without any contraindications were allowed to have a low residue diet the night before scanning. Polyethylene glycol electrolyte powder (HeShuang, Shenzhen Wanhe Pharmaceutical Co. LTD, China) was used for bowel preparation and administered orally according to the following procedure. Initially, the first box of medication was prepared by adding polyethylene glycol electrolyte powder to 1000 mL of warm boiled water. At 8: 00 pm and 8: 15 pm, 750 and 250 mL of medication were used, respectively. The second box also contained 1000 mL of medication, and a dose of 250 mL was taken at 8: 30, 8: 45, 9: 00, and 9: 15 pm, respectively. After these two boxes were consumed, the patients were allowed to drink approximately 2000 - 3000 mL of warm boiled water until their excrement became clear water.
Imaging examinations were performed between 8: 00 am and 10: 00 am on the second day. To avoid hypoglycemia, the patients were allowed to drink 150 - 200 mL of sugar water around 8: 00 am on the same day. Orally, 2000 mL of 20% isotonic mannitol (Baxter Healthcare, Shanghai, China) was administered in four doses at 15-minute intervals before scanning. In patients with poor tolerance, small amounts of isotonic contrast agent were taken orally as many times as possible. Also, water deprivation was necessary for patients diagnosed with obvious intestinal obstruction. The fluid and gas within the obstructed lumen of these patients were observed via imaging. An adequate amount of isotonic contrast agent was administered when satisfactory filling was not achieved. Patients without any contraindications were injected with 20 mg of anisodamine intramuscularly at 10 minutes before scanning. Gastric tube decompression was performed immediately in case of unsuitable filling.
3.4. MSCT Enterography Procedures and Post-processing of Images
MSCT enterography was performed using a 64-slice spiral CT scanner (Somatom Sensation 64, Siemens, Forchheim, Germany) or a dual-source CT scanner (Definition Flash, Siemens, Forchheim, Germany or Somatom Force, Siemens, Forchheim, Germany). Unenhanced CT scan was performed from the diaphragmatic dome to the symphysis pubis. ULTRAVIST (370 mgI/mL, 1.5 mL/kg body weight; Bayer Schering, Germany) was injected intravenously into the right elbow at a rate of 3.5 mL/s with high pressure, and then, a three-phase contrast-enhanced scan was performed. The CT threshold-triggered scanning technique was applied for the arterial phase scanning of the small intestine. The abdominal aorta and the 11th thoracic vertebra were selected for scanning by positioning the film. The region of interest (ROI) was delineated in the image of abdominal aorta. When the CT value reached 100 HU, arterial phase scanning was performed. Data were collected at 40 seconds after injection in the small bowel phase. A venous phase scan was also performed at 75 seconds post-injection.
All CT images were transferred to a post-processing workstation for analysis, using the picture archiving and communication system (PACS). The multiplanar reconstruction (MPR), maximum intensity projection (MIP), and volume rendering technique (VRT) were used to indicate the overall morphology of the small intestine and its lesions, the mesenteric artery, and abdominal aorta and its major branches, respectively.
3.5. Evaluation of SR Accuracy and Satisfaction in MSCT Enterography
Six radiologists were selected and divided into an inexperienced group (group A, three radiologists with less than five years of experience in imaging diagnosis; A1, A2, and A3) and an experienced group (group B, three radiologists with more than five years of experience in imaging diagnosis; B1, B2, and B3). Overall, 60 MSCT scans of SBDs were analyzed by the two groups using FTRs, and the completion time was recorded. All physicians participated in SR training until they passed it. Another set of 60 MSCT scans of SBDs were provided for each trainee to write SRs. Radiologists in both groups wrote reports using SRs, and the completion time was then recorded. The six radiologists were blind to the clinical data and pathological findings of all cases. All 120 cases, including both negative and positive cases, were confirmed by surgery, pathology, and clinical examination. The disease types are presented in Table 1.
| Variables | FTR group | SR group | t/χ2 | P-value |
|---|---|---|---|---|
| Age (y) | 55 ± 17 | 53 ± 13 | 0.62 | 0.54 |
| Sex | ||||
| Male | 39 | 28 | ||
| Female | 21 | 32 | ||
| BMI | 24.3 ± 3.3 | 23.7 ± 1.8 | 2.26 | 0.25 |
| Underlying disease | 22 | 25 | 0.32 | 0.58 |
| Heart disease | 4 | 6 | ||
| Diabetes | 7 | 10 | ||
| Hypertension | 11 | 9 | ||
| SBDs | ||||
| Intestinal neoplasms | 17 | 20 | 0.35 | 0.55 |
| Adenocarcinoma | 4 | 5 | ||
| Mesenchymoma | 7 | 6 | ||
| Lymphadenoma | 2 | 4 | ||
| Leiomyoma | 3 | 4 | ||
| Adenoma | 1 | 1 | ||
| Vascular diseases | 13 | 8 | 1.44 | 0.23 |
| Superior mesenteric artery embolism | 4 | 2 | ||
| Superior mesenteric artery dissection | 1 | 0 | ||
| Superior mesenteric artery aneurysms | 1 | 1 | ||
| Superior mesenteric venous thrombosis | 2 | 1 | ||
| Portal vein thrombosis | 3 | 2 | ||
| Portal hypertension with collateral circulation | 2 | 2 | ||
| Inflammatory bowel disease | 17 | 18 | 0.04 | 0.84 |
| Crohn's disease | 6 | 5 | ||
| Radiation colitis | 0 | 2 | ||
| Eosinophilic enteritis | 1 | 0 | ||
| Intestinal inflammation | 10 | 11 | ||
| Others | 5 | 9 | 1.29 | 0.25 |
| Intussusception | 1 | 2 | ||
| Mesenteric warp with small bowel obstruction | 1 | 2 | ||
| Lumbar clamping with small bowel obstruction | 2 | 2 | ||
| Inguinal hernia with small bowel obstruction | 1 | 3 | ||
| Negative imaging examination | 8 | 5 | 0.776 | 0.38 |
| Total | 60 | 60 | ||
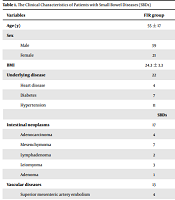
The Clinical Characteristics of Patients with Small Bowel Diseases (SBDs)
The accuracy and satisfaction of FTRs and SRs were assessed by the SR team, based on the surgical pathology, colonoscopy, and biopsy results, clinical diagnosis, clinical treatment, and follow-up as composite endpoints. Accuracy was evaluated via surgical pathology for patients who underwent surgery, while the clinical data and follow-up results were considered for patients who did not undergo surgery. The SR team was blind to the study design and the radiologists’ information. The report accuracy was evaluated for diseases in five regions, including the intestinal wall, intestinal periphery, blood vessels, bones, and other abdominal organs. The positive and negative accuracy, misdiagnosis rate, and total misdiagnosis rate were calculated for these diseases. Besides, sensitivity was defined as the positive coincidence rate, while specificity was defined as the negative coincidence rate. The misdiagnosis rate for each item was calculated using the following equation:
The total misdiagnosis rate was the sum of misdiagnosis rates for all the items, including the intestinal wall, intestinal peripheral artery, blood vessels, bones, and other abdominal organs. The satisfaction scores, ranging from one to five, were determined based on previous studies (16-19) and by discussion among researchers in this study. The satisfaction scores were assigned by the radiology department and physicians from relevant clinical departments, according to the scoring standards in Table 2.
| Scores | Assessment content |
|---|---|
| [0, 1] | Incomplete content, unclear logic, irregular words, and poor clinical practice |
| [1, 2] | Having only one quality among qualities of content completeness, logic, technical terms, and clinical efficacy |
| [2, 3] | Having two qualities among qualities of content completeness, logic, technical terms, and clinical efficacy |
| [3, 4] | Having three qualities among qualities of content completeness, logic, technical terms, and clinical efficacy |
| 5 | Complete content, clear logic, precise words, and high clinical practice |
Scoring Criteria for Report Satisfaction
3.6. Statistical Analysis
All statistical analyses were performed in SPSS version 20.0 (IBM Corp. Released 2011. IBM SPSS Statistics for Windows, Version 20.0. Armonk, NY: IBM Corp.). The normal distribution of continuous data was examined before comparisons using Kolmogorov-Smirnov test. The writing time was compared between the two reporting methods using paired t-test. A Chi-square test was also used to analyze the report accuracy. Besides, Wilcoxon rank-sum test was used to compare satisfaction between the two reporting methods. Statistical significance was considered to be P < 0.05.
4. Results
4.1. Patients’ Characteristics
The baseline characteristics of 120 patients examined in this study are presented in Table 1. The mean age of cases in the FTR and SR groups was 55 ± 17 and 53 ± 13 years, respectively. Comorbidities, such as heart disease, diabetes, and hypertension, were reported in 22 cases in the FTR group and 25 cases in the SR group. There was no significant difference in the baseline characteristics and SBDs between the FTR and SR groups, suggesting that all variables were comparable between the two groups.
4.2. Report Time
The FTR completion time for radiologists in the inexperienced and experienced groups was 14.0 ± 3.1 and 11.7 ± 2.4 seconds, respectively. Also, the SR completion time was 11.1 ± 1.7 and 9.8 ± 1.1 seconds in the inexperienced and experienced groups, respectively. In both inexperienced and experienced groups, the completion time of SRs was significantly shorter than that of FTRs (z = 6.152, P < 0.001 and z = 5.411, P < 0.001, respectively) (Table 3).
| Variables | FTR | SR | T | P-value |
|---|---|---|---|---|
| Inexperienced group | 14.0 ± 3.1 | 11.1 ± 1.7 | 6.152 | < 0.001 |
| Experienced group | 11.7 ± 2.4 | 9.8 ± 1.1 | 5.411 | < 0.001 |
Comparison of Writing Time Between FTR and SR
4.3. Comparison of FTR Accuracy Between Experienced and Inexperienced Groups
The accuracy of FTRs (i.e., sensitivity, specificity, misdiagnosis rate, and total misdiagnosis rate) by radiologists was evaluated in this study. As shown in Table 4, radiologists in the same group showed no significant differences regarding sensitivity, specificity, and misdiagnosis rate for all diseases (P > 0.05 for all). Next, the accuracy of reports by radiologists was compared between the inexperienced and experienced groups. The radiologists in the experienced group had a lower total misdiagnosis rate compared to the inexperienced group (P < 0.05). Additionally, radiologists in the experienced group showed higher sensitivity for all diseases (P < 0.05), as well as higher specificity for blood vessel and other abdominal organ diseases compared to the inexperienced group (P < 0.05). Moreover, the experienced group had a low misdiagnosis rate for all diseases (P < 0.05), except bone disease (P = 0.161).
| Diseases | Inexperienced group (group A) | Experienced group (group B) | Group A vs. group B | ||||||
|---|---|---|---|---|---|---|---|---|---|
| A1 | A2 | A3 | P-value | B1 | B2 | B3 | P-value | P-value | |
| Intestinal wall | |||||||||
| Sensitivity | 37/42 | 35/42 | 35/42 | 0.78 | 41/42 | 42/42 | 42/42 | / | < 0.001 |
| Specificity | 16/18 | 16/18 | 15/18 | 0.853 | 18/18 | 18/18 | 17/18 | / | 0.66 |
| Misdiagnosis rate | 7/60 | 9/60 | 10/60 | 0.73 | 1/60 | 1/60 | 1/60 | / | < 0.001 |
| Intestinal periphery | |||||||||
| Sensitivity | 32/39 | 27/39 | 25/39 | 0.193 | 37/39 | 38/39 | 39/39 | / | < 0.001 |
| Specificity | 21/21 | 20/21 | 21/21 | / | 21/21 | 21/21 | 21/21 | / | / |
| Misdiagnosis rate | 7/60 | 13/60 | 12/60 | 0.308 | 2/60 | 2/60 | 0/60 | / | < 0.001 |
| Blood vessels | |||||||||
| Sensitivity | 5/13 | 7/13 | 5/13 | / | 11/13 | 11/13 | 13/13 | / | < 0.001 |
| Specificity | 47/47 | 47/47 | 47/47 | / | 47/47 | 47/47 | 47/47 | / | 0.001 |
| Misdiagnosis rate | 8/60 | 6/60 | 8/60 | / | 2/60 | 2/60 | 0/60 | / | 0.011 |
| Other organs | |||||||||
| Sensitivity | 10/15 | 8/15 | 12/15 | / | 14/15 | 13/15 | 13/15 | / | 0.011 |
| Specificity | 45/45 | 45/45 | 45/45 | / | 45/45 | 45/45 | 45/45 | / | 0.021 |
| Misdiagnosis rate | 5/60 | 7/60 | 3/60 | / | 1/60 | 2/60 | 2/60 | / | 0.021 |
| Bone | |||||||||
| Sensitivity | 0/6 | 0/6 | 1/6 | / | 3/60 | 2/60 | 3/60 | / | 0.021 |
| Specificity | 54/54 | 54/54 | 54/54 | / | 54/54 | 54/54 | 54/54 | / | / |
| Misdiagnosis rate | 6/60 | 6/60 | 5/60 | / | 3/60 | 4/60 | 3/60 | / | 0.161 |
| Total misdiagnosis rate | 31/115 | 38/115 | 37/115 | / | 9/115 | 10/115 | 6/115 | / | < 0.001 |
4.4. Comparison of SR Accuracy Between the Experienced and Inexperienced Groups
The reporting accuracy (i.e., sensitivity, specificity, misdiagnosis rate, and total misdiagnosis rate) of radiologists using SRs was evaluated in this study. As shown in Table 5, the three radiologists in the same group showed no significant differences regarding sensitivity, specificity, and misdiagnosis rate for all diseases (P > 0.05 for all). Compared to the inexperienced group, the experienced radiologists had a lower misdiagnosis rate only for the intestinal wall disease (P < 0.05) and higher sensitivity for the intestinal wall disease (P < 0.05) and intestinal peripheral artery disease (P = 0.024). There was no significant difference between the inexperienced and experienced groups regarding the reporting accuracy for blood vessel, bone, and other abdominal organ diseases.
| Diseases | Inexperienced group (group A) | Experienced group (group B) | Group A vs. group B | ||||||
|---|---|---|---|---|---|---|---|---|---|
| A1 | A2 | A3 | P-value | B1 | B2 | B3 | P-value | P-value | |
| Intestinal wall | |||||||||
| Sensitivity | 41/49 | 42/49 | 44/49 | 0.667 | 41/42 | 42/42 | 42/42 | / | < 0.001 |
| Specificity | 9/11 | 7/11 | 9/11 | / | 11/11 | 11/11 | 11/11 | / | / |
| Misdiagnosis rate | 10/60 | 11/60 | 7/60 | 0.577 | 2/60 | 3/60 | 2/60 | 0.867 | < 0.001 |
| Intestinal periphery | |||||||||
| Sensitivity | 38/41 | 39/41 | 37/41 | / | 41/41 | 41/41 | 40/41 | / | 0.024 |
| Specificity | 19/19 | 19/19 | 19/19 | / | 19/19 | 19/19 | 19/19 | / | / |
| Misdiagnosis rate | 3/60 | 2/60 | 4/60 | / | 0/60 | 1/60 | 1/60 | / | / |
| Blood vessel | |||||||||
| Sensitivity | 8/8 | 8/8 | 7/8 | / | 8/8 | 8/8 | 8/8 | / | / |
| Specificity | 52/52 | 52/52 | 52/52 | / | 52/52 | 52/52 | 52/52 | / | / |
| Misdiagnosis rate | 0/60 | 0/60 | 1/60 | / | 0/60 | 0/60 | 0/60 | / | / |
| Other organs | |||||||||
| Sensitivity | 17/18 | 17/18 | 16/18 | / | 18/18 | 18/18 | 18/18 | / | / |
| Specificity | 42/42 | 42/42 | 42/42 | / | 42/42 | 42/42 | 42/42 | / | / |
| Misdiagnosis rate | 1/60 | 1/60 | 3/60 | / | 0/60 | 0/60 | 0/60 | / | / |
| Bone | |||||||||
| Sensitivity | 7/9 | 9/9 | 9/9 | / | 9/9 | 9/9 | 9/9 | / | / |
| Specificity | 51/51 | 50/51 | 51/51 | / | 51/51 | 51/51 | 51/51 | / | / |
| Misdiagnosis rate | 2/60 | 1/60 | 0/60 | / | 0/60 | 0/60 | 0/60 | / | / |
| Total misdiagnosis rate | 14/125 | 10/125 | 12/125 | / | 2/125 | 3/125 | 3/125 | / | < 0.001 |
4.5. Sensitivity Comparison of FTRs and SRs
The sensitivity of FTRs and SRs was compared in this study (Table 6). In the inexperienced group, the sensitivity of radiologists for intestinal peripheral artery, blood vessel, bone, and other abdominal organ diseases significantly improved after using SRs (P < 0.05). In contrast, no significant difference was found in the radiologists’ sensitivity for detecting intestinal wall disease using FTRs and SRs (P > 0.05). Also, there was no significant difference in their sensitivity for identifying intestinal wall disease, intestinal peripheral artery, blood vessel, bone, and other abdominal organ diseases between the FTRs and SRs. Notably, the positive accuracy for bone lesions improved in the experienced group using SRs (P < 0.05) (Table 6).
| Diseases | Inexperienced group | Experienced group | ||||
|---|---|---|---|---|---|---|
| A1 | A2 | A3 | B1 | B2 | B3 | |
| Intestinal wall | ||||||
| FTR | 37/42 | 35/42 | 35/42 | 41/42 | 42/42 | 42/42 |
| SR | 41/49 | 42/49 | 44/49 | 47/49 | 46/49 | 47/49 |
| P-value | 0.548 | 0.754 | 0.364 | / | 0.723 | 0.497 |
| Intestinal periphery | ||||||
| FTR | 32/39 | 27/39 | 25/39 | 37/39 | 38/39 | 39/39 |
| SR | 38/41 | 39/41 | 37/41 | 41/41 | 41/41 | 40/41 |
| P-value | 0.272 | 0.006 | 0.011 | 0.234 | / | / |
| Blood vessel | ||||||
| FTR | 5/13 | 7/13 | 5/13 | 11/13 | 11/13 | 13/13 |
| SR | 8/8 | 8/8 | 7/8 | 8/8 | 8/8 | 8/8 |
| P-value | 0.007 | 0.046 | 0.027 | 0.505 | 0.505 | / |
| Other organs | ||||||
| FTR | 10/15 | 8/15 | 12/15 | 14/15 | 13/15 | 13/15 |
| SR | 17/18 | 17/18 | 16/18 | 18/18 | 18/18 | 18/18 |
| P-value | 0.039 | 0.019 | 0.852 | / | 0.199 | 0.199 |
| Bone | ||||||
| FTR | 0/6 | 0/6 | 1/6 | 3/60 | 2/60 | 3/60 |
| SR | 7/9 | 9/9 | 9/9 | 9/9 | 9/9 | 9/9 |
| P-value | 0.007 | < 0.001 | 0.002 | 0.044 | 0.011 | 0.044 |
4.6. Satisfaction with the Reporting Method
The satisfaction scores of the experienced group (3.2 points) were significantly higher than those of inexperienced radiologists (2.6 points) when using FTRs (z = -2.767, P = 0.034). The satisfaction scores of SRs in the experienced (4.1 points) and inexperienced (4.0 points) groups were superior to those of FTRs (z = -3.789, P < 0.001 and z = -4.116, P < 0.001, respectively), although no significant difference was observed between the two groups regarding the satisfaction scores when using SRs (z = -0.624, P = 0.533) (Table 7).
| Variables | FTR | SR | Z-value | P-value |
|---|---|---|---|---|
| Inexperienced group | 2.6 | 4 | -4.116 | < 0.001 |
| Experienced group | 3.2 | 4.1 | -3.789 | < 0.001 |
| Z-value | -2.767 | -0.624 | ||
| P-value | 0.034 | 0.533 |
Comparison of Satisfaction Scores
5. Discussion
Accurate radiological assessment and diagnosis of SBDs using MSCT enterography is of great importance. It is essential to use standardized templates to determine the correct treatment approach and improve the clinical outcomes of patients. It has been shown that CT diagnosis reporting for SBDs are mainly FTRs, causing significant differences in report quality within a region and even in a single department (20, 21). As recommended by the Intersociety Conference, SRs have been shown to improve the intrinsic report quality by reducing variability and certain error types in radiological reports. Moreover, they have been shown to have higher clinical practicability than FTRs (11, 22).
In the present study, we developed an SR template of small bowel imaging based on the MSCT technique, which was divided into three categories according to the disease type: (1) small intestinal neoplastic lesions; (2) inflammatory bowel disease; and (3) vascular disease. The report template contained complete information and key clinical diagnostic points for clinical needs. The effect of SRs on report quality was investigated, and the SRs and FTRs by radiologists with different levels of seniority in radiology were evaluated. It was found that SRs were superior to FTRs and could improve the reporting quality of physicians, especially inexperienced radiologists.
Some professional radiological institutions have attempted to introduce standardized SR templates (11). The SRs are gradually becoming accepted by radiologists and clinicians because of their high content integrity, clear organization, high report quality (19), and few spelling and grammatical errors (22). The misdiagnosis rate of imaging signs in SRs has been shown to be significantly lower than that of FTRs, whereas their diagnosis accuracy was higher (23). Meanwhile, several studies have indicated that SRs do not have obvious advantages over FTRs in terms of efficiency or quality of radiological reports (18). Although SRs have been gradually applied for CT scans of many organs (24, 25), their efficiency in the diagnosis of SBDs remains unclear.
In the current study, the diagnostic accuracy of FTR and SR methods for the key report elements was examined. It was found that the accuracy of these methods for intestinal peripheral artery, blood vessel, bone, and other abdominal organ diseases improved in the inexperienced group using the SR method. Similarly, the radiologists’ accuracy in detecting all the mentioned diseases increased numerically in the experienced group; particularly, comparison of diagnostic accuracy for bone diseases showed a significant difference between the FTR and SR methods (Table 6). These findings are inconsistent with the results of a study by Johnson et al., suggesting that SRs did not have an advantage in terms of accuracy over FTRs (18). This may be related to the fact that both reporting methods focused on cerebrovascular and cerebral parenchyma, and factors affecting the report accuracy might have been related to the physicians’ diagnostic experience (18).
In this regard, Nguyen et al. suggested that SRs of interventional radiology could improve compliance with radiation dose and contrast reporting, improve satisfaction, and decrease the writing time (26). Moreover, Persigehl et al. showed that SR templates contributed to optimization of radiological reporting, including completeness, repeatability, and differential diagnosis of solid and cystic pancreatic tumors in CT scans and magnetic resonance imaging (MRI) (27). In the clinical examinations of MSCT enterography in the present study, we often focused on lesions in the intestinal wall and ignored extraintestinal diseases, leading to misdiagnoses. The present study showed no significant difference in the accuracy of the two reporting methods for the intestinal wall disease, which is consistent with the results reported by Johnson and colleagues. Besides, our findings revealed that SRs reduced the misdiagnosis rate and total missed diagnosis rate of blood vessel, bone, and other abdominal organ diseases, especially for low-seniority radiologists, which is consistent with the results of a study by Lin et al. (23). Therefore, application of MSCT SRs to SBDs can help improve the positive accuracy of detecting extraintestinal diseases and reduce the misdiagnosis and total missed diagnosis rates.
For the adoption of SR in clinical practice, several issues need to be considered. First, SRs are more suitable for diseases with clear indications, and definite diagnostic criteria, such as breast and prostate cancers. Overall, there are many diseases of the small intestine with varying imaging characteristics. Therefore, it is necessary to construct SRs of various modes, including tumors, inflammation, and vascular disease. Before the application of SRs, it is important to determine which SRs are suitable for these conditions.
Second, today, there is no SR method for small intestinal CT imaging. Therefore, in the design of report content, it is necessary to collect the opinions of all related personnel as much as possible, including radiologists and clinicians, and integrate their diagnostic opinions and experience, as well as terminologies previously reported. The basic elements and clinical requirements of a report should be formulated via discussions. Subsequently, the report template should be improved according to the feedback of different physicians, which is a long and difficult process. Third, in clinical practice, the developed SR template cannot be used for all intestinal diseases, and some parts of it need to be combined with FTRs.
There were several limitations to this study. First, the number of SBD cases and the number of radiologists participating in this study were insufficient, leading to statistical bias in the results. Besides, there may be some bias in the selection of physicians and patients. We made efforts to reduce such bias. For example, the physicians included in this study were selected based on the similar number of working years and passing the training program. Also, for case selection, the disease types for the two methods (FTRs and SRs) were basically similar. Also, we included patients who had no surgical indications (e.g., mesenteric vascular disease, non-strangulated intestinal obstruction, and inflammatory bowel disease), and surgical pathology as the gold standard was not performed for these patients, although previous studies have demonstrated that clinical data, biochemical indicators, and imaging data can be used as diagnostic standards (28-31); to ensure a more reliable accuracy evaluation, these patients should be excluded. Second, pretreatment preparation, scanning techniques, and individual differences between patients could partially influence the manifestations of SBDs, and perfect intestinal filling and excellent image quality were not guaranteed for all patients in this study. Finally, this was a retrospective single-center study; therefore, further prospective multicenter studies are warranted.
In conclusion, the use of SRs in MSCT enterography by radiologists could improve the writing efficiency and reporting satisfaction compared to FTRs and increase the diagnostic accuracy of SBDs. Besides, the SR method could reduce the misdiagnosis rate of extraintestinal diseases and the overall misdiagnosis, especially for inexperienced radiologists. Overall, SRs may help increase the homogeneity of radiology diagnosis reports.
