


1. Background
Magnetic resonance imaging (MRI) can be potentially used in the clinical diagnosis of Meniere’s disease (MD). After Zou et al. first reported the separate visualization of endolymphatic and perilymphatic spaces in individuals using MRI (1), Nakashima et al. (2) indicated the feasibility of gadolinium-enhanced MRI for endolymphatic hydrops (EH) visualization in patients with MD. A significantly enhanced image contrast in the perilymphatic space allowed for delineation of endolymphatic and perilymphatic regions. It has been reported that three-dimensional fluid-attenuated inversion recovery (3D-FLAIR) imaging can depict EH following an intravenous injection of a gadolinium-based contrast media (GBCM) (3-7).
In a previous study, the optimal scan interval was four hours after the intravenous injection of GBCM at a single dose (0.2 mL/kg) (4). However, the concentration of GBCM in the perilymphatic area was too low to be detected in 3D-FLAIR images after single-dose intravenous injections in patients without impaired permeability of the blood labyrinthine barrier (8). Also, achieving consistent gadolinium enhancement in the upper part of the cochlea was challenging (3, 9, 10), although this strategy has been widely used in some clinical applications; therefore, a higher dose of contrast agent is required in labyrinthine imaging. Under the maximal dose of gadolinium for human imaging approved by FDA (i.e., 0.3 mmol/kg or 0.6 mL/kg), a double-dose injection (0.4 mL/kg) has been applied in clinical practice for higher signal intensity (4, 11). However, optimal image contrast was not reported four hours after double-dose injections in our daily practice. Therefore, investigating the optimal scan interval is crucial following the double-dose administration of a contrast agent.
On the other hand, the imaging volume of the bilateral inner ear must be adjusted in three dimensions during MR experiments. While proper adjustment in the axial and coronal planes can ensure a symmetrical display of bilateral inner ears, a suitable scan angulation in the sagittal view plays a crucial role in labyrinthine imaging by representing maximum areas of the utricle, saccule, and lateral semicircular canal (SCC) on the same slice for accurate estimation of EH herniation in the lateral semicircular canal, without extra image reconstruction. However, the optimal scan angulation based on the anterior skull base remains unknown.
2. Objectives
This study aimed to detect the optimal 3D-FLAIR imaging parameters in labyrinthine fluid imaging, including the optimal scan interval in double-dose contrast administrations and scan angulation, in patients with vertigo and sensorineural hearing loss.
3. Patients and Methods
3.1. Study Sample
This cross-sectional clinical study, which was approved by our hospital research ethics board, was performed on 22 patients (age, 48.23 ± 12.69 years) with unilateral vertigo and sensorineural hearing loss, who visited our outpatient department from July 2018 to June 2019. Written informed consent was obtained from all participants. The inclusion criteria were age above 18 years and having unilateral vertigo and sensorineural hearing loss. On the other hand, the exclusion criteria were as follows: (1) Physical trauma, head and neck neoplasms, or brainstem disease; (2) a history of chronic suppurative or inflammatory ear disease or a history of ear surgery; (3) hematological diseases or severe mental disorders; (4) a history of treatment with chemotherapy drugs or other immunosuppressive agents; (5) a history of allergies to GBCM or MR-related contraindications, including cardiac pacemakers and claustrophobia; and (6) not signing the written informed consent form.
All patients underwent a double-dose intravenous injection of gadobenate dimeglumine (0.4 mL/kg of Gd-BOPTA; MultiHance, Bracco Pharmaceutical Co. Ltd., Shanghai, China). For each patient, 3D-FLAIR images were acquired at four, six, and eight hours post-GBCM injection. Besides, 3D T2-weighted imaging (T2WI) was performed six hours after the contrast agent administration to acquire reference images of the labyrinthine-fluid space anatomy. No patients were excluded from the study due to insufficient image quality.
3.2. Magnetic Resonance Experiments
All MR experiments were performed on a 3-tesla MR system (Discovery 750w, GE Healthcare, USA), equipped with a 19-channel phased-array head and neck coil. A 3D-FLAIR sequence was used for labyrinthine fluid imaging with the following scan parameters: Repetition time (TR), 9000 ms; echo time (TE), 130 ms; inversion time, 2500 ms; echo train length (ETL), 140; bandwidth, 36 kHz; matrix size, 256 × 256; number of excitations (NEX), 2; slice thickness, 1.6 mm; overlap, 50%; and field of view (FOV), 21 cm × 16 cm. The scan time was five minutes and 46 seconds. A 3D-T2WI sequence was also used for labyrinthine fluid imaging with the following scan parameters: TR, 2500 ms; TE, 102 ms; ETL, 120; bandwidth, 42 kHz; matrix size, 256 × 256; NEX, 2; slice thickness, 1.0 mm; overlap, 50%; and FOV = 21 cm × 16 cm. The scan time was two minutes and 41 seconds.
3.3. Imaging Data Analysis
All data were processed on an ADW 4.6 workstation (GE Medical Systems, USA). The gadolinium contrast agent enters the perilymph through the blood-perilymph barrier more easily than the blood-endolymph barrier. A high signal intensity in the perilymphatic space, despite a low signal intensity in the endolymphatic space can be observed, especially when the permeability of the blood-labyrinth barrier increases; the signal difference allows for the visualization of endo- and perilymphatic spaces (12). To quantitatively evaluate contrast enhancement in the cochlear fluid, the regions of interest (ROIs) were manually selected by an experienced head and neck radiologist in the basal turn of the cochlea (ROI, approximately 6 mm2), brainstem (ROI, 4 mm2), and cerebrospinal fluid space of cerebellopontine angle (ROI, 4 mm2) on 3D-FLAIR images of all patients (Figure 1). The signal intensity ratio (SIR) was calculated using the following equation:
where SI of the cochlea represents the signal intensity in the cochlear basal turn, and SI of the brainstem represents the signal intensity in the brainstem. Besides, signal intensities in bilateral cochlear regions (i.e., with and without affection) were measured using the following contrast-to-noise ratio (CNR) equation:
where SI of the cochlea represents the signal intensity in the cochlear basal turn; SI of the cerebrospinal fluid is the signal intensity in the cerebrospinal fluid space; and σ of the brainstem is the standard deviation of the signal intensity in the brainstem.
 on a contrast-enhanced three-dimensional fluid-attenuated inversion recovery (3D-FLAIR) image. An ROI for the cochlear fluid signal intensity measurement is manually drawn around the cochlear basal turn. Circular ROIs for the signal intensity measurement of the brainstem and cerebellopontine angle are respectively set in the artifact-free areas of the two structures.")
The regions of interest (ROIs) on a contrast-enhanced three-dimensional fluid-attenuated inversion recovery (3D-FLAIR) image. An ROI for the cochlear fluid signal intensity measurement is manually drawn around the cochlear basal turn. Circular ROIs for the signal intensity measurement of the brainstem and cerebellopontine angle are respectively set in the artifact-free areas of the two structures.
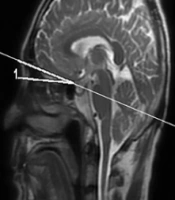
The radiologist reviewed the images and scored the separation of endolymph and perilymph on 3D-FLAIR images in the same session. The separate visualization of cochlear and vestibular endolymph was scored as follows: (1) “Impossible to recognize”; (2) “some of it can be recognized”; (3) “most of it can be recognized”; and (4) “all of it can be recognized” (9). To determine the optimal scan angulation, the anterior skull base was used as the baseline in the sagittal direction (zero degree). Depending on whether EH herniation is present in the lateral semicircular canal, a subjective criterion was defined, indicating that the relative maximum areas of the utricle, saccule, and lateral SCC could be displayed on the same slice in optimal angulation (Figure 2A and B). The 3D-FLAIR images of 22 patients were reconstructed at an optimal angulation. An experienced head and neck radiologist, who was blind to the clinical findings and scan intervals following the administration of GBCM, analyzed the MR images qualitatively and recorded the optimal angulation.
. The scan angulation with the anterior skull base in the sagittal position (A) was 10.8 degrees. The axial three-dimensional fluid-attenuated inversion recovery (3D-FLAIR) images (B) scanned at this angulation (A) display the relative maximum areas of the saccule (solid arrows), utricle (dotted arrows), and lateral semicircular canal (SCC) (arrowheads) on the same level. The scan angulation with the anterior skull base in the sagittal position (C) is 0. When scanned at this angle, axial 3D-FLAIR images are acquired (D). The axial 3D-FLAIR images (D) scanned at the abovementioned angulation (C) display the saccule (solid arrows) and utricle (dotted arrows), while the posterior section of the lateral SCC (arrowheads) is not shown on the same level simultaneously.")
A 52-year-old male patient, suspected of Meniere’s disease (MD). The scan angulation with the anterior skull base in the sagittal position (A) was 10.8 degrees. The axial three-dimensional fluid-attenuated inversion recovery (3D-FLAIR) images (B) scanned at this angulation (A) display the relative maximum areas of the saccule (solid arrows), utricle (dotted arrows), and lateral semicircular canal (SCC) (arrowheads) on the same level. The scan angulation with the anterior skull base in the sagittal position (C) is 0. When scanned at this angle, axial 3D-FLAIR images are acquired (D). The axial 3D-FLAIR images (D) scanned at the abovementioned angulation (C) display the saccule (solid arrows) and utricle (dotted arrows), while the posterior section of the lateral SCC (arrowheads) is not shown on the same level simultaneously.
3.4. Statistical Analysis
Statistical analyses were performed in IBM SPSS version 25.0 (IBM Corp. Released 2017. IBM SPSS Statistics for Windows, Version 25.0. Armonk, NY: IBM Corp.). The normal distribution of SIR and CNR values and the non-normal distribution of scores for the separate visualization of the endolymphatic space were confirmed in statistical analyses. The SIR and CNR values of images acquired at different post-injection intervals were systematically compared using repeated measures analysis of variance (ANOVA). Moreover, Mauchly’s test of sphericity was performed for the variance-covariance matrix in repeated observations. The scores of separate visualization of the endolymphatic space in the cochlea and vestibule, acquired at different post-injection intervals, were systematically compared using Friedman test. Moreover, Bonferroni post hoc test was performed to compare all SIR and CNR values, as well as the scores of separate visualization of the endolymphatic space at different post-injection intervals. The optimal scan angulation and the values of SIR and CNR in the affected and unaffected sides were separately compared using paired sample t-test. The level of statistical significance was set at 0.05.
4. Results
The patients’ characteristics are presented in Table 1. Twenty-two patients (age, 48.23 ± 12.69 years) with unilateral vertigo and sensorineural hearing loss were included in this study. The 3D-FLAIR images, acquired six hours after double-dose injections, indicated the strongest image contrast in the cochleae of 44 ears in 22 patients (Figure 3). The EH could be identified in 17 out of 22 patients with unilateral vertigo and sensorineural hearing loss (17/22), 14 of whom had cochlear hydrops; also, all 17 patients showed vestibular hydrops in the affected ears (Table 1). Moreover, the SIR and CNR values for the cochleae were calculated in the affected ears of all 22 patients at four, six, and eight hours post-contrast injection (Table 2).
| Characteristics | Values |
|---|---|
| Age (y) | 48.23 ± 12.69 |
| Sex | |
| Male | 8 |
| Female | 14 |
| Endolymphatic hydrops | |
| Cochlear hydrops | 14 |
| Vestibular hydrops | 17 |
a Values are expressed as mean ± SD or number.
. The axial three-dimensional fluid-attenuated inversion recovery (3D-FLAIR) images at the left cochlear basal turn level are acquired at 4 h (A), 6 h (B), and 8 h (C) after an intravenous injection of a gadolinium-based contrast media (GBCM). The signal intensity of the cochlear basal turn is the highest on images obtained at 6 h post-contrast administration (arrows).")
A 39-year-old male patient with Meniere’s disease (MD). The axial three-dimensional fluid-attenuated inversion recovery (3D-FLAIR) images at the left cochlear basal turn level are acquired at 4 h (A), 6 h (B), and 8 h (C) after an intravenous injection of a gadolinium-based contrast media (GBCM). The signal intensity of the cochlear basal turn is the highest on images obtained at 6 h post-contrast administration (arrows).
| Parameters and time | Values a | 95% CI | F-value | P-value |
|---|---|---|---|---|
| Affected side | ||||
| SIR | 44.93 | < 0.001 | ||
| 4 h b | 1.65 ± 0.24 | 1.54, 1.76 | ||
| 6 h | 2.09 ± 0.47 | 1.89, 2.31 | ||
| 8 h b | 1.72 ± 0.43 | 1.53, 1.92 | ||
| CNR | 35.75 | < 0.001 | ||
| 4 h b | 13.88 ± 5.54 | 11.43, 16.34 | ||
| 6 h | 19.17 ± 6.81 | 16.15, 22.19 | ||
| 8 h b | 12.22 ± 4.96 | 10.02, 14.42 | ||
| Unaffected side | ||||
| SIR | 21.50 | < 0.001 | ||
| 4 h b | 1.58 ± 0.27 | 1.46, 1.70 | ||
| 6 h | 1.82 ± 0.34 | 1.67, 1.97 | ||
| 8 h b | 1.57 ± 0.30 | 1.43, 1.70 | ||
| CNR | 22.16 | < 0.001 | ||
| 4 h b | 12.20 ± 3.88 | 10.49, 13.92 | ||
| 6 h | 15.42 ± 4.58 | 13.39, 17.45 | ||
| 8 h b | 10.61 ± 3.87 | 8.90, 12.33 | ||
Abbreviations: SIR, signal-intensity ratio; CNR, contrast-to-noise ratio; CI, confidence interval
a Values are expressed as mean ± SD.
b P < 0.01 vs. 6 h
The relatively normal distribution of SIR and CNR values was confirmed by Shapiro-Wilk test. The variance-covariance matrix for SIR in the affected side (aSIR) was inequal based on the results of Mauchly’s test of sphericity (χ2 = 6.35, P = 0.042; corrected by Huynh-Feldt method, ε = 0.839). However, the variance-covariance matrices of SIR in the unaffected side (uSIR), CNR in the affected side (aCNR), and CNR in the unaffected side (uCNR) were equal (χ2 = 3.94, 1.11, and 1.14, respectively; P = 0.139, 0.573, and 0.564, respectively). Significantly higher SIR and CNR values were separately observed six hours after contrast injection in both unaffected and affected ears relative to values reported at four and eight hours post-injection (4 h vs. 6 h, aSIR: 1.65 ± 0.24 vs. 2.09 ± 0.47, aCNR: 13.88 ± 5.54 vs. 19.17 ± 6.81, uSIR: 1.58 ± 0.27 vs. 1.82 ± 0.34, uCNR: 12.20 ± 3.88 vs. 15.42 ± 4.58, P < 0.001 for all; 6 h vs. 8 h, aSIR: 2.09 ± 0.47 vs. 1.72 ± 0.43, aCNR: 19.17 ± 6.81 vs. 12.22 ± 4.96, uSIR: 1.82 ± 0.34 vs. 1.57 ± 0.30, uCNR: 15.42 ± 4.58 vs. 10.61 ± 3.87, P < 0.001 for all) (Figure 4).
 and contrast-to-noise ratios (CNRs) at different time points. The within-group changes (mean) are shown for SIR of the affected side (A), CNR of the affected side (B), SIR of the unaffected side (C), and CNR of the unaffected side (D).")
Changes in signal-intensity ratios (SIRs) and contrast-to-noise ratios (CNRs) at different time points. The within-group changes (mean) are shown for SIR of the affected side (A), CNR of the affected side (B), SIR of the unaffected side (C), and CNR of the unaffected side (D).
On the other hand, no significant difference was observed in the SIR and CNR values between the affected and unaffected sides at four and eight hours post-contrast injection (P >0.05 for both), whereas a significant difference was found between the affected and unaffected sides six hours after contrast injection (SIR: t = 4.07, P = 0.001; CNR: t = 3.40, P = 0.003). For the separate visualization of perilymphatic and endolymphatic spaces in the cochlea and vestibule of 22 patients, 3D-FLAIR imaging was performed. The corresponding scores are presented in Table 3.
a P < 0.05 vs. 6 h
Significant differences were observed between different time points in scoring the endolymphatic space of the cochlea and vestibule (P < 0.01 for all). Based on the results of Bonferroni post hoc test, the endolymphatic and perilymphatic spaces of both cochlea and vestibule were significantly better observed after six hours compared to four hours in the affected side, as well as the unaffected vestibule (P < 0.05 for all). However, no significant difference was found between intervals of six and eight hours post-injection.
Optimal angulations were determined with an anterior skull base in the sagittal view, which ranged from 6.20° to 13.6° (mean, 10.74 ± 2.24°); they were nearly parallel to the gyrus rectus. A mean angulation of 10.74°, which allowed for the simultaneous visualization of the saccule and utricle, as well as EH herniation in the lateral semicircular canal, can be the optimal scan angulation relative to the anterior skull base (Figure 2A and B) compared to scanning parallel to the anterior skull base (P < 0.001) (Figure 2C and D).
5. Discussion
In this study, the optimal 3D-FLAIR imaging parameters, including the optimal scan interval and scan angulation, in labyrinthine fluid imaging were investigated in patients with vertigo and sensorineural hearing loss. The results showed that the optimal scan interval was six hours after a double-dose contrast injection, and the best scan angulation ranged from 6.20° to 13.6° (mean, 10.74 ± 2.24°).
The first major finding of this study is that 3D-FLAIR MRI could display EH at four, six, and eight hours following a double-dose contrast injection, and significantly higher CNR and SIR values were observed at six hours post-injection in both unaffected and affected ears compared to other intervals. Significant differences were found between the affected and unaffected sides regarding the SIR and CNR values after six hours. Since CNR reflects signal differences between the endolymphatic and perilymphatic regions, a significantly higher CNR in 3D-FLAIR images at six hours post-injection allowed for a more robust contrast between the endolymphatic and perilymphatic regions compared to images acquired at other intervals; in other words, an interval of six hours after contrast injection can be considered an optimal scan interval at a double dose. In comparison, Naganawa et al. (13) reported the strongest image enhancement in labyrinthine fluid four hours after single-dose injections in all four ears on 3D-FLAIR images. Although some heterogeneous enhancement was observed, the visual discrimination of endolymphatic and perilymphatic spaces was not possible. It was found that the transfer rate of high-molecular-weight substances from blood into the perilymph was faster than the transfer rate of substances from blood into the endolymph (11). Therefore, the endolymphatic space can be differentiated from the perilymphatic space.
Additionally, Nakashima et al. (3) and Chen et al. (14) performed contrast-enhanced MRI at an optimal scan interval (3T) and found 4 h and 3.5 h to be optimal intervals following intravenous single-dose and double-dose injections of GBCM in MD patients, respectively. Both 3D-FLAIR and 3D-real inversion recovery imaging are helpful in evaluating the size of the endolymphatic space (3). However, our finding differs from a previously reported interval of 4 h in single-dose injections (4) and an interval of 3.5 h in double-dose injections (14). A possible reason for this discrepancy can be differences in drug concentration between the study by Nakashima et al. (3) and the present research, which influenced the time of peak drug concentration in the cochlea.
Moreover, in the optimal scan interval of 3.5 h in double-dose injections, Chen et al. (14) only compared contrast-enhanced images between intervals of 3.5 h and 4 h, and no further investigations were carried out in longer intervals. Besides, considering the increasing importance and high sensitivity and specificity of perilymphatic enhancement in patients with MD, evaluation of differences in perilymphatic enhancement after intravenous injection is important. This study indicated a significant difference in terms of SIR and CNR values between the affected and unaffected sides only after six hours; therefore, the optimal scan interval was six hours. The present findings suggest that the scores of separate visualization of the endolymph and perilymph were higher at six hours compared to four hours post-injection. The possible reasons might be higher SIR and CNR values, which reflect differences in signal intensity between the endolymphatic and perilymphatic spaces or other tissues. Besides, SIR, as a proper quantitative indicator of blood labyrinthine barrier damage (15), may be used to monitor the progression of MD (16).
Finally, in the present study, in 3D-FLAIR imaging, the optimal scan angulation was approximately 10.74 ± 2.24 degrees from the anterior skull base in the sagittal view, which allows for visualization of relative maximum areas of the utricle, saccule, and lateral SCC at the same level, without extra image reconstruction. When the bilateral semicircular canals are fully visible at the same level, the saccule and utricle can be simultaneously visualized, and the presence of EH herniation in the lateral SCC can be determined. There are several semi-quantitative MR grading systems for EH assessment (17-21), which need to delineate the areas of the utricle and saccule due to the importance of determining their relative maximum areas at the same level. Besides, Gurkov et al. (22) reported that EH herniation into the lateral SCC indicated the morphological relatedness of impaired caloric responses in MD patients.
In a study by Sugimoto et al. (23), the average hearing thresholds at 500 and 1000 Hz were higher in patients with vestibular EH adjacent to the stapes footplate and EH herniation into the SCC in ears, compared to patients without herniation. Therefore, direct observation of the degree of EH via simultaneous display of lateral SCC on the same level, without extra image processing, is beneficial. It is possible to simultaneously visualize the saccule and utricle and directly evaluate whether EH herniation is present in the lateral SCC with optimal scan angulation; this not only allows for a more efficient clinical diagnosis, but also facilitates the accurate investigation of EH.
One major limitation of this study is that the contralateral normal ears of vertiginous patients were used as the controls. Also, due to ethical considerations, the time to peak drug concentration could not be determined in the cochleae of healthy individuals with a gadolinium injection. Another potential limitation of this study is the double-dose contrast injection (MultiHance, 0.4 mL/kg), which may increase GBCM deposition in the brain. However, this concern may not be critical, as the drug dose is not high in one scan, and the patient does not need to receive repeated injections. Finally, the patients were only scanned with a 19-channel head and neck coil, although the images enabled the diagnosis of EH.
In summary, the optimal scan interval was six hours after a double-dose injection of GBCM, and the optimal scan angulation was 10.74 ± 2.24 degrees from the anterior skull base. Based on the results, 3D-FLAIR imaging, with the optimal scan interval and scan angulation, can reliably visualize the endolymphatic space and sensitively reveal the cochlear blood-labyrinth barrier damage without extra image reconstruction.
