


1. Background
Recently, there has been a renewed interest in the functional evaluation of coronary lesions. Multiple studies have described the value of functional indicators in the accurate diagnosis of coronary artery disease (CAD). Some research has been conducted on the fractional flow reserve (FFR)-guided percutaneous coronary intervention (PCI) (1), myocardial microcirculation resistance index (2), and myocardial blood flow (3). The results of these studies suggested a hidden relationship between the degree of coronary artery stenosis and downstream myocardial remodeling (4, 5). In CAD, myocardial ischemia is the primary indication for PCI and also a prominent factor in myocardial remodeling (6, 7). On the other hand, myocardial remodeling aggravates myocardial ischemia (8). Therefore, there is a mutual increase in myocardial ischemia and myocardial remodeling, which may aid in quantifying the myocardial blood flow (9).
2. Objectives
The present study aimed to evaluate the advantages of myocardial blood flow index (MBFI) in the diagnosis of chronic obstructive CAD compared to coronary computed tomography angiography (CCTA).
3. Patients and Methods
3.1. Clinical Protocols
3.1.1. Consecutive Collection of Medical Records
The clinical medical follow-up data of 920 patients suspected of CAD were collected continuously, including the imaging data of CCTA and invasive coronary angiography (ICA) from February 2018 to September 2018. Finally, 68 cases were selected for this study. This research was approved by the ethics committee (No. 2022-B009) and implemented according to the tenets of the Declaration of Helsinki (www.wma.net/e/policy/). All patients signed a written informed consent form. The exclusion criteria are listed in Figure 1.

The flowchart of patient enrollment; STEMI, ST segment elevation myocardial infarction; LVEF, left ventricular ejection fraction; BMI, body mass index; eGFR, estimated glomerular filtration rate; BP, blood pressure; CCTA, coronary computed tomography angiography; and ICA, invasive coronary angiography.
3.2. Coronary Computed Tomography Angiography Protocol
3.2.1. Scanning Parameters
Using CCTA (Dual-Source CT Somatom Definition, Siemens, Germany) with prospective electrocardiogram (ECG) triggering (Adaptive Sequential, Siemens Healthcare, Germany), the scanning parameters were as follows using a CareDose 4D automatic exposure control system: 2 × 64 × 0.6 mm collimation with a Z-flying focal spot; gantry rotation time, 330 ms; pitch, 0.2 - 0.43; and voltage/tube product, 100 - 120 kV. The tube current was set automatically according to the weight of each patient.
Image acquisition was triggered at 35 - 75% of R-R interval. The Hounsfield unit (HU) of the descending aorta was dynamically detected 10 seconds after the contrast agent injection with the tracer technique. If the threshold was 120 HU, the triggering started four seconds later. The total dosage was 50 - 70 mL (contrast agent: 370 mgI/mL of iopromide, Ultravist, Bayer, Germany) followed by 30 mL of saline. The injection rate (3.8 - 4.2 mL/s) was adjusted according to the patient’s heart rate, body mass index (BMI), and cardiac function. Reconstruction was also performed with a medium smooth convolution kernel (B26f) at a slice thickness of 0.75 mm in 0.3-mm increments.
3.2.2. Computed Tomography Image Reconstruction
An offline commercial Siemens Syngo platform (Siemens Medical Solutions, Erlangen, Germany) was used for computed tomography (CT) image reconstruction. The severest lesion was selected for analysis using the semi-automatic software. It was calculated according to the minimal lumen diameter and the corresponding reference diameter. The stenosis degree was categorized as: Normal (0%), mild (1 - 49%), moderate (50 - 69%), severe (70 - 99%) and total occlusion.
3.2.3. Image Quality Assessment
The image quality was evaluated by two prominent experts with 10 years of experience in CCTA, who reached consensus through consultation. The fine images were selected for this study (10).
3.3. Myocardial Blood Flow Index
3.3.1. Myocardial Blood Flow Model
As current is equal to the ratio of voltage to resistance, myocardial blood flow is equal to the ratio of myocardial perfusion pressure to myocardial resistance. Based on the lumped parameter network (LPN) (11), as a parallel characteristic impedance model (12), the myocardial blood flow is primarily equal to the ratio of myocardial perfusion pressure to the myocardial mass (13). Blood circulation in the myocardium was completed within five cardiac cycles (14); in other words, after five cardiac cycles, the blood flow volume can distribute throughout the myocardium. Additionally, the right atrial pressure is about 0 mmHg at rest (15); consequently, the patient’s diastolic blood pressure (DP) can be regarded as the myocardial perfusion pressure. Therefore, the ratio of DP multiplied by five cardiac cycles to the mass represents the myocardial blood flow. As the BMI (16), sex (17), and age (18) are all associated with the myocardial blood flow, the myocardium blood flow model (Figure 2) should integrate these factors, which differs from the hyperemic myocardial blood flow index (19).

The myocardial blood flow model
3.3.2. Calculation of Myocardial Blood Flow Index
The MBFI was calculated and adjusted according to the literature (9, 12, 14, 20). The MBFI formula is as follows:
Where n represents the age interval, M represent myocardial mass and HR represent heart rates.
3.4. Invasive Coronary Angiography Protocol
Basic ICA was performed within one week after the CCTA protocol. The coronary arteries were divided into 15 segments according to the standards of the American Heart Association. The results were reported by two experts with 20 years of experience in cardiac intervention, who was unaware of the results of CCTA. They reached consensus through consultation. The stenosis degree was categorized as normal (no stenosis), mild (< 50% stenosis), moderate (50 - 69% stenosis), severe (≥ 70% stenosis), and total occlusion. The stenosis degree was categorized as: normal (0%), mild (1 - 49%), moderate (50 - 69%), severe (70 - 99%) and total occlusion.
3.5. Diagnostic Analysis
By using ICA as the gold standard (≥ 70% stenosis), the diagnostic performance of MBFI and CCTA was investigated. If the value of MBFI was less than or equal to the optimal cutoff value, the more obvious lesion was considered as severe. Similarly, if the result of CCTA was more than or equal to 70% (diameter narrowing), the lesion was considered severe.
3.6. Statistical Analysis
Continuous variables are expressed as mean ± standard deviation (SD), while categorical variables are presented as frequency or percentage. The diagnostic power of MBFI and CCTA was evaluated using the receiver operating characteristic (ROC) curve. The area under the curve (AUC) of MBFI was compared with that of CCTA by DeLong’s test. Chi-square test was also used for enumeration data, and P < 0.05 was considered statistically significant.
4. Results
The baseline data of the enrolled patients are summarized in Table 1. In 68 cases, the average scan dose of CCTA was 3.02 ± 1.15 millisievert (mSv). There were 28 cases with ≥ 70% stenosis. The optimal cutoff values for MBFI and CCTA were 0.111 and 70%, respectively. The AUC was 0.857 for MBFI and 0.621 for CCTA, showing a significant difference (Z = 2.091, P = 0.0365) (Figure 3). The sensitivity, specificity, positive predictive value, and negative predictive value were 92.31%, 92.86%, 88.89%, and 95.12% for MBFI versus 61.54%, 78.57%, 64.00%, and 76.74% for CCTA, respectively. The diagnostic accuracy was also estimated at 92.65% for MBFI and 72.06% for CCTA (χ2 = 9.844, P = 0.0017) (Table 2 and Figures 4 and 5).
| Characteristics | Total (n = 68) |
|---|---|
| Gender | |
| Male | 39 |
| Female | 29 |
| Age (y) | 57 ± 10.2 |
| History of risk factors | |
| Hypertension b | 21 |
| Diabetes mellitus c | 24 |
| Dyslipidemia d | 38 |
| Smoking (n) | 17 |
| Family history of CAD | 5 |
| Average heart rate (time/min) | 73 ± 11.7 |
| Average diastolic blood pressure (mmHg) | 83 ± 11.9 |
| Average serum creatinine (μmol/L) | 82 |
| Average body mass index (kg/m2) | 23 ± 3.5 |
| Results of ICA | |
| One-vessel stenosis | 33 |
| Two-vessel stenosis | 21 |
| Multi-vessel stenosis | 14 |
| A left main lesion with three-vessel stenosis e | 1 |
| Average radiation dose (mSv) | 3.02 ± 1.15 |
The Baseline Characteristics of the Patients (n = 68) a
 and computed coronary tomography angiography (CCTA)")
The receiver operating characteristiccurves for the myocardial blood flow index (MBFI) and computed coronary tomography angiography (CCTA)
| Method | COV | Sensibility (95% CI) | Specificity (95% CI) | PPV (95% CI) | NPV (95% CI) | AUC (95% CI) | DA | P Value |
|---|---|---|---|---|---|---|---|---|
| MBFI | 0.111 | 92.31% (0.734 - 0.987) | 92.86% (0.794 - 0.981) | 88.89% (0.697 - 0.971) | 95.12% (0.822 - 0.992) | 0.857 (0.751 - 0.930) | 92.65% | 0.0001 |
| CCTA | 70% | 61.54% (0.407 - 0.791) | 78.57% (0.628 - 0.892) | 64.00% (0.426 - 0.813) | 76.74% (0.610 - 0.877) | 0.621 (0.495 - 0.736) | 72.06% | 0.0710 |
The Receiver Operating Characteristic Curve Analysis of Myocardial Blood Flow Index and Coronary Computed Tomography Angiography
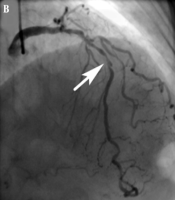
 artery. A, The computed coronary tomography angiography (CCTA) image shows suspected stenosis in the LAD (arrow). The myocardial blood flow index (MBFI) is 0.082, which indicates a suspected lesion with severe stenosis; B, The invasive coronary angiography (ICA) image shows the severe lesion with 95% stenosis (arrow).")
A 68-year-old male patient with unstable angina. The imaging findings of the left anterior descending (LAD) artery. A, The computed coronary tomography angiography (CCTA) image shows suspected stenosis in the LAD (arrow). The myocardial blood flow index (MBFI) is 0.082, which indicates a suspected lesion with severe stenosis; B, The invasive coronary angiography (ICA) image shows the severe lesion with 95% stenosis (arrow).
 artery in a 71-year-old male patient with unstable angina. A, Computed coronary tomography angiography (CCTA) image shows a suspected severe stenosis (arrow) in the LAD (arrow); B, The invasive coronary angiography images show a gentle lesion with 10% stenosis. Myocardial blood flow index is 0.128, which suggests a lesion with no severe stenosis.")
The imaging findings of the left anterior descending (LAD) artery in a 71-year-old male patient with unstable angina. A, Computed coronary tomography angiography (CCTA) image shows a suspected severe stenosis (arrow) in the LAD (arrow); B, The invasive coronary angiography images show a gentle lesion with 10% stenosis. Myocardial blood flow index is 0.128, which suggests a lesion with no severe stenosis.
5. Discussion
Due to its high temporal and spatial resolution, CCTA can provide the anatomical information of lesions, including the features, extent, and severity of stenosis. This method enjoys a reputation as an accurate noninvasive first-line method in the guidelines to evaluate patients with a low-to-intermediate risk of CAD due to its high sensitivity, specificity, and negative predictive value (21). However, its diagnostic accuracy may reduce because of respiratory artifacts and calcified plaques; besides, it cannot show whether coronary artery lesions have any hemodynamic significance (22). Nevertheless, it has the potential to screen patients with ischemic heart disease (IHD) (23).
Noninvasive methods, such as stress echocardiography, cardiovascular magnetic resonance, CCTA combined with myocardial perfusion imaging, and FFR derived from CCTA, can play an important role in evaluating IHD (24, 25). Radionuclide myocardial perfusion, echocardiography, and cardiac magnetic resonance imaging are accurate methods for evaluating myocardial ischemia and are also suitable for the follow-up of IHD cases. Nevertheless, it is difficult to diagnose IHD using these techniques, as they cannot clearly show the coronary arteries. Computed tomography-derived FFR (CT-FFR) has been employed to evaluate functional lesions, resulting in improved prognosis (19), although this method is limited by massive calcifications and image quality (25).
In the present study, MBFI demonstrated a larger AUC than CCTA in the diagnosis of chronic obstructive CAD, with a significant difference (Z = 2.091, P < 0.05). By considering ICA stenosis ≥ 70% as the gold standard for the diagnosis of severe lesions, the sensitivity, specificity, positive predictive value, and negative predictive value of MBFI were estimated at 92.31%, 92.86%, 88.89%, and 95.12%, respectively, which exceeded those of CCTA (61.54%, 78.57%, 64.00%, and 76.74%, respectively). Besides, the diagnostic accuracy of MBFI was significantly higher than that of CCTA (χ2 = 9.844, P < 0.01). Similar to other functional parameters (26), this model, which was composed of cardiac physiological parameters, yielded better diagnostic results compared to the conventional diagnostic method of CCTA and made the diagnosis more accurate.
Although previous studies, using stenosis ≥ 50% as the gold standard, have reported that CCTA has high sensitivity and specificity in the diagnosis of CAD (27, 28), there is little information in the literature to confirm the ability of CCTA in diagnosing CAD, with stenosis ≥ 70% as the gold standard. If stenosis was ≥ 70%, it commonly suggested the possibility of ischemic myocardium. To confirm this possibility, CCTA should be preferably combined with other indices (19, 29). Accordingly, the use of functional parameters is becoming more common to improve diagnostic accuracy, and MBFI may have potential applications in the diagnosis or screening of CAD.
The current study had some limitations. This was a retrospective study, while a prospective study with a larger sample size is suggested to demonstrate the MBFI advantages. Besides, further experimental information is needed to determine whether diabetes plays a role in the model.
In conclusion, the diagnostic ability of MBFI was superior to that of CCTA in identifying lesions with stenosis ≥ 70%. A lower MBFI indicated the need for an upcoming active intervention, while a higher MBFI suggested avoiding unnecessary invasive testing.
