1. Background
Spondyloarthritis (SpA) traditionally encompasses ankylosing spondylitis, psoriatic arthritis and reactive arthritis associated with inflammatory bowel diseases. Sacroiliac joint (SIJ) inflammation is an important and usually the first finding of SpA. Clinical demonstration of sacroiliitis can be difficult due to location of SIJ, its anatomic feature and limited range of motion. Therefore, imaging techniques play an important role in the diagnosis of SpA (1-3). In practice, conventional imaging tools fail to show active inflammation, which may delay the diagnosis (1). Therefore, the assessment of spondyloarthritis international society (ASAS) has studied reevaluation of current classification criteria and development and validation of diagnostic tools to facilitate early diagnosis and assessment of treatment response. Magnetic resonance imaging (MRI) was accepted as one of the major criteria for the diagnosis of axial SpA by ASAS group (4, 5).
MRI of the SIJs has been shown to be superior to radiography and computed tomography (CT) in showing sacroiliitis and gadolinium-enhanced MRI has been shown to be useful in early detection of active sacroiliitis (6, 7). Therefore, it is regarded as the most sensitive imaging modality for detecting early SpA before radiographic appearance of structural lesions (8).
There are four MRI findings of active (acute) sacroiliitis associated with axial SpA: osteitis/bone marrow edema, enthesitis, capsulitis and synovitis (2, 3).
Osteitis/ bone marrow edema is detected as a hyperintense signal on STIR (short tau inversion recovery) and typically as a hypointense signal on T1-weighted (T1W) MRI sequences (9) and is the single indispensable criterion for the diagnosis of active sacroiliitis (2). These signals must be seen on at least two adjacent sections when a single focus is found or on a single section when multiple foci are found (2, 9).
T1-weighted and STIR sequenced MRI protocols are widely used in routine clinical imaging to diagnose clinically suspected active sacroiliitis. Technical protocol has been standardized and should include T1W images to assess tissue structure, T2 or STIR images to detect bone edema and gadolinium-enhanced fat-suppressed T1 images to show tissue inflammation (6, 9, 10).
Bone marrow edema is detected better on fat suppressed (FS) T2 WI and STIR sequences compared with non fat saturated techniques. Contrast difference between normal and edematous bone on T2 WI can be accentuated using fat suppression techniques, either the Spectral fat saturation technique or STIR images (11).
Enhancement does occur in osteitis edema and contrast difference may be highlighted using post-contrast T1 WI with fat saturation (3, 4). For the assessment of active disease, the use of fat suppression is recommended (2, 3, 9). However, there are a number of disadvantages that involve imaging with contrast. First of all is the allergic reaction risk to the contrast agent. Nephrogenic systemic fibrosis may also develop after the use of gadolinium-based contrast agents in patients with chronic renal failure. Moreover, scanning time needs to be longer and therefore the patient needs to stay for a longer period of time whilst being injected with the extra cost of contrast (9, 12).
2. Objectives
The aim of this retrospective study was to assess the value of different MRI sequences to evaluate bone marrow and subchondral bone changes in active sacroiliitis and inter- and intra-observer reliability of these sequences.
3. Patients and Methods
3.1. Subject Selection and Clinical Data
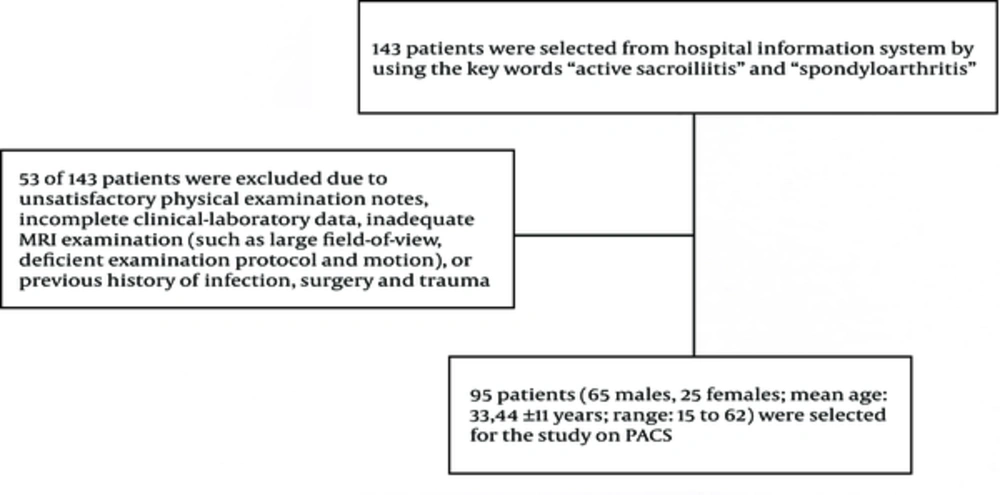
We retrospectively searched hospital information system (HIS) using the keywords “active sacroiliitis” and “spondyloarthritis” between September 2009 and September 2011. One hundred forty three patients were selected from HIS. Fifty-three of 143 patients were excluded because of unsatisfactory physical examination notes, incomplete clinical-laboratory data, inadequate MRI examinations (such as large field-of-view, deficient examination protocol and motion) or previous history of infection, surgery or traumas. From the remaining sample set, 90 patients (65 males, 25 females; mean age 33.44 ± 11 years; range 15 to 62) with MRI findings suggestive of active sacroiliitis were selected on picture archive and communication system (PACS) (Extreme PACS, Ankara, Turkey) by the consensus of two radiologists (OT, NC) (Figure 1).
All patients had undergone MRI scans of the SIJs with and without intravenous gadolinium. All MRI examinations were performed on 1.5 Tesla MRI scanners (Intera Nova and Achieva, Philips Medical Systems, Netherland) using a phased array coil (Table 1).
| Sequence Parameters | TR (ms) | TE (ms) | ST (mm) | Gap (mm) | FOV (mm) | |||||
|---|---|---|---|---|---|---|---|---|---|---|
| MR Unit sequence plane | Achieva | Intera | Achieva | Intera | Achieva | Intera | Achieva | Intera | Achieva | Intera |
| STIR coronal | 2734 | 2802 | 60 | 48 | 4 | 4 | 0.4 | 0.4 | 250 × 250 | 250 × 250 |
| T2 WI axial | 3329 | 3256 | 80 | 86 | 4 | 4 | 0.4 | 0.4 | 260 × 260 | 260 × 260 |
| CE FS T1 WI coronal | 500 | 486 | 18 | 16 | 4 | 4 | 0.4 | 0.4 | 250 × 250 | 250 × 250 |
| CE FS T1 WI axial | 570 | 486 | 18 | 16 | 4 | 4 | 0.4 | 0.4 | 260 × 260 | 260 × 260 |
Abbreviations: WI, weighted imaging; TR, time of repetition; TE, time of echo; ST, slice thickness; CE, contrast enhanced; FS, fat suppressed; STIR, short tau inversion recovery; FOV, field of view.
The sacroiliac joints were retrospectively analyzed by two radiologists (OT, GST) separately blinded to each other’s evaluations one month after selection of patients on PACS station. Each sequence was evaluated at different times (one week apart from each other) in the same monitor of PACS system by each observer. Structural and signal changes and contrast enhancement of periarticular bone of the sacroiliac joints were analyzed separately by each observer (OT, GST).
Subchondral bone signal characteristics involving subchondral bone and bone marrow on each of the sequences on coronal plane, FS T2 WI of the axial plane, contrast enhanced (CE) FS T1 WI of the axial plane and CE FS T1 WI of the coronal plane of both sacroiliac joints were evaluated for active sacroiliitis findings.
Erosions with high signals on STIR or T2-weighted images, subchondral edemas and contrast media enhancement of the sacroiliac joints and periarticular bones were considered as markers for active inflammatory disease (6, 10).
3.2. Statistical Analysis
Percentage of agreement for each reliability pairing was calculated by dividing the number of occasions of complete agreement by total number of assessments. Based on ordinal qualitative assessment scores collected from radiologists, inter- and intra-observer reliability were evaluated with quadratic weighted kappa statistics. R statistical software (Version 2.14.0) (13) with IRR (Various Coefficients of Interrater Reliability and Agreement) package (Version 0.83) was used for all statistical computations.
4. Results
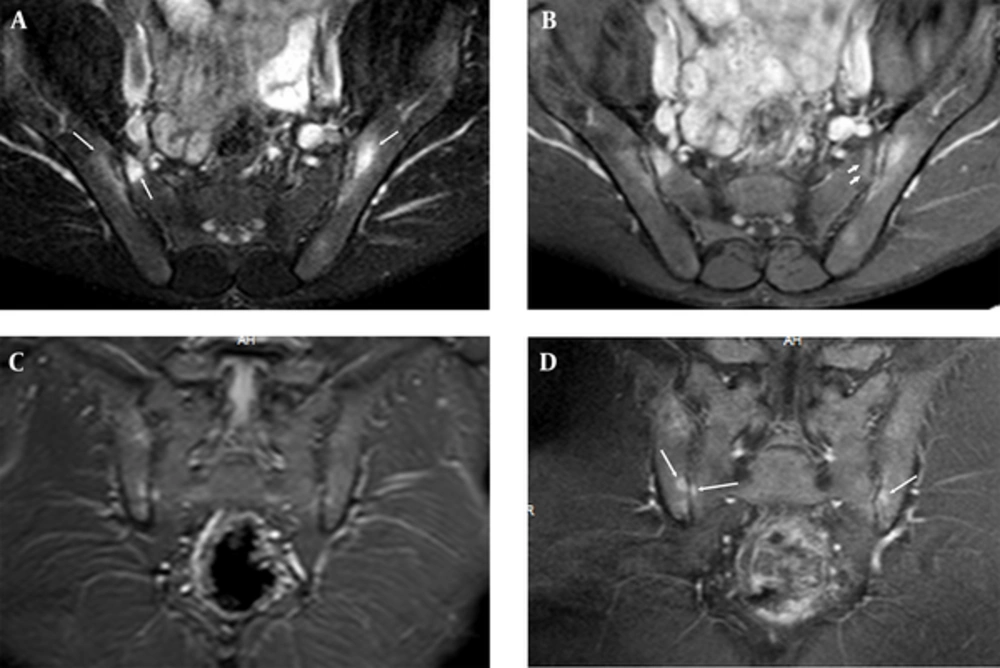
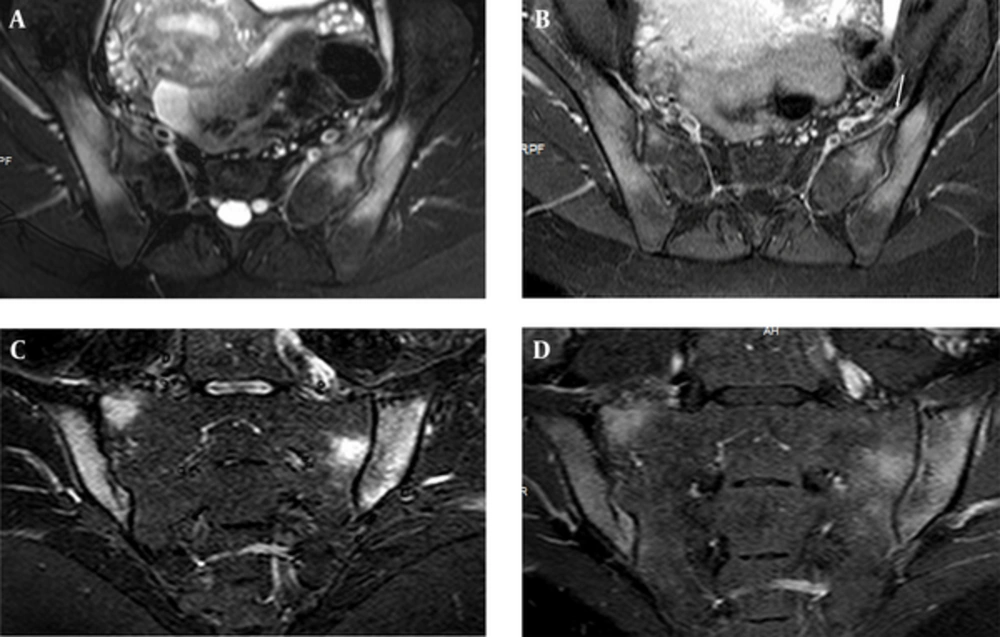
Highest agreement between measurements of observer 1 and 2 was found on CE FS T1 WI of axial plane in right iliac bone (97.78 %), on CE FS T1 WI of coronal plane in left iliac bone (95.56 %), on FS T2 WI in right sacral bone (97.78 %) and on CE FS T1 WI of axial plane in left sacral bone (96.67%) (Figures 2 and 3). Besides, more than 95% agreement was found between the 2 measurements of observer 1 (Table 2). Highest agreement (97.78%) with highest kappa value (0.933) was detected on axial plane of CE FS T1 WI within all sequences. Highest agreement (97.78%) with highest kappa value (0.91) was detected on axial planes of FS T2 WI within sequences taken without contrast injections (Table 2).
Sacroiliac MRI of a 30-year-old male patient who had normal CRP and ESR values and negative result for HLA B27, which shows osteitis. There is periarticular bone edema at bilateral iliac and right sacral bones (long arrows) on fat suppressed (FS) T2 weighted imaging (WI) (A); FS contrast enhanced (CE) T1 WI (B) of axial planes and STIR (C) and T1 WI of coronal planes (D). There is subchondral edema at left sacral bone on FS CE T1 WI (short arrows) (B, C). These periarticular bone edemas are compatible with osteitis.
Edema of both sacral and iliac bones, compatible with osteitis are shown on FS T2 weighted (A) and CE T1 weighted (B) image of axial planes in a 25-year-old female with elevated CRP and ESR values and positive result for HLA B27. STIR (short tau inversion recovery) (C) and FS CE (fat suppressed contrast enhanced) T1 weighted (D) images of coronal plane show the same findings. Left Anterior capsulitis (arrow) is seen on FS T2 W (A) and CE T1 W (B) image of axial planes.
| Edema and Enhancement | Sequence | Percentage of Agreement | Kappa Coefficient | P Value |
|---|---|---|---|---|
| Right iliac | STIR-1 | 96.67 | 0.916 | < 0.001 |
| STIR-2 | ||||
| STIR-1 | 92.22 | 0.814 | < 0.001 | |
| STIR-G | ||||
| T2-1 | 98.89 | 0.963 | < 0.001 | |
| T2-FS-2 | ||||
| T2-1 | 93.33 | 0.792 | < 0.001 | |
| T2-G | ||||
| T1-CE-AX-1 | 100.00 | 1 | < 0.001 | |
| T1-CE-AX-2 | ||||
| T1-CE-AX-1 | 97.78 | 0.933 | < 0.001 | |
| T1-CE-AX-G | ||||
| T1-CE-CR-1 | 97.78 | 0.933 | < 0.001 | |
| T1-CE-CR-2 | ||||
| T1-CE-CR-1 | 91.11 | 0.761 | < 0.001 | |
| T1-CE-CR-G | ||||
| Left iliac | STIR-1 | 96.67 | 0.898 | < 0.001 |
| STIR-2 | ||||
| STIR-1 | 92.22 | 0.762 | < 0.001 | |
| STIR-G | ||||
| T2WI-1 | 100.00 | 1 | < 0.001 | |
| T2WI-2 | ||||
| T2WI-1 | 94.44 | 0.783 | < 0.001 | |
| T2WI-G | ||||
| T1WI-CE-AX-1 | 100.00 | 1 | < 0.001 | |
| T1WI-CE-AX-2 | ||||
| T1WI-CE-AX-1 | 93.33 | 0.793 | < 0.001 | |
| T1WI-CE-AX-G | ||||
| T1WI-CE-CR-1 | 98.89 | 0.946 | < 0.001 | |
| T1WI-CE-CR-2 | ||||
| T1WI-CE-CR-1 | 95.56 | 0.808 | < 0.001 | |
| T1WI-CE-CR-G | ||||
| Right Sacral | STIR-1 | 97.78 | 0.945 | < 0.001 |
| STIR-2 | ||||
| STIR-1 | 91.11 | 0.778 | < 0.001 | |
| STIR-G | ||||
| T2-1 | 98.89 | 0.954 | < 0.001 | |
| T2-2 | ||||
| T2-1 | 97.78 | 0.91 | < 0.001 | |
| T2-G | ||||
| T1-CE-AX-1 | 100.00 | 1 | < 0.001 | |
| T1-CE-AX-2 | ||||
| T1-CE-AX-1 | 94.44 | 0.752 | < 0.001 | |
| T1-CE-AX-G | ||||
| T1-CE-CR-1 | 100.00 | 1 | < 0.001 | |
| T1-CE-CR-2 | ||||
| T1-CE-CR-1 | 92.22 | 0.743 | < 0.001 | |
| T1-CE-CR-G | ||||
| Left Sacral | STIR-1 | 100.00 | 1 | < 0.001 |
| STIR-2 | ||||
| STIR-1 | 93.33 | 0.814 | < 0.001 | |
| STIR-G | ||||
| T2-1 | 100.00 | 1 | < 0.001 | |
| T2-FS-2 | ||||
| T2-1 | 93.33 | 0.748 | < 0.001 | |
| T2-G | ||||
| T1-CE-AX-1 | 100.00 | 1 | < 0.001 | |
| T1-CE-AX-2 | ||||
| T1-CE-AX-1 | 96.67 | 0.889 | < 0.001 | |
| T1-CE-AX-G | ||||
| T1-CE-CR-1 | 98.89 | 0.961 | < 0.001 | |
| T1-CE-CR-2 | ||||
| T1-CE-CR-1 | 92.22 | 0.763 | < 0.001 | |
| T1-CE-CR-G |
Abbreviations and explanations: 1, First evaluation of observer1; 2, second evaluation of observer 1; G, evaluation of observer 2; STIR, short tau inversion recovery sequence; T2, T2 weighted image; T1, T1 weighted image; CE contrast enhanced; AX, axial plane; CR, coronal plane; FS, fat suppressed.
5. Discussion
In our study, edema and contrast enhancement revealing osteitis were seen on all sequences with perfect agreement between observers; however, FS T2 WI and CE FS T1 WI planes showed the highest agreement.
It is crucial to detect active sacroiliitis and differentiate it from chronic changes. Establishing early diagnosis of active sacroiliitis and monitoring it for potential changes after therapies are of particular importance. MRI plays an important role to evaluate sacroiliitis and shows the degree of inflammation without using ionizing radiation.
The earliest signs of sacroiliitis can be identified using MRI. Periarticular bone edema is associated with increased signal in FS FSE T2 W or STIR sequences and with contrast-enhancement in FS FSE T1 W sequences after administration of gadolinium (14). We found that edema and contrast enhancement of periarticular bone revealing active sacroiliitis was shown with the highest agreement and kappa value between observers on CE FS T1 WI within all sequences and on FS T2 WI within pre-contrast sequences.
A timely diagnosis is necessary to start treatments including nonsteroidal antiinflammatory drugs, physiotherapy or anti-TNF (tumor necrosis factor) agents as early as possible, thereby ankylosis formation may be prevented.
Inflammation usually decreases in the later stages of disease and subchondral edema is replaced by post-inflammatory fatty infiltration of bone marrow, which appears hyperintense on T1-weighted sequences. At the final stage of sacroiliac involvement, subchondral sclerosis and subsequently joint fusion and ankylosis develop. At this stage, MRI demonstrates sclerotic changes (which are hypointense on T1- and T2-weighted sequences) and fusion of sacroiliac joints (14).
CT evaluation is better in demonstrating chronic changes of sacroiliitis including sclerotic changes, ankylosis and erosions. However, MRI may also show these changes (15), but we could not evaluate these findings due to poor reproducibility of these findings on MRI.
MRI compared with CT and radiography has more sensitive in detecting sacroiliitis in patients with ankylosing spondylitis, especially when it comes to the evaluation of disease. Lesions with higher water contents can be differentiated from those with lower water contents (due to fibrotic tissue or sclerosis) by the use of MRI. In literature, it is reported that CE T1 weighted sequences are more sensitive than FS T2 WI and STIR sequences in evaluating acute inflammatory lesions of SIJs.
Bredella et al. (6) stated that contrast must be used for the evaluation of sacroiliitis, because more lesions were seen on FS CE T1 WI compared with STIR and FS T2 WI. Algin et al. (16) reported that contrast-enhanced MRI with subtraction technique may be more useful than classical CE MRI for early detection of active sacroiliitis. In this study, we observed perfect agreement between observers in evaluation of osteitis on both CE FS T1 WI (in both iliac and left sacral wings) and FS T2 WI (in right sacral wing) sequences.
Althoff et al. (17) reported that a CE MR sequence is beneficial to ensure maximum diagnostic confidence when examining patients with early sacroiliitis, but STIR sequences alone are sufficient for establishing a reliable diagnosis and quantifying the amount of inflammation in active sacroiliitis. With agreement levels of around 95% for the presence of inflammation overall and on both FS T2 and CE FS T1 WI, it seems sufficiently high to justify a conclusion of active inflammation made by one observer in clinical practice on FS T2 and CE FS T1 WI.
Boy et al. (18) reported that FS T2-weighted MR imaging had the highest sensitivity compared with STIR, diffusion weighted MR and dynamic CE MRI (18). We found the highest agreement between measurements of observers 1 and 2 on (97.78 %) CE FS T1 WI and FS T2 WI sequences.
Hanly et al. (19) reported that subchondral bone marrow edema is the earliest manifestation of active sacroiliitis. Bigot and colleagues proposed 11 criteria referring to both synovial and fibrous parts of the SI joint that point to sacroiliitis and showed a good intra-observer and inter-observer reliability (a kappa value of 0.89 for detecting bone marrow edema) (20).
Docherty and colleagues (21) found a kappa value of 0.63 for inter-observer agreement regarding inflammation on MRI in a study of 20 patients with established or suspected sacroiliitis on radiographs, but contrast administration was not performed. We found a highest kappa value of 0.933 for CE FS T1 WI and 0.91 for FS T2 WI inter-observer agreement in demonstration of osteitis, which reveals substantial-perfect agreement.
Our study had several limitations. The first and most important limitation was its retrospective nature. Secondly, one of the two radiologists who selected patients also made the evaluations. Therefore, this radiologist made evaluations one month after selecting patients to avoid any bias. Third is the absence of pathological and clinical confirmation of disease activity.
In conclusion, CE FS T1 W is the most useful sequence in determination of osteitis-active sacroiliitis within all sequences and FS T2 W is the most useful precontrast sequence. Therefore, in patients with renal failure or allergy to contrast media, FS T2 WI can be obtained for detection of active sacroiliitis.


