1. Introduction
Inflammatory myofibroblastic tumor (IMT) is a mesenchymal neoplasm of intermediate biological potential composed of differentiated myofibroblastic spindle cells and an inflammatory cell infiltrate of plasma cells and lymphocytes. IMT commonly involves the lung and the orbit; however the involvement of the spine or paraspinal area is extremely rare. Most tumors found in the spine are metastases, while primary benign tumors are rare (1).
IMT has a propensity to mimic clinically and radiologically a malignant tumor (2, 3). There are no distinguishable characteristic findings of IMT, and various signal intensity of the mass was reported at one time point (4-14). We report a rare case of pathologic-proven spinal epidural IMT which showed not only changing signal intensity on magnetic resonance imaging (MRI), but also corresponding change on computed tomography (CT) and bone scan, without any treatment over a 2-year follow-up. Understanding the spectrum of imaging findings of IMT is useful in the differential diagnosis of an infiltrative paraspinal mass.
2. Case Presentation
A 55-year-old man was referred to our hospital with a paraspinal mass at T10 level. His initial symptoms were presented 3 weeks before with a sudden-onset of pain and swelling of the left back accompanied by a chilling sensation. His medical history was unremarkable. He had a mild sensory disturbance on the left side of T9 and T10 dermatome during the physical exam. Upon admission, his laboratory tests revealed a high white blood cell (WBC) count of 23700/uL (normal 4,000 - 10,000/uL) with elevated neutrophil count of 19742/uL (83.3%, normal 40% - 74%), a serum C-reactive protein (CRP) concentration of 226.49 mg/L (normal 0 - 5.0 mg/L), and an erythrocyte sedimentation rate (ESR) of 20 mm/hr (normal 0 - 15 mm/hr).
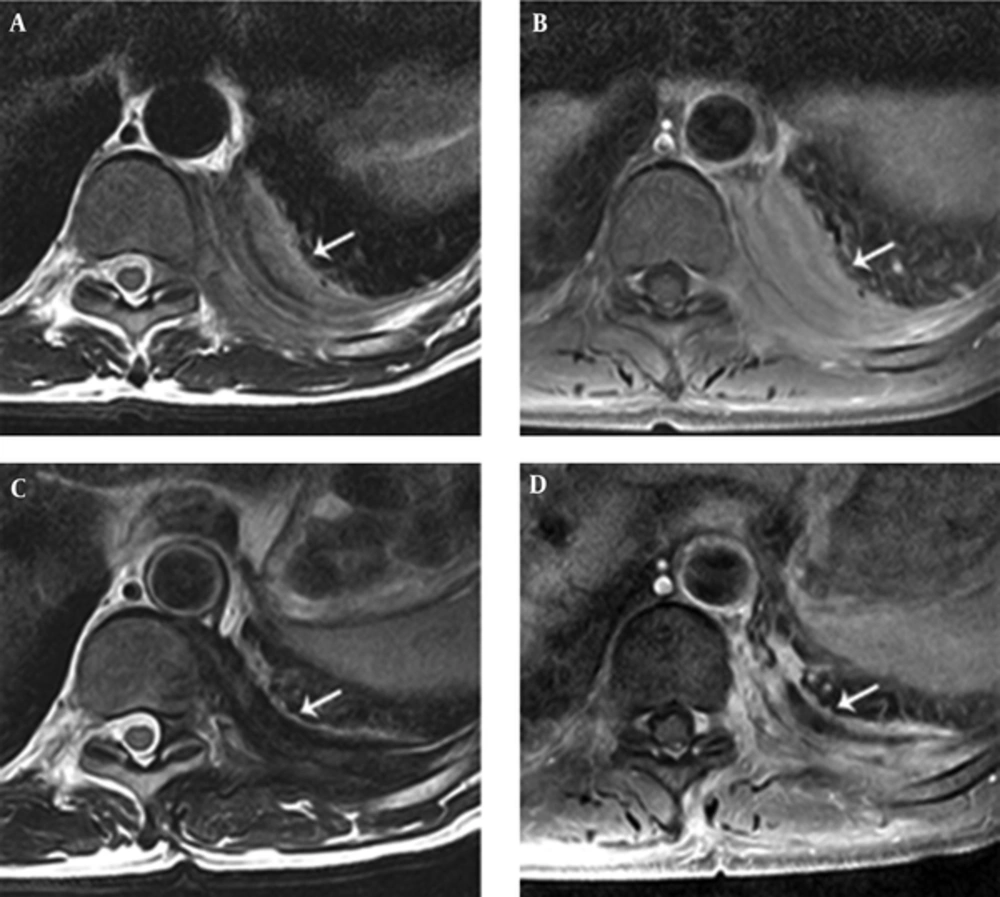
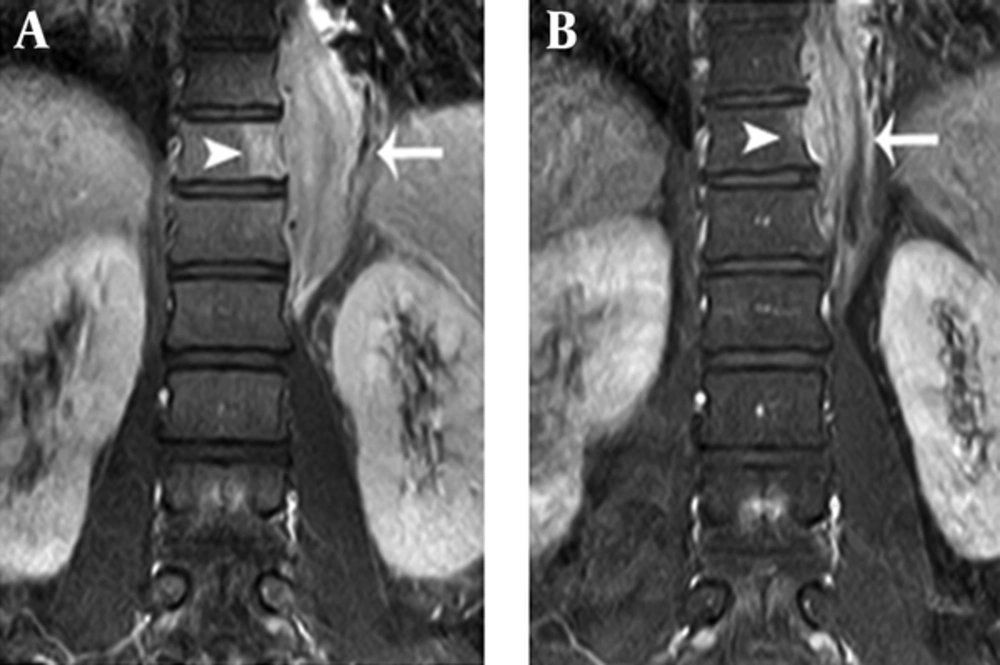
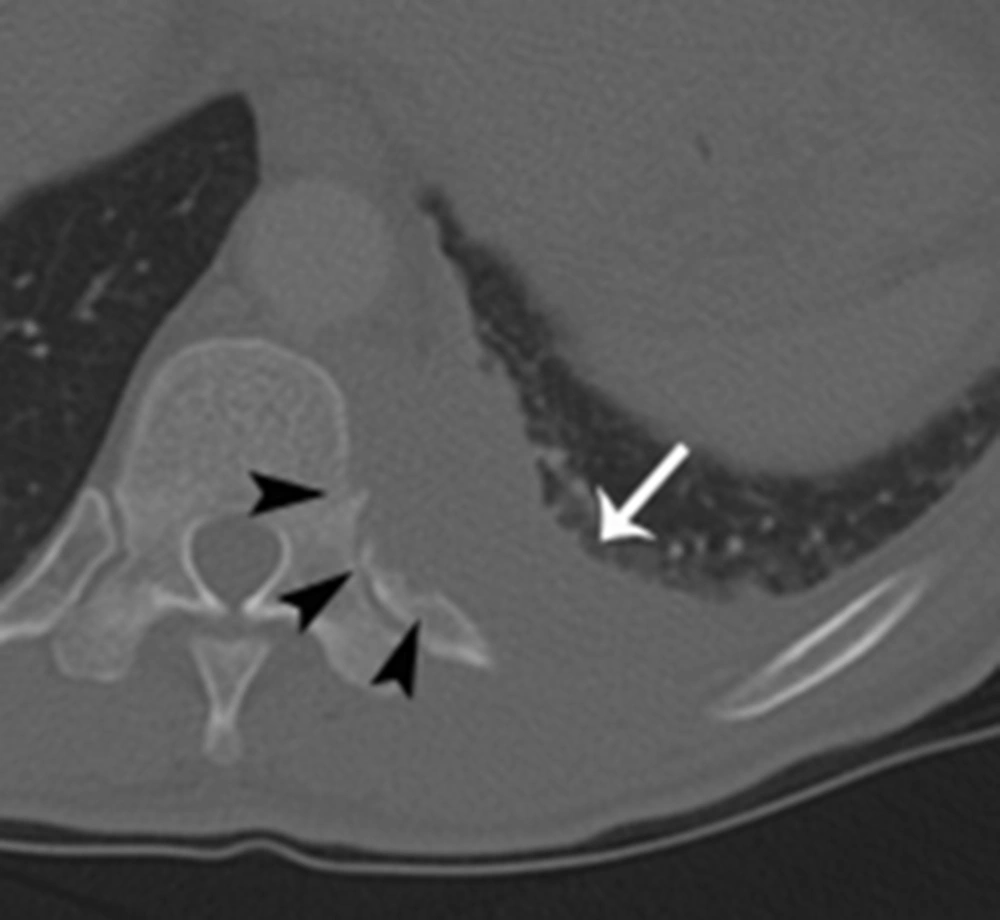
L-spine MRI revealed a left-sided paraspinal soft tissue mass from T9 to L1, showing iso to mild hyperintensity on T2-weighted image relative to the muscle with homogeneous well-enhancement on fat-saturated T1-weighted image after contrast infusion (Figure 1A and B). This mass extended into the left epidural space and neural foramen at T10 - 12 levels, causing mild compression of the dural sac. In addition, the lesion involved the adjacent left side of the vertebral body and posterior column of T11, and 9 - 12th ribs (Figure 1B and 2A). A Chest CT on the following day also demonstrated a 6 cm-sized enhancing infiltrative soft tissue mass on the left lateral aspect of T9 - L1 bodies with associated intracanal extension (not shown) and bone destruction at the left posterior arc of the 11th rib and T11 body (Figure 3). The bone scan performed a week later showed mildly increased bony uptake on the left side of the T11 - T12 vertebral bodies (Figure 4A).
A 55-year-old man presented with the sudden-onset of pain and swelling of the left back accompanied by a chilling sensation. A, Initial magnetic resonance (MR) axial scans show iso to slightly hyperintensity left-sided paraspinal soft tissue mass (arrow) at T10 level compared to adjacent muscle with associated intracanal extension with mild dural sac compression on T2-weighted image (TR = 3,300/TE = 80 ms). B, The lesion (arrow) demonstrates relatively homogeneous enhancement on axial fat-saturated post-contrast T1-weighted MR image (TR = 610/TE = 15 ms) in the initial MR axial scan. C, Two-year follow-up MR axial scans show decreased size of the paraspinal soft tissue mass (arrow) at T10 level and signal change to marked hypointensity compared to adjacent muscle on T2-weighted MR image (TR = 3,650/TE = 80 ms). D, The lesion (arrow) demonstrates subtly decreased homogeneous enhancement on axial fat-saturated post-contrast T1-weighted MR image (TR = 610/TE = 15 ms)
Comparison of coronal fat-saturated post-contrast T1-weighted MR images between initial and two-year follow-up scans. A, Coronal fat-saturated post-contrast T1-weighted MR image (TR = 510/TE = 15 ms) shows enhancement at paraspinal soft tissue mass (arrow) from T9 to L1 with adjacent bone marrow signal change at the T11 body (arrowhead). B, Two-year follow-up coronal fat-saturated post-contrast T1-weighted MR image (TR = 510/TE = 15 ms) shows decreased size of the paraspinal soft tissue mass (arrow) from T9 to L1 and decreased extent of adjacent enhancing bone marrow signal change at the T11 body (arrowhead).
A, Initial Tc-99 m hydroxymethylene diphosphonate (HDP) whole-body bone scan shows mildly increased bony uptake on the left side of T11 - T12 vertebral bodies (arrows) suggesting bony involvement. B, Two-year follow-up bone scan shows no bony uptake on the left side of T11 - T12 vertebral bodies (arrows) compared to initial bone scan.
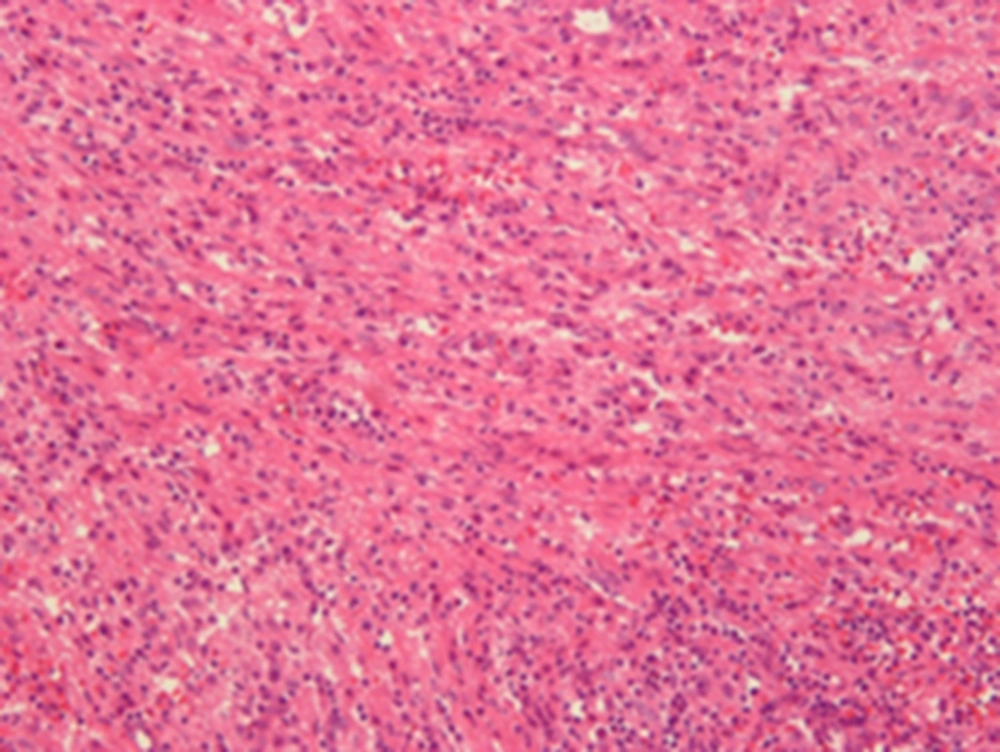
Based on the radiological findings, the initial impression was a nonspecific soft tissue malignancy, such as lymphoma or a metastatic tumor. For the diagnosis, open excisional biopsy, not resection, was done to confirm the paraspinal mass. The intraoperative finding of the lesion was suggestive of inflammation and granulation tissue in the paraspinal muscle layer. The histopathology disclosed a localized area of inflammatory cell infiltrations intermingled with interlacing bundles of spindle cells in a collagenized background, and confirmed as IMT (Figure 5).
Microscopic finding of the excision specimen of left-sided paraspinal mass shows a localized area of inflammatory cell infiltration intermingled with interlacing bundles of spindle cells in a collagenized background, confirmed as inflammatory myofibroblastic tumor (Hematoxylin-eosin (HE) × 200).
The patient’s symptoms improved after 6 months without any treatment. Follow-up chest CT and L-spine MRI were obtained on the 2-year follow-up visit. Chest CT revealed a decreased size of the mass, but intracanal extension and bony destruction of the left 11th rib and T11 body were still noted. On an MRI on the same day, in addition to the decreased size of the mass with little change of intracanal extension, the mass showed low signal intensity relative to muscle on T2-weighted image (Figure 1C). Furthermore, the extent of bone marrow signal change and enhancement of T11 and 9 - 12th ribs decreased (Figure 1D and 2B). A bone scan demonstrated decreased bony uptake on the left side of T11 - T12 vertebral body compared to the initial study (Figure 4B). The patient did not have any special treatment after the excisional biopsy. Besides the change of imaging features, the patient complained of no symptom and his laboratory tests showed improvement with a WBC count of 11,000/uL (normal 4,000 - 10,000/uL), neutrophil count of 7760 (70.3%, normal 40% - 74%), and a serum CRP concentration of 23.78 mg/L (normal 0 ~ 15 mm/hr).
3. Discussion
In this case, we observed a spinal epidural IMT initially showing iso to mildly high signal intensity relative to muscle on T2-weighted image changing to low signal intensity and regressing on the 2- year follow-up MRI, CT, and bone scan without receiving treatment. In the literature review, nine cases of spinal epidural IMTs demonstrated characteristic signal intensity at one time point of the disease course, but no case report exist regarding signal changes on follow-up MR images to date (Table 1).
| References | Year | Age , y/Sex | Clinical Symptoms | Laboratory Findings | Location | Bone Destruction | Signal Intensity on MR Images Compared to Adjacent Muscle | Treatment | Follow-Up, Month | ||
|---|---|---|---|---|---|---|---|---|---|---|---|
| T1-Weighted | T2-Weighted | Contrast-Enhanced | |||||||||
| Roberts et al. (4) | 1997 | 58/F | Back pain, gait disturbance, spastic paraparesis | Normal | T9 - T11 | + | Iso | Hypo | NA | Resection | 6 |
| Gilliard et al. (6) | 2000 | 45/M | Progressive quadriplegia, distal dysesthesia | NA | C3 - T2 | + | Iso | NA | + | Resection + IV steroid | 2 |
| Roberts et al. (12) | 2001 | 39/F | Radicular pain, numbness in limbs, gait disturbance, paraparesis | NA | T5 - T6 | - | Iso | Hypo | NA | Resection + IV steroid | 6 |
| Seol et al. (14) | 2005 | 44/M | Paraplegia, urinary incontinence, progressive back pain | Normal | T1 - T7 | - | Iso | Hyper | + | Resection | 12 |
| Sailler et al. (13) | 2006 | 78/M | Back pain, progressive ataxia, spastic paraparesis | ESR 38 mm/hr; CRP 2.7 mg/dL | C6 - T3 | NA | NA | Hypo | + | Resection + IV steroid + IV CPA | 7 |
| Sailler et al. (13) | 2006 | 73/F | Back pain, weakness in lower limbs | ESR 35 mm/hr; CRP 6.3 mg/dL | T5 - T7 | NA | NA | Hypo | + | Resection + IV CPA + IVIG | NA |
| Kato et al. (9) | 2012 | 63/M | Back pain, numbness of the lower limbs, gait disturbance | NA | T5 - T6 | - | Iso | Hypo-to-hyper | NA | Resection | 24 |
| Kim et al. (10) | 2014 | 43/M | Lower back pain, radiating pain, weakness of right lower limb, mild bladder dysfunction | Normal | L4 - S2 | - | Iso | Iso-to-hypo | + | Resection + IV steroid | NA |
| Kanagaraju et al. (8) | 2015 | 49/F | Numbness of the lower limbs, gait disturbance, sensory change at right T4 dermatome | NA | T1 - T3 | - | Hypo | Hypo | + | Excision + IV steroid | 2 |
| Present case | 2015 | 55/M | Back pain, mild sensory change at left T9-T10 dermatome | ESR 20 mm/hr; CRP 226.49 mg/L; WBC 23700/uL; (PMN 83.3%) | T9 - L1 | + | Iso-to-hyper | Hyper | + | Excision only | 24a |
Abbreviation: NA, not available; PMN, polymorphonuclear neutrophil; IV, intravenous; CPA, cyclophosphamide; IG, immunoglobulin; WBC, white blood cell; CRP, C-reactive protein; ESR, erythrocyte sedimentation rate.
aFollow-up imaging with CT, MRI, and bone-scan.
There are conflicting reports concerning signal intensity changes of IMT on T2-weighted image. A few articles have reported that IMT usually has low signal intensity on T2-weighted images with homogeneous or heterogeneous enhancement (5, 7, 8, 10, 13). Han et al. (7) suggested that T2 hypointensity of an IMT might be explained by a relative lack of both free water and mobile protons within a fibrotic lesion; whereas, there are also a few reported cases of IMT demonstrating hyperintensity on T2-weighted images (9, 14). Seol et al. (14) speculated that the signal intensity on T2-weighted images is dependent on the degree of reactive and fibrotic lesions within the IMT. In other words, it is suggested that the area showing abundant inflammatory cells in vascular stroma could be hyperintense on T2-weighted images, and fibrous and collagenous components correlate with hypointensity on T2-weighted images. Briefly, this might be explained that the amount of fibrosis and cellular infiltration diversify the imaging findings of IMT.
Histologically, IMT is characterized by a variably cellular spindle cell proliferation in a myxoid to collagenous stroma with a prominent inflammatory infiltrate composed primarily of plasma cells and lymphocytes, with occasional admixed eosinophils and neutrophils. Coffin et al. (15) described three basic histological patterns of IMT according to the composition of spindled, fibroblastic-myofibroblastic, and inflammatory cells: myxoid/vascular, compact spindle cell, and hypocellular fibrous patterns. There is considerable histologic overlap among the three types (16).
Considering this background information, it could be suggested that various histological patterns of IMT are in the spectrum of the natural history of IMT and make different signal changes on MRI according to disease evolution. Probably the gradual decrease of inflammatory cells in background vasculized and myxoid stroma with an increasing proportion of hypocellular fibrous component in the natural course of IMT revealed the high to low signal change on T2-weighted image on the follow-up MRI. Although the follow-up histopathologic result could not be provided, improvement of the patient’s symptoms and the decreased mass size on follow-up can provide supportive evidence.
Given this initial appearance of the soft tissue mass in our IMT case, it would have been difficult to distinguish IMT from a malignant soft tissue tumor. In our case, the main differential diagnosis in paraspinal IMT includes metastatic tumor, multiple myeloma, and lymphoma. These lesions share similar imaging findings, including inhomogeneous hyperintensity on T2-weighted images, low signal intensity on T1-weighted images, and can cause adjacent bone destruction with intracanal extension (17-19). These findings may not be helpful in discriminating IMT from malignancy, especially if high signal intensity is exhibited compared to the adjacent muscle on the T2-weighted image as in this case. Furthermore, bone destruction could mimic an invasive malignant tumor, and there were several case reports about IMT located in the chest, spine, skull, and nasal cavity with localized bone destruction (4, 6, 7, 11, 12, 20). Sometimes a definitive histological diagnosis may be required from either a tumor excision or biopsy. However, despite infiltrative features such as bone destruction and intracanal extension, decreased bony uptake on follow-up bone scan, decreased size of bone marrow enhancement on MRI, and relief of the symptoms helped to discriminate IMT from malignancy in our case. Although it is rare, radiologists should be aware of this entity with invasive radiologic features, and consider it as a differential diagnosis of infiltrative paraspinal soft tissue mass.
In conclusion, in this case, we observed the chronological signal change on MRI throughout the natural undisturbed course of IMT. With this finding, we may assume that the signal change within the IMT lesion might result from the transitional change of histopathologic composition as an evolution of the disease. Recognition of these imaging findings during the disease course with infiltrative feature could be helpful in accurate diagnosis of paraspinal IMT.


