


1. Background
Gliomas are the most common brain tumors (1). They are classified in four groups based on histopathological grading (grades I-IV). In a patient suspected of having cerebral glioma, noninvasive preoperative evaluation of brain tumor grade is important for treatment planning and prediction of prognosis (grades III and IV versus grades I and II; this classification and differentiation is important in selecting surgical versus non surgical treatments) (2, 3). Stereotactic biopsy has some drawbacks, such as invasiveness, potential complications such as intracerebral hemorrhage, and spatial limitation in sampling that could be misleading. Therefore, conventional magnetic resonance imaging (MRI) has been considered to be an established and useful noninvasive tool in brain tumor grading (4, 5), but conventional MRI-based tumor grading may lead to low-grade or high-grade misclassification in some cases because enhancement in conventional MRI is based on blood brain barrier disruption and not neovascularity and neoangiogenesis, which is more important in glioma grading (2). MR perfusion weighted imaging (PWI) can assess cerebral blood flow (CBF) and cerebral blood volume (CBV), which is more related to tumor vascularity (6); so, it is a useful modality for the diagnosis of various intracranial diseases including ischemia (7, 8), neoplastic lesions (9, 10), radionecrosis (11), and abscess (12). Although studies with 1.5T PW MRI have been performed to predict the pathologic grade of gliomas (10, 13-17), some studies have yielded somewhat different results (16, 18). With the integration of 3T MR into clinical practice, there has been growing interest in the practical improvement of PW MRI at 3T with respect to the established magnetic field strength of 1.5T, because image quality and spatial resolutions depend linearly on the magnetic field (2).
2. Objectives
In this study, we evaluated the efficacy of 3T MR PWI in the discrimination of high-grade gliomas (HGGs) versus low grade gliomas (LGGs) and tried to find appropriate rCBV and rCBF cut off points for this purpose by 3T MR PWI.
3. Patients and Methods
Thirty-five patients (20 male, 15 female, mean age: 44.5 ± 19 years, age range: 12 - 84 years) with primary MR imaging diagnosis of glioma who were referred to a neurosurgery clinic were enrolled consecutively in the study and their data on MRI and histopathology (as gold standard) were gathered prospectively. Pediatric or posterior fossa tumors were excluded due to the possibility of different perfusions. All patients had a radiographic diagnosis of glioma and were further examined using a 3Tesla Trio Siemens MRI unit one month before surgery. Imaging protocol was: 615 slices, FOV 22 × 22 cm2 T1W spin echo: TR 500 -TE 30 and FOV 22 × 22 cm2 T2W Turbo spin echo: TR 5000 -TE 90. Then, 15 cc gadolinium was injected at the rate of 3 cc/s and again the image was acquired with: TR: 2360 TE: 45, flip angle 90, band width 1346 echo planar imaging (EPI) 128 measurement 50. Mean transit time (MTT)-CBF-CBV was measured at enhancing and edematous region in comparison with the contralateral white matter. Then an appropriate surgical biopsy was performed from different sites of the tumor during complete excision. Standard hispathological examination that was assessed in a double-blinded manner, was considered as gold standard and performed within 2 weeks after PW MRI. Then according to world health organization (WHO) classification grade I and II were categorized as low grade, and grade III and IV were considered as high grade glioma (19). Three MTT, CBF, and CBV parameters were compared with each other in both groups (Figures 1 and 2) and analyzed individually with SPSS ver. 18 software (SPSS Inc. Released 2009. PASW Statistics for Windows, Version 18.0. Chicago: SPSS Inc.). The radiologist who assessed the MRIs was blinded regarding pathology results and clinical data. The mean of continuous variables were compared with each other by t-test if they showed normal distribution in Kolmogorov-Smirnov test; otherwise, they were compared by U Mann Whitney test. We used receiver operating characteristic (ROC) analysis for assessing the efficacy of continuous variables in differentiating HGGs versus LGGs using the area under the curve (AUC). P values lower than 0.05 were considered statistically significant. Ninety percent confidence intervals were calculated for all diagnostic indices.

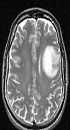
MR perfusion in low-grade glioma in a 12-year-old girl

MR perfusion in high-grade glioma in a 60-year-old man
4. Results
Among 35 patients enrolled in the study, 20 (57%) had HGG and 15 (43%) had LGG. In this study, 13 (65%) of the 20 males and seven (47%) of the 15 females had HGG. Pathologic reports are summarized in Tables 1 and 2.
| Grade | No. (%) |
|---|---|
| Grade I | 1 (2.9) |
| Grade II | 14 (40) |
| Grade III | 6 (17.1) |
| Grade IV | 14 (40) |
Distribution of Different Glioma Grades Among Patients
| Pathology | No. (%) |
|---|---|
| Astrocytoma grade I | 1 (2.9) |
| Astrocytoma grade II | 8 (23) |
| Fibrillary astrocytoma grade II | 2 (5.7) |
| Anaplastic astrocytoma grade III | 3 (9) |
| Glioblastoma Grade IIII | 14 (40) |
| Oligoastrocytoma grade II | 1 (2.9) |
| Oligodendroglioma grade II | 3 (9) |
| Oligodendroglioma grade III | 3 (9) |
Different Pathological Diagnoses Among Patients
The mean ± SD age of the patients with LGG and HGG were 33.9 ± 16.7, and 52.3 ± 16.8; respectively (P < 0.003).
The mean perfusion data were compared between LGG and HGG groups (Table 3). Relative CBF and relative CBV was significantly higher in HGG group compared to LGG (P < 0.001, and P = 0.009, respectively) and rCBF difference was more than rCBV, but it was not significant statistically. MTT was the same in both groups and there was no difference between them (P < 0.31).
| Mean ± SD | P value | ||
|---|---|---|---|
| rCBV | Low grade | 2.34 ± 1.82 | 0.009 |
| High grade | 4.1 ± 1.91 | ||
| rCBF | Low grade | 1.57 ± 0.87 | < 0.001 |
| High grade | 3.44 ± 1.81 | ||
| rMTT | Low grade | 1.68 ± 0.94 | 0.64 |
| High grade | 1.53 ± 1 |
Comparison of Perfusion Data Between High Grade and Low Grade Gliomas
We assessed the diagnostic efficacy of rCBV and rCBF in differentiating HGG from LGG by receiver operating characteristic (ROC) curve analysis and used the area under the curve (AUC) for this purpose. The AUC of rCBV and rCBF were 0.77 and 0.85, respectively (both P values < 0.01) (Table 4 and Figure 3).
| Variable | AUC | Std. Error | P value | 95% Confidence Interval | |
|---|---|---|---|---|---|
| Lower Bound | Upper Bound | ||||
| rCBV | 0.77 | 0.088 | 0.007 | 0.6 | 0.94 |
| rCBF | 0.85 | 0.064 | 0.000 | 0.728 | 0.98 |
ROC Analysis and AUC for Differentiating High Grade Glioma (HGG) Versus Low Grade Glioma (LGG)a
 curves of relative cerebral blood volume (rCBV) and relative cerebral blood flow (rCBF) for differentiating high grade glioma (HGG) from low grade glioma (LGG)")
Receiver operating characteristic (ROC) curves of relative cerebral blood volume (rCBV) and relative cerebral blood flow (rCBF) for differentiating high grade glioma (HGG) from low grade glioma (LGG)
We calculated diagnostic indices of rCBV and rCBF in selected cut off points that were chosen based on the best diagnostic indices regarding sensitivity, specificity or both. The results have been mentioned in Table 5.
| Cut-off point | TP | FN | TN | FP | Sen (95%CI) | Spec (95%CI) | PPV (95%CI) | NPV (95%CI) | PLR (95%CI) | NLR (95%CI) | Accuracy (95%CI) | |
|---|---|---|---|---|---|---|---|---|---|---|---|---|
| rCBV1 | ≥ 1.3 | 20 | 0 | 5 | 10 | 1 (0.83-1) | 0.33 (0.12-0.62) | 0.67 (0.47-0.83) | 1 (0.48-1) | 1.5 (1-2.1) | - | 0.71 (0.54-0.85) |
| rCBV2 | ≥ 2 | 18 | 2 | 10 | 5 | 0.9 (0.68-0.98) | 0.67 (0.38-0.88) | 0.78 (0.56-0.93) | 0.83 (0.52-0.98) | 2.7 (1.3-5.6) | 6.7 (1.7-26) | 0.8 (0.63-0.93) |
| rCBV3 | ≥ 3.2 | 13 | 7 | 11 | 4 | 0.65 (0.41-85) | 0.73 (0.45-0.92) | 0.76 (0.5-0.93) | 0.61 (0.63-0.83) | 2.4 (0.99-0.6) | 2.1 (1.1-4.1) | 0.69 (0.51-0.83) |
| rCBV4 | ≥ 3.4 | 12 | 8 | 12 | 3 | 0.6 (0.36-0.81) | 0.8 (0.52-0.96) | 0.8 (0.52-0.96) | 0.6 (0.36-0.81) | 3 (1-8.8) | 2 (1.1-3.6) | 0.69 (0.51-0.83) |
| rCBV5 | ≥ 6.5 | 2 | 18 | 15 | 0 | 0.1 (0.01-0.3) | 1 (0.78-1) | 1 (0.16-1) | 0.45 (0.28-0.64) | - | 1.1 (0.96-1.3) | 0.49 (0.31-0.66) |
| rCBF1 | ≥ 1.4 | 20 | 0 | 8 | 7 | 1 (0.83-1) | 0.53 (0.27-0.79) | 0.74 (0.54-0.89) | 1 (0.63-1) | 2.1 (1.2-3.7) | - | 0.8 (0.63-0.92) |
| rCBF2 | ≥ 2 | 16 | 4 | 10 | 5 | 0.8 (0.56-0.94) | 0.67 (0.38-0.88) | 0.76 (0.53-0.92) | 0.71 (0.42-0.92) | 2.4 (1.1-0.1) | 3.3 (1.3-8.6) | 0.74 (0.57-0.88) |
| rCBF3 | ≥ 2.26 | 15 | 5 | 11 | 4 | 0.75 (0.51-0.91) | 0.73 (0.45-0.92) | 0.79 (0.54-0.94) | 0.69 (0.41-0.89) | 2.8 (1.2-6.8) | 2.9 (1.3-6.6) | 0.74 (0.57-0.88) |
| rCBF4 | ≥ 3.25 | 9 | 11 | 15 | 0 | 0.45 (0.23-0.68) | 1 (0.78-1) | 1 (0.66-1) | 0.58 (0.37-0.77) | - | 1.8 (1.2-2.7) | 0.69 (0.51-0.83) |
Diagnostic Efficacy Indices of the Selected Cut-off Points of Perfusion Variables
In our study, we found rCBV ≥ 2 has 90% sensitivity and 67% specificity and rCBF ≥ 1.4 has 100% sensitivity and 74% specificity in discrimination of LGG vs. HGG.
5. Discussion
This study presents the first prospective evaluation of 3T MR PWI in untreated glioma in Iran. The aim of this study was to assess the potency of 3T MR PWI in the prediction of the grade of glioma and differentiation of the grade of LGG from HGG noninvasively in comparison with pathology grade as gold standard as well as its importance in the management and prognosis of these two pathology group classifications.
Conventional MRI accuracy in predicting the grade of glioma was reported between 55% and 83.3% (13, 20-22). In another study, for differentiation of LGG from HGG with contrast enhanced MRI differentiation, 72% sensitivity and 48% specificity was reported (23). Enhancement pattern in conventional MRI is related to disruption of blood brain barrier (24) and partially related to the grade of glioma (4) but not exactly proportionate to neovascularity and neoangiogenesis. Hyper vascularity, which is one of most important criteria in pathologic grading (3, 25) is more correlated with PWI (3, 9, 25).
In our study with 3T MRI, relative CBF, and CBV in the HGG group was significantly higher than the LGG (P < 0.001, P < 0.009, respectively) and rCBF difference was higher than rCBV, but it was not significant statistically. MTT was similar in both groups and there was no difference between them (P < 0.31), which is not helpful.
In our study, we found rCBV more than 2 has 90% sensitivity and 67% specificity with PPV equal to 78%. Besides, rCBF more than 1.4 has 100% sensitivity and 53% specificity with PPV equal to 74% in discrimination of LGG versus HGG, both of which were significantly higher than conventional MRI. Another way rCBV ≥ 6.5 has 100% specificity and sensitivity but rCBF ≥ 3.25 with same specificity (100%) has 45% sensitivity which can be more helpful. Mean age was significantly higher in HGG group (52y in HGG vs. 33y in LGG, P < 0.003). So, if we consider the combination of age and rCBF, it could be a more accurate variant in differentiation.
In many studies similar to our study, rCBF and rCBV in the HGG group was significantly higher than LGG (12), but the accuracy between them was different. In some studies, rCBV was selected and in others, rCBF was selected and reported cut off points were different (18, 26).
Weber and colleagues in their study on 79 patients, used rCBF ≥ 1.4 for discrimination of glioblastomas from grade 3 gliomas and found a sensitivity of 97% and specificity of 50%, and their sensitivity and specificity for rCBF ≥ 1.6 in discrimination of glioblastomas from grade 2 gliomas were 94% and 78% (26). Their results are similar to our study with rCBF ≥ 1.4.
Despite the above mentioned study, Arvinda et al. have used rCBV for discrimination of HGG and LGG (18). For rCBV ≥ 2.91, their sensitivity and specificity was 94% and 93%, respectively which is different from our results for rCBV ≥ 2. This may be due to a less rCBV that was used in our study in comparison with Arvina and his colleagues.
One limitation of our study was the low sample size, which was due to multiple factors including exclusion of posterior fossa and children tumors. This limitation decreased our precision in estimating 95% confidence intervals of diagnostic indices mentioned in Table 5. Of course, when interval estimation is narrower, the precision for correct estimation of the statistics is better. Unfortunately, finding more and sufficient patients is a time consuming and difficult process that forced us to suffice with this low sample size in each histopathologic grade. Another limitation can be using one radiologist and one pathologist as observer. Oligodendroglioma usually is a low grade glioma but has more CBV and can mimic high grade glioma in PW MRI. Tumor infiltration to adjacent tissues without changes in vascularity is suboptimally characterized by PW MRI.
In conclusion, perfusion weighted magnetic resonance imaging (PWI) is a promising modality for noninvasive discrimination of LGG vs HGG and it is more accurate compared with conventional MRI. So it can be helpful for neurosurgeons in decision making dealing with glioma.
