

1. Background
Virtual touch quantification (VTQ) is a point shear wave elastography (p-SWE) technique that allows quantitative assessment of tissues according to their stiffness. The p-SWE technique is essentially related to measurement of velocity of propagation of the waves transmitted to the transducer, which is affected by tissue stiffness (1, 2). p -SWE is mainly used to determine liver stiffness, which is then used for the staging of cirrhosis (3-5). To assess liver chirrosis or splenic stiffness, a convex probe is usually used (6-9). Because of shortage of superficial fat tissue in pediatric patients, a linear probe with a higher frequency could easily be used. Limited information is available in the literature on the use of higher frequency probes in pediatric age groups.
Previous studies have attempted to determine normal standard values for liver and spleen parenchyma (10-12). However, the majority of them had used only convex probes, but both convex and linear probes were compared in only two studies in the pediatric age group (13). In these studies, only liver or spleen parenchyma was compared. In our study, the liver and spleen were compared with the convex and linear probe of the parenchyma and the patient population was 50% more than the other studies.
2. Objectives
The aim of the study was (i) to determine the normal values of liver and splenic stiffness in a pediatric population, (ii) to assess if these values are comparable or not when the linear probe is used, and finally (iii) to assess the impact of potential confounding factors such as age and gender.
3. Patients and Methods
3.1. Study Population
This prospective research was done between May 2015 and February 2016. The Institutional Review Board of the hospital approved this research, and all guardians of volunteers provided informed consent.
Consideration for inclusion was the absence of any liver disease that affects or predisposes damage to the hepatic or splenic tissue. Where available, results of standard liver function tests were required to be in the normal range. Those patients with increased transaminase levels or those under treatment with hepatotoxic drugs were excluded from the study population. All patients had to have a normal conventional ultrasound examination of the liver performed immediately before the elastography measurements. Criteria were normal echogenicity, normal echotexture and normal width and form of liver veins. The body mass index (BMI) had to be between the 3rd and 97th percentile, thus excluding patients with cachexia or adiposity. BMI was calculated from height and weight according to the WHO anthropometric program (WHO Anthro, Version 3.2.2, January 2011) for children younger than 5 years or according to WHO BMI-for-age percentile reference tables for children older than 5 years. Newborns and those in the period ranging from infancy to the age of 6 months were excluded due to difficulty in obtaining measurements in this age group.
The healthy volunteer group was divided into four groups based on age: group I (age 6 months to 2 years), group II (age 2 - 5 years), group III (age 5 - 9 years), and group IV (age 9 - 14 years). None of the patients required sedation or analgesia during the procedure.
3.2. Equipment and Methods
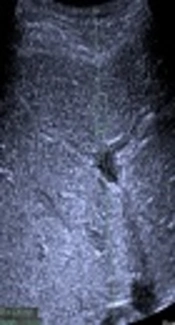
Each of the patients underwent a normal B-mode sonographic examination of the parenchymal structure for the hepatobiliary system and spleen. After the investigation and testing of the parenchymal structure for echogenicity, normal size, and tissue echotexture, the elastographic measurements were obtained. Next, a Doppler examination was held for patency of the venous and arterial vascular structures, including the portal venous system and hepatic and splenic arteries. The aim was to verify the absence of portal hypertension or venous collateral pathways and cavernous transformation. While correcting for patency of the vascular structures, p-SWE elastographic examination was conducted using a Siemens Acuson S2000 Ultrasound System (Siemens Medical Solutions, Mountain View, CA, USA). To determine the liver and spleen parenchymal stiffness, two different transducers were used: the convex 4C1 probe and the linear 9L4 probe. The ROI dimensions were placed and fixed, avoiding the vascular and biliary structures (Figure 1). This device generated shear waves by means of short push pulses (4 C1, mean push pulse: 2.67 MHz; 9 L4, mean push pulse: 4 MHz), and virtual touch tissue quantification software was used to measure SWV in several ROIs within the liver. A rectangular ROI with fixed dimensions (1 × 0.5 cm with the convex probe and 0.5 × 0.5 cm with the linear probe) was adjusted under ultrasound control to avoid identifiable blood vessels and biliary structures. All of the measurements were obtained by a pediatric radiologist fellow who had experience of elastography measurements for two years (M.B.O.).
 measurements in a healthy 10-year-old girl. SWV measurement with the 4C1 transducer in a region of interest 0.5 × 0.5 cm at a depth of 3 cm. SWV: 1.26 m/s in the right segment of the liver.")
Shear wave velocity (SMV) measurements in a healthy 10-year-old girl. SWV measurement with the 4C1 transducer in a region of interest 0.5 × 0.5 cm at a depth of 3 cm. SWV: 1.26 m/s in the right segment of the liver.
The healthy volunteers were examined in the supine condition. For the older and cooperative volunteers, the measurements were obtained during breath holding. The measurements were made during continuous speech for the younger or uncooperative children (this was a technique used for calming down intolerant children) and while infants were crying to get the least amount of abdominal movement. Minimal scanning pressure was applied by the operator. The measurements were performed at different locations in each lobe to obtain samples of different areas of each lobe. SWV means and standard deviations were calculated for each lobe and each probe in each patient. The results were expressed in meters per second (m/s). Unreliable velocity measurements caused the machine to automatically display XXXX that were not taken into consideration in shear wave velocity calculations. The number of non-valid measurements was not registered. Measurements were repeated until the necessary number of reliable values for a complete examination was obtained. At least five valid measurements were made using each probe per site. The range of depth was calculated as 1.0 - 7.5 cm for the convex probe and 1.0 - 4.1 cm for the linear probe for the parenchymal measurements for each lobe of the liver and the spleen. In children younger than 5 years old, a subcostal approach was used. In children older than 5 years old, an intercostal approach was used.
The shear wave velocities (SWVs) obtained from each hepatic lobe and splenic parenchyma by each transducer (linear 9L4 and convex 4C1) were compared for the mean, standard deviation (SD), and confidence interval (CI) for each age group and for the group as a whole. The comparison between those under the age of 2 and the other groups for each measurement site and each probe were also obtained to determine optimal probe selection at the parenchymal tissue stiffness.
3.3. Statistical Analysis
The descriptive parameters of this study used for statistical analyses include the variables of gender, age, body mass index (BMI), type of transducer, and depth of the measurement via SPSS, released 2012 (IBM SPSS Statistics for Windows, Version 21.0. Armonk, NY). The median, interquartile range, mean, and SD were calculated for each age group for the spleen and the liver, as well as the total sample. An Analysis of Variance (ANOVA) test with Bonferroni test corrections was used for the multiple comparisons between groups. For analysis of potentially influencing factors, linear mixed effects models plus multivariate regression analysis were used. P ≤ 0.05 was accepted as statistically significant for the analysis. The Bland-Altman method was used to assess the agreement between probes (14).
4. Results
The p-SWE elastography was quick and easy to perform despite the breathing and movement in the younger children, and valid measurements were obtained with each probe at each site in all cases. Therefore, the rate of invalid explorations was 0%. The time spent on the measurements for each lobe and each transducer was between 3 and 12 minutes.
For each age group, the mean, standard deviation, range of measurements, confidence interval, median, interquartile range, and spleen size obtained by each transducer are shown in Table 1. The highest mean shear velocity was measured in the spleen using a 9L4 transducer (2.21 ± 0.024 m/s), and the lowest mean shear velocity was measured in the left hepatic lobe using a 9L4 transducer (1.214 ± 0.126 m/s) (Figure 2).
| Variables | Age Group | |||
|---|---|---|---|---|
| 6 Months -2 Years | (2 - 5)Years | (5 - 9)Years | (9 - 14)Years | |
| Liver Right 4C1 | ||||
| Mean ± standard deviation | 1.18 ± 0.18 | 1.30 ± 0.15 | 1.23 ± 0.11 | 1.19 ± 0.10 |
| Range (maximum - minimum) | 1.44 - 0.85 | 1.55 - 1.05 | 1.45 - 1.04 | 1.34 - 1.00 |
| Percentile 95 | 1.40 | 1.53 | 1.39 | 1.32 |
| Median | 1.23 | 1.28 | 1.23 | 1.20 |
| Range | 0.59 | 0.50 | 0.41 | 0.34 |
| Liver Right 9L4 | ||||
| Mean ± standard deviation | 1.08 ± 0.16 | 1.31 ± 0.15 | 1.23 ± 0.15 | 1.23 ± 0.10 |
| Range (maximum - minimum) | 1.38 - 0.82 | 1.54 - 1.02 | 1.42 - 0.92 | 1.38 - 1.02 |
| Percentile 95 | 1.32 | 1.53 | 1.42 | 1.37 |
| Median | 1.11 | 1.34 | 1.26 | 1.23 |
| Range | 0.56 | 0.52 | 0.50 | 0.36 |
| Liver Left 4C1 | ||||
| Mean ± standard deviation | 1.12 ± 0.21 | 1.35 ± 0.15 | 1.48 ± 0.31 | 1.30 ± 0.16 |
| Range (maximum - minimum) | 1.49 - 0.82 | 1.66 - 1.14 | 1.99 - 0.99 | 1.55 - 1.02 |
| Percentile 95 | 1.46 | 1.62 | 1.95 | 1.53 |
| Median | 1.06 | 1.34 | 1.48 | 1.30 |
| Range | 0.67 | 0.52 | 1.00 | 0.53 |
| Liver Left 9L4 | ||||
| Mean ± standard deviation | 1.16 ± 0.10 | 1.24 ± 0.12 | 1.22 ± 0.13 | 1.23 ± 0.14 |
| Range (maximum - minimum) | 1.34 - 0.96 | 1.46 - 0.99 | 1.47 - 0.97 | 1.53 - 0.99 |
| Percentile 95 | 1.32 | 1.44 | 1.43 | 1.44 |
| Median | 1.18 | 1.26 | 1.22 | 1.23 |
| Range | 0.38 | 0.47 | 0.50 | 0.54 |
| Spleen 4C1 | ||||
| Mean ± standard deviation | 1.88 ± 0.39 | 2.03 ± 0.32 | 2.32 ± 0.25 | 2.34 ± 0.25 |
| Range (maximum - minimum) | 2.68 - 1.33 | 2.65 - 1.46 | 2.92 - 1.95 | 2.80 - 1.94 |
| Percentile 95 | 2.55 | 2.56 | 2.75 | 2.70 |
| Median | 1.80 | 2.04 | 2.25 | 2.29 |
| Range | 1.35 | 1.19 | 0.97 | 0.86 |
| Spleen 9L4 | ||||
| Mean ± standard deviation | 2.04 ± 0.22 | 2.27 ± 0.19 | 2.16 ± 0.17 | 2.39 ± 0.27 |
| Range (maximum - minimum) | 2.45 - 1.70 | 2.64 - 1.69 | 2.41 - 1.82 | 2.87 - 2.00 |
| Percentile 95 | 2.43 | 2.51 | 2.41 | 2.85 |
| Median | 2.03 | 2.29 | 2.15 | 2.35 |
| Range | 0.75 | 0.95 | 0.59 | 0.87 |
aValues are expressed as No.
 obtained from different measurement sites. The splenic parenchyma had higher mean SWV compared with the liver parenchyma including both of the lobes (LLL,left liver lobe; RLL, right liver lobe; S, spleen; 9L4, linear probe 9L4; 4C1, convex probe 4C1).")
Comparison of mean values of shear wave velocities (SWV) obtained from different measurement sites. The splenic parenchyma had higher mean SWV compared with the liver parenchyma including both of the lobes (LLL,left liver lobe; RLL, right liver lobe; S, spleen; 9L4, linear probe 9L4; 4C1, convex probe 4C1).
Regarding liver parenchyma shear wave values, the left liver lobe measurements with the 4C1 probe were significantly higher than the other lobe and probe measurements. The splenic parenchyma-obtained results with the 9L4 probe had higher SWVs compared with the 4C1 probe (P < 0.001), and the splenic parenchyma values were significantly higher than the liver parenchyma regardless of the probe used (Table 2).
| Measurement Site/Transducer | Minimum - Maximum | Mean (SD) | %95 Confidence Interval (Lower Bound-Upper Bound) |
|---|---|---|---|
| Right /4C1 | 0.85 - 1.55 | 1.22 (0.14) | 1.19 - 1.25 |
| Right/9L4 | 0.82 - 1.54 | 1.21 (0.16) | 1.18 - 1.24 |
| Left /4C1 | 0.82 - 1.99 | 1.32 (0.25) | 1.27 - 1.37 |
| Left/9L4 | 0.96 - 1.53 | 1.21 (0.12) | 1.18 - 1.23 |
| Spleen/4C1 | 1.33 - 2.92 | 2.15 (0.35) | 2.08 - 2.22 |
| Spleen/9L4 | 1.69 - 2.87 | 2.21 (0.24) | 2.16 - 2.26 |
Regarding measurements among age groups, there were statically significant differences for all measurements obtained from the liver and splenic parencyhma, except those made in the left hepatic lobe within the 9L4 transducer. The post hoc comparison revealed differences in measurements between group 1 and the other age groups at different parenchymal sites. With the 9L4 probe measured in the right lobe and the 4C1 probe measured in the left lobe of the liver, significant SWV differences were shown between group I and groups II, III, and IV for both lobes within the lowest SWVs of group I. At the splenic parenchyma measured with the 4C1 and 9L4 probes, there were significant differences between group I and group III and IV within the 4C1 probe and group II, III, and IV for the 9L4 probe SWV values. Regarding the splenic parenchyma obtained SWV, group I also had the lowest values compared with the other groups, such as the hepatic parenchyma (Table 3).
| Hepatic lobe /Transcuder | Mean | F | P value | Post-hoc comparison | P value | |||
|---|---|---|---|---|---|---|---|---|
| Group 1 | Group 2 | Group 3 | Group 4 | |||||
| Right/4C1 | 1.18 | 1.30 | 1.23 | 1.19 | 3.780 | 0.013 | G1 vs. G2 | 0.025 |
| G2 vs. G4 | 0.033 | |||||||
| Right /9L4 | 1.08 | 1.31 | 1.23 | 1.23 | 10.107 | 0.001 | G1 vs. G2 | 0.001 |
| G1 vs. G3 | 0.002 | |||||||
| G1 vs. G4 | 0.004 | |||||||
| Left/4C1 | 1.12 | 1.35 | 1.48 | 1.30 | 11.025 | 0.001 | G1 vs. G2 | 0.003 |
| G1 vs. G3 | 0.001 | |||||||
| G1 vs. G4 | 0.045 | |||||||
| G2 vs. G4 | 0.025 | |||||||
| G4 vs. G3 | 0.025 | |||||||
| Left/9L4 | 1.16 | 1.24 | 1.22 | 1.23 | 1.688 | 0.175 | NS | NS |
| Spleen /4C1 | 1.88 | 2.03 | 2.32 | 2.34 | 12.730 | 0.001 | G1 vs. G3 | 0.001 |
| G1 vs. G4 | 0.001 | |||||||
| G2 vs. G4 | 0.004 | |||||||
| G2 vs. G3 | 0.007 | |||||||
| Spleen/9L4 | 2.04 | 2.27 | 2.16 | 2.39 | 11.007 | 0.001 | G1 vs. G2 | 0.004 |
| G1 vs. G4 | 0.001 | |||||||
| G1 vs. G3 | 0.002 | |||||||
aSignificant differences are only listed between groups.
In light of these results, we combined groups II, III, and IV; in other words, we compared children younger than 2 years with the rest of the sample. With the 4C1 probe measured at the right lobe of the liver, children younger than age 2 years (group I) had lower mean SWV compared to the older children (P < 0.001). There was no such difference when using the 9L4 probe at any of the measurement sites, including both the hepatic lobes and the splenic parenchyma (Table 4).
| Measurement Site /Transducer | Groups I, (< 2 Year), N = 22 | Groups II, III and IV, (2 - 14 Years), N = 75 | Student’s t-Test | P value |
|---|---|---|---|---|
| Right/4C1 | 1.18 (0.17) | 1.23 (0.12) | 1.723 | 0.007 |
| Right/9L4 | 1.08 (0.15) | 1.25 (0.13) | 4.98 | 0.352 |
| Left/4C1 | 1.12 (0.21) | 1.38 (0.23) | 4.708 | 0.898 |
| Left/9L4 | 1.16 (0.10) | 1.22 (0.12) | 2.19 | 0.276 |
| Spleen/4C1 | 1.88 (0.39) | 2.22 (0.30) | 4.44 | 0.07 |
| Spleen/9L4 | 2.04 (0.21) | 2.26 (0.23) | 4.04 | 0.876 |
aValues are expressed as mean (SD).
Differences in SWV between the two lobes were studied in the group as a whole. The variance was similar in both lobes with the 4C1 probe (t = 0.6471, non-significant). Whereas, with the 9L4 probe, the variance was slightly higher in the left lobe (t = -4.16, P = 0.01). The agreement between linear and convex probes obtained at the measurement sites are described in the Bland-Altman plots. The mean differences obtained from linear and convex probes at the right lobe was 0.01124; at the left lobe, the difference was 0.10897; and the splenic parenchyma was -0.06309. The highest difference was calculated in the left lobe of the liver, whereas the highest variance was obtained within the convex probe (Figure 3A - C).
.")
A, The Bland-Altman plot determines the 95% confidence interval agreement limits for the 4C1 and 9L4 probes detected for the right lobe of the liver’s parenchymal SWV values. The mean difference was calculated as 0.01124 m/s. Measurements are expressed in m/s. B, The Bland-Altman plot determines the 95% confidence interval agreement limits for the 4C1 and 9L4 probes detected for the left lobe of the liver’s parenchymal SWV values. The mean difference was calculated as 0.10897 m/s. This result was the highest one obtained at the all of the three measurement sites. The measurements are expressed in m/s. C, The Bland-Altman plot determines the 95% confidence interval agreement limits for the 4C1 and 9L4 probes detected for the splenic parenchymal SWV values. The mean difference was calculated as 0.06309 m/s. The measurements are expressed in m/s (ARFI: acoustic radiation force impulse imaging, SWV: shear wave velocity).
There was no statistically significant difference obtained from SWV for each of the probes between boys and girls, including the hepatic lobes (right and left) and the splenic parenchyma (Table 5).
| Measurement Site/Transducer | Mean (SD) | t | P value | |
|---|---|---|---|---|
| Boys (N = 57) | Girls (N = 40) | |||
| Right /4C1 | 1.23 (0.02) | 1.21 (0.019) | .556 | 0.458 |
| Right/9L4 | 1.21 (0.022) | 1.22 (0.023) | .082 | 0.775 |
| Left /4C1 | 1.30 (0.033) | 1.34 (0.041) | .621 | 0.4333 |
| Left/9L4 | 1.21 (0.016) | 1.21 (0.02) | .013 | 0.909 |
| Spleen/4C1 | 2.16 (0.051) | 2.13 (0.04) | .256 | 0.614 |
| Spleen/9L4 | 2.18 (0.033) | 2.25 (0.03) | 2.009 | 0.160 |
5. Discussion
To the best of our knowledge, only a limited number of published studies define the normal p-SWE values in healthy children (3, 10, 15). Other articles do include healthy children as a control group, but the samples are small (4, 8, 9). Therefore, our goal was to determine the potential benefits and limitations of the two probes in the pediatric age group. Before investigating the pathological values, establishing the normal values in the healthy pediatric population is much more important in order to detect the different values of the velocities obtained from each transducer, which shows a parameter of tissue stiffness. Overall, we aimed to determine the normal range of the spleen and liver values in the pediatric age group using both 4C1 and 9L4 probes.
In our study, we found that the splenic rigidity was higher than that in both the right and left lobes of the liver. This could be explained by the dual circulation of the liver, with the portal venous system supplying 75% of the blood flow. In the spleen, the arterial system supplies the entire blood flow to the parenchyma. With respect to the location of the p-SWE measurements in the liver, there was a statistically significant interlobe difference in the SWV, with higher mean SWVs in the left hepatic lobe (10, 16).
When comparing the 97 children’s results for each type of probe measurement, slight differences were found only at the site of the left lobe of the liver. Regarding the measurement results of the parenchyma of the right lobe and the spleen, there were no statistically significant values based on their mean values. In addition, the variances compared within the 4C1 probe in the left lobe of the liver were significantly higher than the other site measurements in the liver. The larger field of view of the 4C1 probe than that of the 9L4 probe might have caused a higher probability of dispersion of measurements. Secondly, the higher variability could also be related to the wide range of measurements of depth obtained from the 4C1 probe compared to the 9L4 probe. This finding is supported by the Bland-Altman plots. According to the Bland-Altman plots, the probes seem to be interchangeable with good agreement between them (14). Therefore, regarding the measurement site for the liver, the right lobe could be a better choice than the left lobe. The measurements within the different age groups did not reach statistically significant values in the right lobe of the liver when using the 4C1 probe. However, some statistically significant differences were observed between the measurements in the different age groups with the 9L4 probe in the right lobe of the liver. Regarding whole age group measurements, the 4C1 transducer could be more reliable for the measurement.
Because most of the published results are based on the SWV measurements of the right hepatic lobe, to facilitate the comparisons with the literature, we considered the measurements performed in the right hepatic lobe within the literature (4, 6, 7). Our results from the 4C1 probe were similar to those of Fontaniella et al., slightly higher than those of Eiler et al. (mean 1.16 m/s, SD: 0.14) for healthy children and adolescents, and slightly higher than those of Sporea et al. (10, 15, 17). The slightly higher mean SWV in our study could be related to the fact that in 5-year-old children, the measurements were obtained using a subcostal approach, and some studies report that the velocities obtained in subcostal scans tend to be higher than those obtained in intercostal scans.
When we compared group I (children under the age 2) with the other groups, the children over the age of 2 years (groups II-IV) showed differences within all of the measured parts of the liver and the spleen, with the exception of the right lobe of the liver. With the 4C1 probe measured at the right lobe of the liver, children younger than the age 2 years (group I) had lower mean SWV compared to the older children (P < 0.001). There was no such difference when using the 9L4 probe at any of the measurement sites, including both hepatic lobes and the splenic parenchyma. Therefore, we could recommend that using linear probe could be a better choice under the age of two.
Regarding the SWV of 2.15 m/s (SD: 0.35) from our total sample of 97 children obtained from the splenic parenchyma, our values were lower when compared with the results measured in children by Lee et al. (12). In a study conducted by Lee et al., different probes were used, depending on the age of the participant (the 9L4 probe was used for children younger than 5 years, and the 4C1 probe was used for children older than 5 years). Therefore, this comparison was difficult to make due to its nonhomogeneous results. Whether the type of the probe influenced the results or not is unknown in the study performed by Lee et al. (12). In another study that examined the validity of the two probes, similar results were found, but their cohort study group consisted of 60 healthy volunteers, while our group consisted of 97 volunteers. In addition, the splenic value of 2.17 m/s measured by the 4C1 probe was higher than the hepatic p-SWE values in the same group of 60 healthy children (3).
With regard to the gender effects on the SWV measurements, we did not find a statistically significant difference. We used a multivariate logistic regression analysis rather than the other studies in the literature. In other studies, the ANOVA results were used which could not be the suitable statistical test (13, 15). Elier et al. found a significant effect of gender on the p-SWE value with lower values in females (10). This finding should be evaluated with larger cohort groups.
The main limitation of this study was about the measurement of depth. In this study, the measurements were performed deeper than 1 cm under the probe surface but not at a target depth, and the effect on the measurements was not analyzed. This is a subject for further study in children because an increase in the SWV with proximity to the liver capsule has been reported in adults. However, this is accepted as a general limitation of the pediatric p-SWE studies, as mentioned in previous research (3).
In conclusion, Point shear wave elastography (p-SWE) imaging is a noninvasive technique that is feasible to perform in children with both 4C1 and 9L4 probes. Mean values of 2.15 m/s (SD: 0.35, 95% CI: 2.08 - 2.22) and 2.21 m/s (SD: 0.24, 95% CI: 2.16 - 2.26) were found in the measurements done in healthy children with the 4C1 and 9L4 probes, respectively, guiding us to establish normal values for children with ages ranging from 6 months to 14 years. With regard to the p-SWE measurements in the pediatric age group, there could be an acceptable range of differences between those children under age 2 years and those who are older. For children under the age of 2 years, a linear probe could be a better choice for assessing liver and splenic parenchymal tissue stiffness.
