1. Background
Myocardial bridging (MB) is a congenital anomaly in which a segment of a major epicardial coronary artery courses through the myocardium, and is covered by myocardial muscle fibers (1). MB can cause clinical symptoms such as myocardial ischemia/infarction, arrhythmia, or even sudden death, despite the belief that MB is a normal variant with no clinical manifestation in the majority of the patients (2). The most frequently involved part is the middle segment of the left anterior descending coronary artery (LAD) (3).
The effectiveness of coronary computed tomographic angiography (CCTA) in the detection of MB and its morphological features has been shown in several prior studies (2, 4-9). However, the clinical importance of the MB segment cannot be justified merely by the systolic compression of the involved segment, the role of the depth and length of the MB segment on the clinical presentation cannot be ignored (2). The correlation between the MB length and depth and luminal narrowing of the tunneled segment has been previously investigated (4, 6-10). In all of these studies, the correlation was investigated by CCTA; however, in those cases of the concomitant use of invasive coronary angiography (ICA), the overall accuracy of both methods were compared with each other.
2. Objectives
The present study was aimed to determine the correlation between the depth and length of the MB as determined using CCTA, and the degree of the luminal narrowing of the involved tunneled segment as measured using the ICA.
3. Patients and Methods
This was a descriptive study conducted in a referral medical imaging center over a 4-year time period from January of 2008 through December of 2011.
3.1. Patients
Included in this study were 109 consecutive patients (61 males and 48 females) referred to the computed tomography (CT) department of the medical imaging center. They had myocardial bridging in the mid-LAD coronary artery, as confirmed by CCTA, and had already undergone ICA as well, regardless of their clinical symptoms. Both the CCTA and ICA were performed as part of the patient’s routine evaluation, clinically indicated by the referring cardiologist, with no extra costs or risks brought upon the patients.
Prior to the CCTA, each patient’s heart rate (HR) was measured, and those with HRs of more than 70 beats/min received an oral dose of 100 - 150 mg of metoprolol approximately 45 to 60 minutes before scanning. Moreover, all of the patients received glyceryl trinitrate (nitroglycerin) pearls (0.8 mg sublingually) just before the scan in order to dilate the coronary arteries. An intravenous beta blocker was not used because of its regional lack of availability.
3.2. Coronary Computed Tomographic Angiography
A 64-slice multislice CT (MSCT) scanner (SOMATOM Sensation 64, Siemens Medical Solutions, Forchheim, Germany) with synchronous electrocardiographic tracing was used for the CCTA. An approximately 80 to 100 ml bolus of contrast medium (either Visipaque 320 mgI/mL, Amersham Health, Cork, Ireland or Ultravist 370 mgI/mL, Bayer Schering, Germany), based on the patient’s body weight, was injected through an 18-G intravenous line into the antecubital vein at a rate of 5 mL/s, followed by a 50 ml bolus of saline solution chaser through a dual-head injector. Before the contrast administration, the transit time of the contrast medium for each patient was determined using a test bolus technique by injecting 10 to 15 mL of the same contrast agent, followed by 40 mL of a saline solution chaser.
The parameters used for the CCTA were as follows: collimation width 64 × 0.6 mm, tube potential 120 kV, tube effective current 650 to 850 mA, tube rotation time 330 ms, table feed 3.8 mm/rotation, temporal resolution 83 to 165 ms, scanning time 8 to 13 seconds in an inspiratory breath hold, and scan field from the tracheal carina to the diaphragm. The source image data sets were loaded to reconstruct the axial, coronal, sagittal, and oblique multiplanar views, the thin-slab maximum intensity projection, or the curved reconstructions and volume-rendered images on an online workstation (Wizard, Siemens Medical Solutions, Erlangen, Germany). The selected thickness of the multiplanar reconstructed views was 0.6 mm with 0.4 mm intervals, and the maximum intensity projection image thickness was either 5 or 6 mm.
3.3. Image Analysis
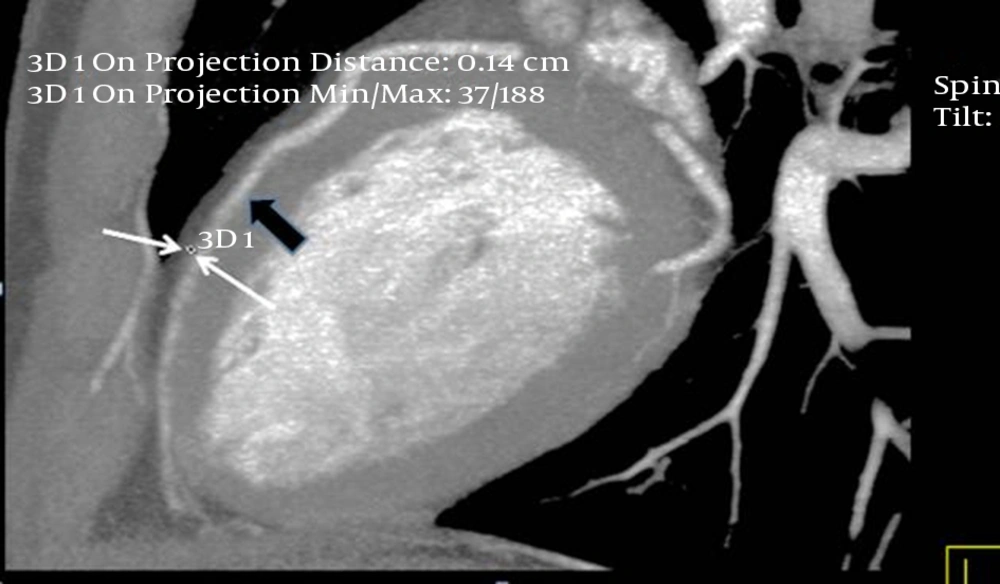
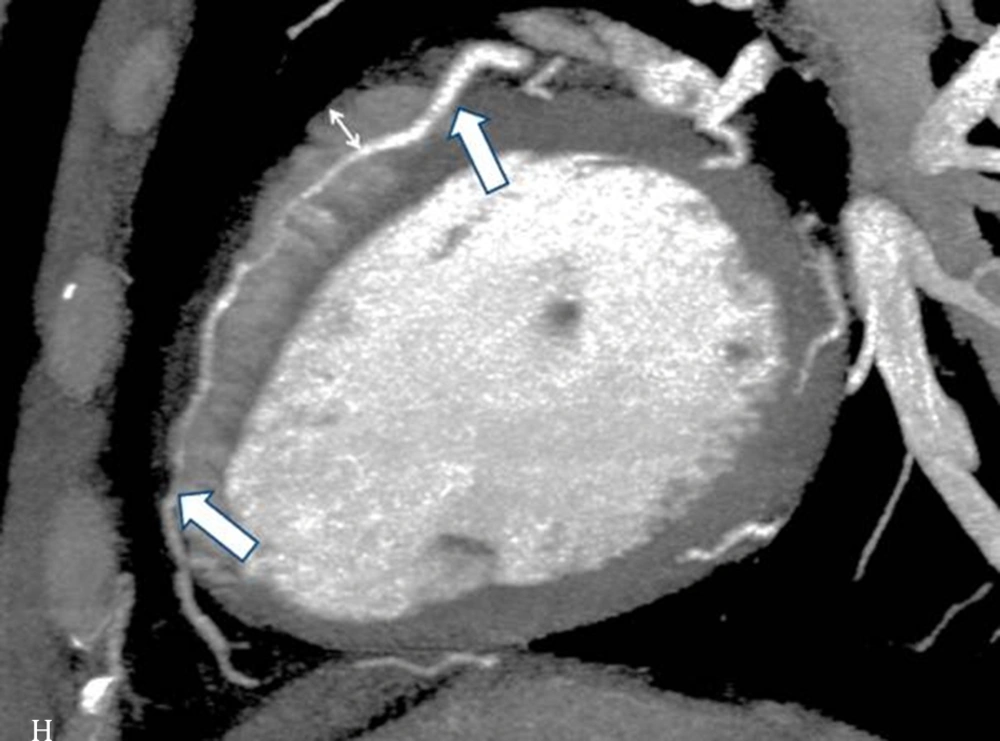
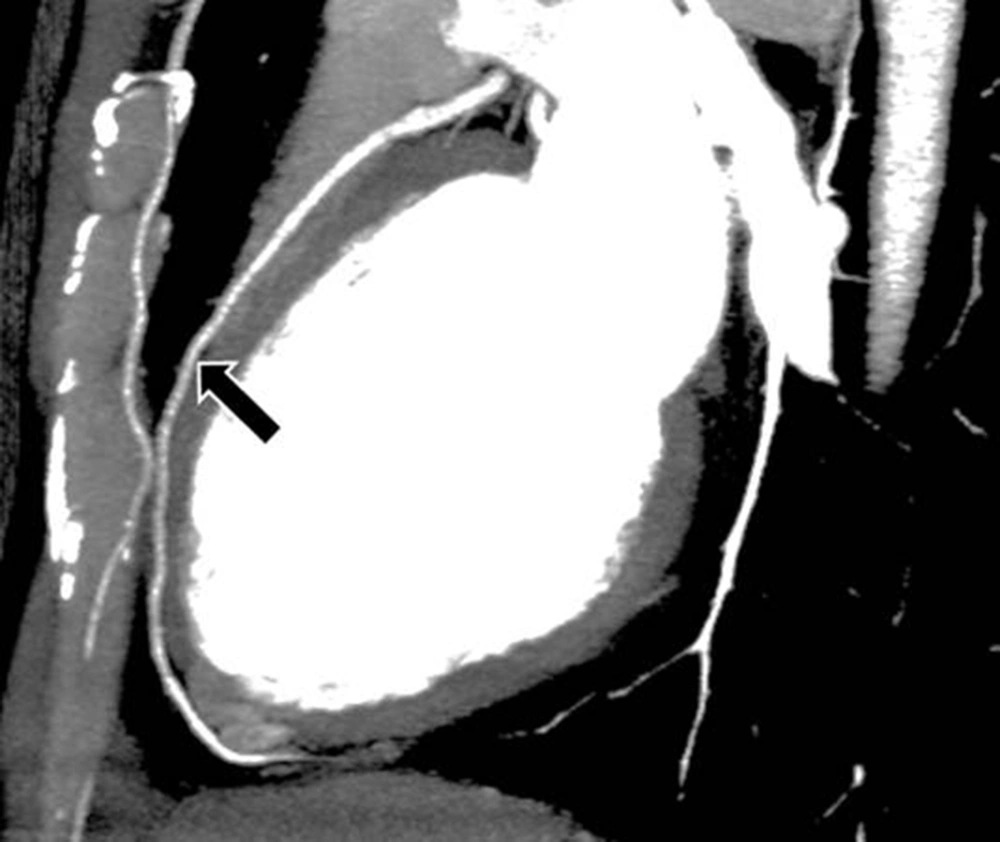
The interpretations of the CCTA images of each patient were made by a radiologist experienced in cardiovascular imaging. The myocardial bridge in middle segment of the LAD coronary artery was diagnosed based on the finding of the coronary vessel coursing in the myocardium, or getting closer to the ventricular septum, while its length and depth were measured in a curved planar sagittal plane via electronic caliper (Figure 1, 2, and 3). The depth of the MB was considered to be the most distant point between the tunneled segment and the overlying superficial myocardium. The length was determined by the distance between the entrance and exit of the tunneled segment of the mid-LAD coronary artery in the myocardium.
Thin-slab maximum intensity projection view of the left anterior descending (LAD) artery shown on computed tomography angiography, revealing long myocardial bridging of the proximal and mid-LAD artery (between the two thick arrows). The deepest portion of the bridging is located in the proximal segment of the LAD artery (small arrow).
The LAD coronary myocardial bridge was divided into two general groups: superficial (≤ 2 mm) and deep (> 2 mm), based on their measured depths. Among the patients diagnosed with myocardial bridging, those who had recently undergone ICA were included in the study, and the results of the ICAs were reviewed. All of the ICAs were conducted by experienced cardiologists, and the diameters of the coronary vessel in systole and diastole were measured in the mid-LAD, while the difference between the diameters in systole and diastole was determined. The diagnosis of MB using ICA could be based on the milking effect, the decrease in the luminal diameter in systole compared to diastole, and the step-down and step-up phenomenon, which is the local shifting movement of the vessel toward the ventricle.
3.4. Statistical Analysis
The quantitative variables were expressed as the mean ± standard deviation (SD) and the discrete variables were presented as frequencies and percentages. All of the analyses were conducted using SPSS (version 11.5, SPSS Inc., Chicago, Il, USA) for Windows. For all of the variables, we checked the normality of the data with the Kolmogorov-Smirnov test. The difference between the independent groups was assessed by the t-test if the variables were normally distributed, and with the Mann-Whitney U test if the data was not normally distributed. The data were not distributed normally for the depth, but the data for the length and the diameter change of the myocardial bridged segment in systole and diastole were normally distributed.
For the assessment of the correlation coefficient between the ordinal variables, we used Spearman’s correlation coefficient. Moreover, if the data was normally distributed, we used Pearson’s correlation coefficient. Mean comparison of normally distributed continuous variables between more than two groups was done by one way analysis of variance (ANOVA), while post-hoc pairwise comparisons between the groups were done using Tukey’s test. If the variable distribution was not normal, we used the Kruskal Wallis test for the comparison between more than two groups.
The Spearman correlation was used for the analysis of the relationship between the depth and diameter change of the mid-LAD tunneled segment between systole and diastole, and the Pearson correlation coefficient was used for analysis of the relationship between the length and diameter change of the mid-LAD segment between systole and diastole. All of the p-values lower than 0.05 were considered to be significant.
4. Results
In total, 109 patients were enrolled in this study, 56% of whom were male. The mean age of the patients was 56.4 ± 11.3 years old (age range = 23 - 85 years old). The most common myocardial bridge depth was 2 mm (53 patients, 48.6%), while the other depths are shown in Table 1.
| Depth of MB in Millimeters | Percentage |
|---|---|
| 1 | 32.1 |
| 2 | 48.6 |
| 3 | 14.7 |
| 4 | 3.7 |
| 5 | 0.9 |
The mean length of the bridges was 13.3 ± 5.8 mm (4 - 33), the mean systolic diameter was 1.9 ± 0.33 mm (1.4 - 3), and the mean diastolic diameter was 2.1 ± 0.33 mm (1.6 - 3.2). The mean percent of the diameter change from diastole to systole was 10.7 ± 5.4% (0 - 27.6). Moreover, the Spearman correlation coefficient of the depth and length was 0.26 (P = 0.006).
The mean percent of the diameter change in the patients with a depth up to 2 mm was 10 ± 4.9%, while it was 13.8 ± 6.3% in the group with a depth of greater than 2 mm (P = 0.003). The spearman correlation coefficient of the diameter change percent with the depth was 0.17 (P = 0.079), and the Pearson correlation coefficient of the diameter change percent with the length was 0.31 (P = 0.001).
The mean percent of the diameter change increased gradually from 9.9 ± 5% to 16.8 ± 7.9% (p-value = 0.013); the mean percent of the diameter change in the patients with depths of 3 and 4 were 10.1 ± 4.9% and 12.9 ± 5.7%, respectively. The post-hoc analysis showed that the differences between latter group with the two former ones (depths of up to 2 mm) were statistically significant.
Considering the two genders in the different groups, we analyzed the data in the males and females, separately. The correlation coefficients of the depth with the percent of changes, as well as with the systolic and diastolic changes, were all lower than 0.2, except for the correlation coefficient of the depth with the length in men, which was 0.33 (P = 0.01). The mean percent change in the men increased from 8.8 ± 5.2% in a depth of 1 mm, to 3.8 ± 7.9% in the group with a depth of 3 mm or greater (P = 0.06).
This pattern was not seen in the women, since the mean percent of the change in this group was 11.1 ± 4.7% in a depth of 1 mm, 10.2 ± 5.1% in a depth of 2 mm, and 13.8 ± 3.5% in a depth of 3 mm or greater (P = 0.16).
With regard to the age distribution, we considered 3 age categories: under 50 years old (33 patients), 51 - 60 years old (39 patients), and over 60 years old (37 patients) (Table 2).
| Age Distribution in Years | Depth of MB | P Value | ||
|---|---|---|---|---|
| 1 mm | 2 mm | ≥ 3 mm | ||
| ≤ 50 | 10.4 ± 4.3 | 9.4 ± 5.7 | 12.2 ± 9.1 | 0.6 |
| 51 - 60 | 8.9 ± 5.7 | 9.1 ± 4.8 | 12.6 ± 3.1 | 0.28 |
| ≥ 61 | 10.3 ± 5.1 | 12.1 ± 3.6 | 16.1 ± 5.1 | 0.024 |
Abbreviation: MB, myocardial bridge.
aData are presented as mean ± SD.
Considering the three mentioned age categories, we calculated the correlation of the depth with the percent of change, and it revealed that in only the third age group, this correlation was statistically significant. In fact, in patients over 60 years of age, the correlation coefficient of the depth with the percent of change was 0.37 (P = 0.025), while it was < 0.15 in the other age groups. Regarding the mean percent of the changes in the three depth categories (1 mm, 2 mm, and over 2 mm), the difference in the mean percent change was statistically significant in only the third age group (over 60).
5. Discussion
The purpose of this study was to determine the correlation between the depth and the length of a myocardial bridged coronary artery, and the luminal narrowing of the involved tunneled segment. In other similar studies, the extent of the systolic compression was calculated from the CCTA data obtained using different techniques.
In the study conducted by Niu et al. (4), using a 128-slice CT scanner, the degree of systolic compression was calculated by the cross-sectional area method, in which the vascular area of the MB-MCA (myocardial bridge-mural coronary artery) in systole was subtracted from that during diastole, divided by the vascular area of the MB-MCA during diastole. Moreover, Liu et al., using a dual-source CT scanner, calculated the degree of the MB-MCA compression as: [(end diastolic diameter-end systolic diameter)/end diastolic diameter] × 100% (6). Additionally, Leschka et al. (7), using 64-slice CT scanner, calculated the systolic compression from the mean of four measurements in both the end-systolic and end-diastolic phases.
Kim et al. (9), using a dual-source CT machine, calculated the degree of luminal narrowing of the MB-MCA by subtracting the minimal diameter of the tunneled segment within 2 cm to the entry of the tunneled segment from the diameter of the mid-LAD just proximal, divided by the diameter of the mid-LAD just proximal to the entry of the tunneled segment, plus 100%. Furthermore, Ma et al. calculated the degree of systolic compression by subtracting the diameter of the MB-MCA in the end systolic phase from that of end diastolic phase using 256-slice CT angiography (10).
Although the tunneled segment in the MB with its overlying myocardium can be directly visualized in the CCTA, the measurement of the systolic compression using CT can be inaccurate due to motion artifacts and limitations in spatial resolution. By comparing the systolic compression measurements in the CCTA and ICA, Leschka and his colleagues concluded that the CCTA was at least partially reliable if stated as an average of two measurements in two perpendicular planes (7). In the study conducted by Kim et al. (8), they compared the systolic compression of the MB-MCA between the CCTA and ICA, and concluded that the rate of MB detection was significantly higher in the CCTA, while the incidence of the dynamic compression detection was higher in the ICA.
Overall, our research was different from the other similar studies in that the degree of systolic compression of the MB was measured in the ICA and compared with the depth and length of the MB illustrated in the CCTA. Our results showed that the degree of systolic compression of the mid-LAD correlated with the depth of the myocardial bridge. In other words, the systolic compression was significantly more prominent in the myocardial bridges with a depth of more than 2 mm, when compared with those with depths of 1 mm and 2 mm. However, it has been postulated that even a thin layer of muscle or fibrous-fatty tissue can lead to the systolic compression of coronary arteries (11).
The extent of the MCA compression is the major cause of hemodynamic changes, which can be explained by Poiseuille’s law (the blood flow resistance is inversely proportional to the biquadratic of the vascular radius). Myocardial ischemia correlates with the internal diameter of the MCA lumen, which is directly influenced by the extent of the MCA compression. In addition, long term compression on the MB-MCA during systole leads to endothelial vessel injuries resulting from high shear stress, while the increased pressure and vortex generation in the proximal MB segment results in atherosclerosis. Moreover, in the case of deep MB, the blood perfusion is decreased in both systole and early and mid-diastole (4).
With regard to the length of the MB, only a weak correlation was found between the degree of systolic compression of the mid-LAD and the length of the MB. These findings were in agreement with previous studies (4, 7, 9, 10). A study showing different results was conducted by Kim et al., in which no correlation was found between the depth of the MB segment and dynamic compression, and that the dynamic compression only occurred in patients with full encasement of the LAD, regardless of the overlying muscle thickness. In addition, the total length of the MB (indicated by the length of the artery in contact with the left ventricular wall), rather than its tunneled segment, correlated significantly with the systolic luminal narrowing. Moreover, in some cases, the length of systolic luminal reduction was significantly greater than the tunneled segment, implying that the dynamic compression was not limited to the tunneled segment.
The authors concluded that the entrapment of the artery within the interventricular groove was mainly responsible for the dynamic compression, and that the full encasement and a longer total length of the MB, not the length of the tunneled segment or depth, played an important role in securing the LAD within the interventricular groove (8).
Considering the gender and age distribution, the correlation between the degree of systolic compression of the mid-LAD and the depth of the myocardial bridge was significant in males and those patients over 60 years old.
The relationship between the MB and the clinical symptoms was not investigated in our study, which limits the clinical relevance of the results. Another limitation is the lack of pediatric cases of MB among our cases. Although MB is a congenital change, its occurrence in children is relatively rare, mostly found in cases associated with hypertrophic cardiomyopathy or left ventricular hypertrophy. Nevertheless, the performance of CCTAs in the pediatric age group is relatively rare, and carrying out CCTAs in young children requires sedation (12, 13).


