

1. Background
With the development of chest CT, in particular high-resolution computed tomography (HRCT), for screening high-risk populations for lung cancer, the sensitivity of sub-solid pulmonary nodule (SSN) detection is gradually increased. On HRCT scans, sub-solid pulmonary nodules manifest as pure ground glass nodule (GGN) or part-solid nodule. There is evidence that SSNs have a higher probability of becoming malignant than solid nodules. Henschke et al. (1) reported that 63% of the part-solid nodules are malignant, while kim et al. (2) reported that up to 81% of persistent SSNs are malignant. Most of persistent SSNs are pathologically diagnosed as lung adenocarcinoma (2).
According to the 7th edition of the tumor-node-metastasis (TNM) staging system for all solid tumors, the size of the tumor is one of the important factors that influence the prognosis of patients with lung adenocarcinoma, and the largest diameter of the tumor is a quantitative index reflecting the size of the tumor. According to the TNM staging system, ground glass opacity (GGO) component should be included when measuring the largest diameter of tumor of lung adenocarcinoma manifesting as SSN, but SSN-type and solid nodule-type lung adenocarcinomas have different prognoses even through the same T stage (i.e., the same largest diameter), and with the increase in GGO ratio, SSN-type lung adenocarcinoma has a better prognosis (3). On HRCT scans, GGO component pathologically represents clara cells or atypical proliferating alveolar epithelial type II cells with lepidic growth, but without interstitial infiltrates (4). Inclusion of GGO component when measuring the largest diameter of tumor will overestimate the T factor (5). Murakawa et al. (5) performed a study of patients with T1-2N0M0 and found that solid component size measured by CT influences tumor recurrence and survival rate. However, GGO component shows little influence on these two indices. Therefore, it is likely to be more significant to measure the largest diameter of solid component during the T stage of a tumor. According to the criteria for lung adenocarcinoma classification issued by international association for the study of lung cancer, American thoracic society, and European respiratory society (IASLC/ATS/ERS) in 2011, solid component should be included when measuring the size of lesions (6). The criteria for lung adenocarcinoma classification are also an important index used to select the clinical treatment method of SSNs detected by HRCT (7). However, no matter for tumor T staging or for pathological classification, the largest diameter of tumor is determined by pathological measurement, which can be achieved postoperatively, and therefore, the largest diameter of tumor is not convincible evidence for preparation of individualized treatment program and prognosis judgment. HRCT is an important method for diagnosing lung adenocarcinoma manifesting as SSN. Few studies have been reported regarding the correlation between HRCT and pathological measurements of the size of SSNs, and the discrepancy between these two measurements greatly influences tumor classification and prognosis judgment. The size of tumors of the abdomen and pelvis, such as cervical cancer (8-10) is consistent between CT and pathological measurements, but as for non-small cell lung cancer, CT tumor size is slightly larger than pathological tumor size (11, 12), which occurs possibly because of alveolar collapse during pathological measurement, different fixations of pathologic specimen, and the difficulty in discriminating the boundary between fibrous connective tissue and tumor tissue on HRCT scans. Lee et al. (13) reported that the largest diameter of GGNs measured by HRCT was significantly greater than that measured pathologically (P < 0.0001), but they did not demonstrate the influence of GGO ratio on the discrepancy between these two measurements.
2. Objectives
Therefore, the objective of this study was to compare the largest diameter of tumor of lung adenocarcinoma manifesting as SSN between HRCT and pathological measurements, investigate the correlation between these two measurements, identify the influence of GGO ratio on the discrepancy, and correlate GGO ratio with the discrepancy.
3. Patients and Methods
3.1. Case Selection
The study protocol was approved by the institutional review board. Sixty-four patients with pathologically diagnosed lung adenocarcinoma manifesting as SSNs on HRCT scans who received surgical treatment between December 2010 and December 2013 were retrospectively analyzed. The size of SSNs was 3 cm or less in the largest dimension. Patients who corresponded to one of the following criteria were excluded from this study: (1) time interval between scanning and surgery over 1 month (n = 2), (2) CT slice thickness > 2 mm (n = 4), (3) presence of large intrapulmonary air containing space on CT image of the lesion (n = 3), and 55 patients were included in the final analysis. These 55 patients, consisting of 19 males and 36 females, were aged 61 years (range, 26 - 85 years). All these patients underwent pulmonary lobectomy. The time interval between HRCT examination and surgery was 14.2 ± 12.5 days.
3.2. Imaging Examination
The included 55 patients were subjected to non-contrast enhanced CT or contrast enhanced CT scans on a 256-slice multidetector scanner (Brilliance iCT; Philips Medical Systems, Best, The Netherlands). The tube voltage was 120 kV and tube current 200 mAs. The scan range was from supraclavicular fossa to bilateral lung base and scans were initiated after a deep inspiration. High-frequency algorithm was used, with a slice thickness of 0.9 mm and interval of 0.45 mm. Image matrix was 512 × 512, field of view 350 mm, window width 1300 HU, and window level -450 HU. All data were transferred to a workstation (Extended Brilliance Workshop 4.52, Philips Healthcare Systems) for post-processing.
3.3. Post-Processing
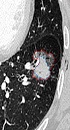
The largest diameter of tumor and the largest diameter of the solid component on the axial CT scans were manually measured by two radiologists. The largest diameter of SSNs was also measured using semi-automated analysis software equipped by the EBW 4.52 workstation. According to a previously described method (4), the GGO ratio was determined by software semi-automatedly (Figures 1 and 2). The GGO component within the SSN was taken as a region of interest. The lesion contour was delineated and then adjusted manually to keep away the vascular structure.
 in a 63-year-old woman. Segmentation of solid portion and ground-glass portion on lung window (red line: SSN contour; blue line: the contour of the inner solid portion).")
Semiautomated segmentation and volume measurement of sub-solid nodule (SSN) in a 63-year-old woman. Segmentation of solid portion and ground-glass portion on lung window (red line: SSN contour; blue line: the contour of the inner solid portion).
![Semiautomated segmentation and volume measurement of subsolid nodule (SSN) in a 63-year-old woman. Corresponding nodule segmentation on volume tissue segmentation software (purple: solid portion in SSN; pink: ground-glass portion in SSN). Thus, the ground glass opacity (GGO) ratio of this invasive adenocarcinoma was 44.75% (Volume <sub>GGO</sub>/Volume<sub>SSN</sub>: [4571.5 - 2525.7]/4571.5).](https://services.brieflands.com/cdn/serve/3144a/0dc850dbc2c41e633b0f6a593d6b58d5f411b353/iranjradiol-In_Press-In_Press-22027-i002-preview.png "Semiautomated segmentation and volume measurement of subsolid nodule (SSN) in a 63-year-old woman. Corresponding nodule segmentation on volume tissue segmentation software (purple: solid portion in SSN; pink: ground-glass portion in SSN). Thus, the ground glass opacity (GGO) ratio of this invasive adenocarcinoma was 44.75% (Volume <sub>GGO</sub>/Volume<sub>SSN</sub>: [4571.5 - 2525.7]/4571.5).")
Semiautomated segmentation and volume measurement of subsolid nodule (SSN) in a 63-year-old woman. Corresponding nodule segmentation on volume tissue segmentation software (purple: solid portion in SSN; pink: ground-glass portion in SSN). Thus, the ground glass opacity (GGO) ratio of this invasive adenocarcinoma was 44.75% (Volume GGO/VolumeSSN: [4571.5 - 2525.7]/4571.5).
3.4. Pathological Measurement
The surgically resected specimens were fixed using 10% formalin. The largest diameter of the lesion was gauged. Pathological diagnosis was made according to international multidisciplinary classification of lung adenocarcinoma issued in 2011 (6).
3.5. Statistical Analysis
The largest diameter of the lesion measured manually (Dm) and semi-automatically (Da) on HRCT images and the largest diameter of the lesion measured pathologically were compared using a paired t-test. The correlation between HRCT and pathological measurements was analyzed using Pearson’s/Spearman’s rank correlation tests. The consistency between different radiologists was tested using intraclass correlation coefficient (ICC) and Bland-Altman analysis. The correlation of GGO ratio (R) versus discrepancy between HRCT and pathological measurements, i.e., Dm-pathology diameter (Dp) or Da-Dp, was analyzed using Spearman’s rank correlation method. All statistical analyses were made using SPSS 17.0 (SPSS, Chicago, IL, USA) and MedCalc 12.1.4.0 (MedCalc Software, Mariakerke, Belgium) software. A level of P < 0.05 was considered statistically significant.
4. Results
Fifty-five SSNs consisted of five pure GGNs and 50 part solid nodules. These 55 lesions were pathologically classified as adenocarcinoma in situ (n = 4), minimally invasive adenocarcinoma (n = 5), and invasive adenocarcinoma (n = 46; including 14 cases of lepidic predominant adenocarcinoma and 32 cases of invasive adenocarcinomas with lepidic growth). The mean size of the SSNs was 2.23 ± 0.62 cm for manual measurement on HRCT, 2.39 ± 0.64 cm for semi-automatic (software) measurement on HRCT, and 1.79 ± 0.64 cm for pathological measurement (Table 1). The correlation coefficient was 0.935, 0.833, and 0.813 for manual measurement versus semi-automatic measurement, manual measurement versus pathological measurement, and semi-automatic measurement versus pathological measurement, respectively. There was favorable consistency between manual and semi-automatic measurements on HRCT images (Table 2). The size of tumor measured manually and semi-automatically on HRCT image was respectively 0.44 and 0.61 cm greater than that measured pathologically. The 95% limits of agreement displayed by Bland-Altman plots are shown in Figures 3 and 4. The correlation coefficient for GGO ratio (R) versus the discrepancy between HRCT and pathological measurements, i.e., Dm-Dp or Da-Dp, was 0.474 and 0.457, respectively (Figures 5 and 6).
| Measurement Method | Minimum, cm | Maximum, cm | Mean, cm | SD |
|---|---|---|---|---|
| Manual | 1.00 | 4.30 | 2.23 | 0.62 |
| Semi-automatic | 1.10 | 4.40 | 2.41 | 0.64 |
| Pathological | 0.50 | 3.00 | 1.79 | 0.64 |
High-Resolution Computed Tomography and Pathological Measurements of Tumor Size
| Measurement Method | Inter-Observer Difference, cm | t | ICC (95% Confidence Interval) | |
|---|---|---|---|---|
| Mean ± SD | 95% limits of agreement (%) | |||
| Manual | 0.06182 ± 0.15810 | (-10.7 , 16.1) | 2.900 | 0.9826 (0.9702 - 0.9898) |
| Semi-automatic | -0.03636 ± 0.18794 | (-17.1 , 14.3) | -1.435 | 0.9818 (0.9688 - 0.9894) |
Agreement of the Manual and Semi-Automatic Measurements Regarding the Largest Diameter of a Tumor Between Two Radiologists
 and semi-automatic (Da) measurements (r = 0.935), between manual (Dm) and pathological measurements (Dp; r = 0.833) and between semi-automatic (Da) and pathological measurements (Dp; r = 0.813) of the largest tumor diameter.")
A - C, There was a positive correlation between manual (Dm) and semi-automatic (Da) measurements (r = 0.935), between manual (Dm) and pathological measurements (Dp; r = 0.833) and between semi-automatic (Da) and pathological measurements (Dp; r = 0.813) of the largest tumor diameter.
 for A and (-%17.1 , %14.3) for B. The magnitude of the difference between manual and semi-automatic measurements regarding average tumor size does not seem to differ since there is no apparent pattern on the plot.")
A - B. Bland-Altman plots used to measure agreement with repeated measures between manual and semi-automatic measurements. The mean difference between the two measurements is shown with a solid line; the lower and upper 95% limits of agreement are the dashed lines at (-%10.7 , %16.1) for A and (-%17.1 , %14.3) for B. The magnitude of the difference between manual and semi-automatic measurements regarding average tumor size does not seem to differ since there is no apparent pattern on the plot.
 and pathological measurement (Dp) of the largest diameter of a tumor (r = 0.474).")
Correlation of ground glass opacity ratio with the discrepancy between manual measurement (Dm) and pathological measurement (Dp) of the largest diameter of a tumor (r = 0.474).
 and pathological measurement (Dp) of the largest tumor diameter (r = 0.457).")
Correlation of ground glass opacity ratio with the discrepancy between semi-automatic measurement (Da) and pathological measurement (Dp) of the largest tumor diameter (r = 0.457).
5. Discussion
Results from this study demonstrated that as for lung adenocarcinoma manifesting as SSN, the largest diameter of SSN measured on HRCT image was greater than that measured pathologically, but there was a positive correlation between HRCT and pathological measurements; secondly, the discrepancy between HRCT and pathological measurements was correlated with the ratio of GGO in the SSN. These findings to a certain degree help explain the reason why the largest diameter of a tumor measured pathologically was smaller than that measured manually or semi-automatically on HRCT scans, and further suggest that alveolar collapse is likely to be one of important factors that lead to the discrepancy between HRCT and pathological measurements.
For patients with lung cancer, the size of tumor is one of important factors influencing the prognosis. According to the latest TNM staging system, the largest tumor diameter measured pathologically is a reference for evaluating the stage of a tumor, however, in the clinic, CT measurement of the largest tumor diameter is an important method used to preoperatively evaluate the stage of a tumor, and the clinical stage and the pathological stage are not always consistent (11). This is also true for the lung adenocarcinoma manifesting as SSN.
The discrepancy of the largest diameter of SSN between HRCT and pathological measurements has specific characteristics and interpretation. It is difficult to gauge the largest diameter of SSN on HRCT image owing to the unclear boundary between SSN and the surrounding normal lung tissue and irregular SSN morphology. Isaka et al (14) demonstrated that after specimen fixation by formalin, pathological tumor size was significantly less than CT tumor size, and the discrepancy between CT and pathological measurements in GGO ratio > 50% tumors was significantly larger than in GGO ratio < 50% tumors. Therefore, they suggest that for the pathologically diagnosed lung adenocarcinoma manifesting as SSN, the resected lung specimen should be sufficiently inflated with physical saline to prevent the shrinking of the lepidic component in the tumor, because under the condition of sufficient inflation, there was a well correlation between CT tumor size and pathological tumor size. These findings were consistent with some results from the present study. This confirms that alveolar collapse is a factor leading to the discrepancy between CT tumor size and pathological tumor size and GGO ratio greatly influences the discordance (14).
Tumor clinical stage and pathological stage are not completely consistent. As for lung adenocarcinoma manifesting as SSN, GGO ratio is another important factor related to patient’s prognosis, and it is also one of important factors that influence the prognosis of lung adenocarcinoma in addition to TNM staging. Results from this study have demonstrated that as for SSN, GGO ratio to a certain degree contributes to the discrepancy between tumor clinical stage and pathological stage, i.e., higher GGO ratio indicates a smaller pathological tumor size, which to a certain degree suggests a better prognosis of lung adenocarcinoma manifesting as SSN (15, 16). It is worth noting that the correlation between manual and pathological measurements of tumor size is superior to that between semi-automatic and pathological measurements of tumor size. This occurs possibly because the lung nodule analysis software can automatically measure the largest diameter of an irregular nodule three-dimensionally, and the largest diameter of SSN measured manually is always less than that measured semi-automatically; however, pathological tumor size is often determined by randomly selecting the subjectively considered largest diameter on tissue specimens, and pathological tumor size is often less than the length of the true largest diameter of a tumor.
Vazquez et al. (15) conducted a study regarding low-dose CT screening for lung cancer and found that with the reduction in lepidic components, GGO ratio on HRCT decreases, and simultaneously the number of patients with tumors invading pleura, blood vessels, lymphatic vessels and bronchi increases proportionally. Nakata et al. (3) analyzed the imaging data of 146 T1N0M0 peripheral non-small cell lung cancers and they concluded that GGO ratio well correlated with histological classification, pathological invasiveness and prognosis, tumors with GGO ratio > 50% have a better prognosis because patients with tumors that have GGO ratio > 50% can receive limited surgical resection, for example pulmonary lobectomy or segmentectomy. Based on evidence that in patients with lung adenocarcinoma, GGO ratio and vessel invasion by the lesion on HRCT have a great predictive value, the largest diameter or volume of GGO should be considered when measuring GGO ratio, and use of analysis software for GGO volume measurement is reproducible (17, 18). Oda et al. (19) calculated the volume-doubling time of SSN and demonstrated that the largest diameter of SSN was not significantly correlated with the doubling time of tumor (r = -0.19, P = 0.19). Therefore, this suggests that to a certain degree the largest diameter of SSN is of limited value in tumor prognosis evaluation. On the contrary, there is a certain correlation between lesion density and doubling time (r = -0.57, P < 0.01), demonstrating that the ratio of solid component is of important value for evaluating tumor prognosis (19). As for part solid nodule, the largest diameter of the solid component is considered as a more reliable index used for evaluating tumor prognosis (5). Lee et al. (13) reported that the size of solid component on CT image well correlates with pathological tumor size. As for SSN, the ratio of solid component in the total lesion volume on CT image is one of the important factors influencing patient’s prognosis in addition to the TNM staging. Therefore, when evaluating SSN, the size and ratio of solid component are important supplements for simple measurement of the largest diameter of SSN and are important indices for prognosis evaluation in addition to the TNM staging. With continuing improvement in CT technology, computer-aided measurement of SSN has attracted increasing attention, and the accuracy of SSN parameter measurement is also gradually increased. Sumikawa et al. (20) analyzed the records of 49 patients with lung adenocarcinoma manifesting as SSN smaller than 2 cm in diameter. Measurement of solid component ratio using semi-automated lung nodule analysis software is reproducible, and semi-automatic measurement of solid component ratio is more reproducible than semi-automatic measurement of the largest diameter and area ratios (20).
This study has several limitations. First, it is a retrospective study, selection bias exists in patient inclusion, the proportion of pure SSN cases is very low, and the majority of included cases have invasive adenocarcinoma with lepidic growth, the largest diameter of the invasive adenocarcinomas with lepidic growth is greater than the pure GGN, and relatively speaking, the measurement bias is small in pure GGN. Second, pathological tumor size is determined by measuring the largest diameter of tumor based on a randomly selected plane, and it is difficult to ensure that pathological tumor size correspond to semi-automatically measured tumor size one by one. In addition, the size of pathologically infiltrated component was not measured because this was not performed in the routine pathological section measurement. Third, pathological measurement was performed after formalin fixation, so it is difficult to avoid the influence of formalin fixation on the shrinkage of the tissue. Fourth, the solid component on HRCT cannot completely correspond to the infiltrated component on pathological section, because alveolar collapse and fibrous connective tissue proliferation also manifest as solid component on HRCT scans, which influence SSN measurement in some diseases.
5.1. In Conclusion
Taken together, HRCT measurement of the largest diameter of SSN correlates with its pathological measurement, but HRCT tumor size is greater than pathological tumor size. GGO ratio correlates with the discrepancy between HRCT tumor size and pathological tumor size, which to a certain degree explains that alveolar collapse is one of causes of the discordance between HRCT and pathological measurements.
