1. Background
Neonatal bilirubin encephalopathy (NBE) is a relatively rare neurological syndrome caused by the deposition of unconjugated bilirubin in brain cells; the damage inflicted on the brain by bilirubin is not always reversible (1, 2). The condition has recently become more prevalent because of the relaxed standards for rapid and aggressive intervention, early hospital discharge, and increased practice of breastfeeding (2, 3). The mechanisms of NBE neurotoxicity are unclear but generally considered to be related to the deposition of unconjugated bilirubin in the central nervous system (3, 4). Some neurotoxic effects of bilirubin include the disruption of mitochondria, damage to plasma membranes, spongy change, demyelination, oxidative stress, and the mixed features of necrosis and apoptosis in the basal ganglia (5-8). Previous studies have reported the preferential deposition of bilirubin in the basal ganglia, thalamus, hippocampus, and cranial nerve nuclei (3, 6, 9). MR examination of newborns with bilirubin encephalopathy showed abnormal changes in the signal intensity in multiple regions of the brain, specifically the globus pallidus and the subthalamus (10-12). However, the conventional techniques are limited in their ability to quantify changes that occur at the microstructural level. Therefore, the accurate characterization and diagnosis of microstructural abnormalities in NBE with noninvasive neuroimaging methods remain challenging. Recently, some researchers have used MRS or diffusion tensor imaging (DTI) to reveal the potential pathogenetic mechanism of bilirubin encephalopathy (4, 13, 14). Thus far, research on the diffusional kurtosis imaging (DKI) of bilirubin encephalopathy has not been published to our knowledge.
DTI has shown to be a powerful technique in detecting tissue microstructure changes in vivo. However, DTI is based on a Gaussian distribution of water diffusion, which limits its sensitivity to the diffusional and microstructural properties of brain tissues. More recently, DKI has been described as an extension of DTI, which is based on the diffusion properties of water motion in complex media and has been developed to probe the non-Gaussian diffusion characteristics (15, 16). Compared with DTI, DKI has shown greater promise to better characterize white and gray matter alterations in the brain (17). DKI has been used in several studies on humans and animals, including pathological and normal conditions, such as age-related microstructural changes, chronic mild stress, and attention-deficit hyperactivity disorder, among others (17-20).
2. Objectives
The present study aimed to determine whether the DKI profiles of newborns with bilirubin encephalopathy can evaluate microstructural changes and illustrate related mechanisms. This study also assessed whether DKI parametrics can serve as an in vivo marker for NBE.
3. Patients and Methods
3.1. Study Objects
A total of 17 patients with NBE (10 male and 7 female, from 3 to 7 days old with a mean age of 4 days) and 21 healthy age and gender matched full-term neonates (12 male and 9 female, from 3 to 8 days old with a mean age of 4 days) who underwent DKI were enrolled in the study. The DKI was part of routine MR imaging under sedation at the affiliated hospital of Binzhou Medical University MRI center from January 2013 to March 2016.
All patients were born at term, with the gestational ages of 38 to 41 weeks. All patients were diagnosed with bilirubin encephalopathy and received care in our neonatal intensive care unit. The first- and fifth-minute Apgar scores were normal in all patients, and there was no history of asphyxia. The peak levels of serum bilirubin on admission ranged from 451.1 µmol/L to 674.8 µmol/L. The clinical findings of these patients mainly include jaundice, poor feeding, high-pitched cry, increasing hypertonia, impairment of upward gaze, and varying degrees of drowsiness. All the patients’ parents were followed up by a phone call six months later after the MR examination. All the children developed neurological sequelae, including mental retardation, deafness, choreoathetosis, and gaze paresis. All control newborns were neurologically healthy at birth. The first- and fifth-minute Apgar scores were normal, excluding hyperbilirubinemia, perinatal hypoxia-ischemia, or any other significant neurological illness. Subjects who underwent brain MR imaging for non-neurological indications (e.g., facial hemangiomas, sinonasal abnormalities, and orbital lesions) were included in this study. MR imaging examinations that were considered of low quality due to motion artifacts or a low signal-to-noise ratio were excluded. All parents of the neonates were informed of the goals and risks of MR scanning; their written consent was requested before patient enrollment.
3.2. MR Technique
All participants underwent brain MRI at a 3 Tesla MR scanner (Skyra, SIEMENS) by using a commercial 20-channel head coil. The conventional imaging protocol included axial and sagittal T1-weighted sequence (TR/TE, 500-600/9-13 ms), axial T2-weighted sequence (TR/TE, 3500/100 - 120 ms), and axial diffusion weighted imaging (TR/TE, 4300/64 ms, b = 0 and 1000 s/mm2) with a slice thickness of 4 mm, a intersection gap of 1 mm, a matrix of 256 mm × 256 mm, and a field of view of 200 mm × 220 mm.
DKI was obtained using a single-shot echo planar imaging (SS-EPI) sequence and carried out by 30 directions; echo time (TE) = 95 ms; repetition time (TR) = 5100 ms; field of view (FOV) = 180 mm × 180 mm; number of excitations (NEX) = 2; slice thickness = 3 mm without gap; b value = 0, 1000, 2000; acquisition time = 6 min 9 s.
3.3. Image Analysis
DKI data were processed by using MRIcron and Diffusional Kurtosis Estimator software. Subsequently, the diffusion and kurtosis tensors were calculated on a voxel-by-voxel basis to produce parametric maps for DKI parameters (Figure 1A -E). Using MRIcron software, voxels of interest (VOIs) were manually drawn in the bilateral globus pallidus, putamen, and thalamus (Figure 1F - H). VOI drawing was performed by two neuroradiology fellow, ten-year and six-year radiology resident respectively. To reduce interobserver variability, we appointed each of the observers to draw all of the VOIs for any given anatomic structure for all the subjects. All VOIs were later carefully checked up by a pediatric neuroradiologist to further minimize interobserver varialibity. Data were analyzed using SPSS 13.0. First, paired t-test was performed per region to identify a potential lateralization effect. Second, bilateral regions that showed a main group effect, but no lateralization effect, were analyzed as a single region. Diffusion metrics of these bilateral regions were averaged. Finally, independent sample t test was used in comparison of each parameter difference between the NBE and control newborns.
Trans-axial diffusional kurtosis imaging (DKI) parametric maps of one neonatal bilirubin encephalopathy (NBE) patient [A, fractional anisotropy (FA); B, meandiffusion (MD); C, mean kurtosis (MK); D, axial kurtosis (AK); E, radial kurtosis (RK)]. Examples of voxels of interest (VOIs) drawn on transaxial FA maps over the globus pallidus (F, red), putamen (G, blue), and thalamus (H, green).
4. Results
4.1. Signal Changes of NBE and Control Newborns
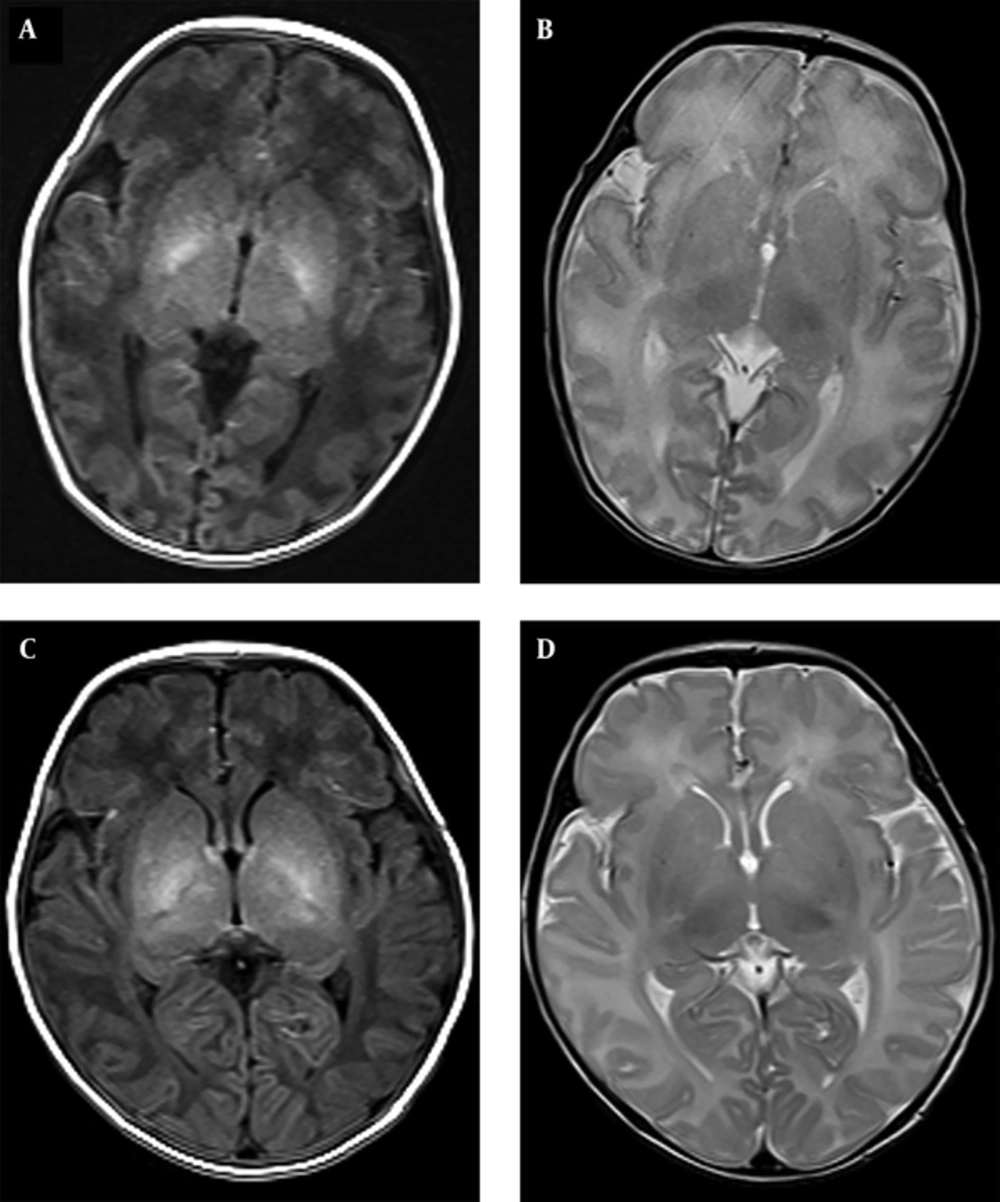
In all patients with NBE, bilateral and symmetric relatively high-intensity signals were observed in the T1-weighted images of the globus pallidus; these areas were not apparent on the T2-weighted images (Figure 2A and 2B). Moreover, slightly higher intensity signals were found on the bilateral globus pallidus in sixteen (16/21) control newborns (Figure 2C and 2D). No abnormal signals were noted in the putamen and thalamus of all subjects.
A and B are from the same neonatal bilirubin encephalopathy (NBE) patient. A, axial T1-weighted image showing high signal intensity in the bilateral globus pallidus; B, absence of abnormal signals on the T2-weighted imaging; C and D, are from the same control newborn; C, slightly high signal intensity in the bilateral globus pallidus are shown with the axial T1-weighted image; D, no abnormal signals were present on T2-weighted imaging.
4.2. Comparison of DKI Parameters in VOIs Between NBE and Control Newborns
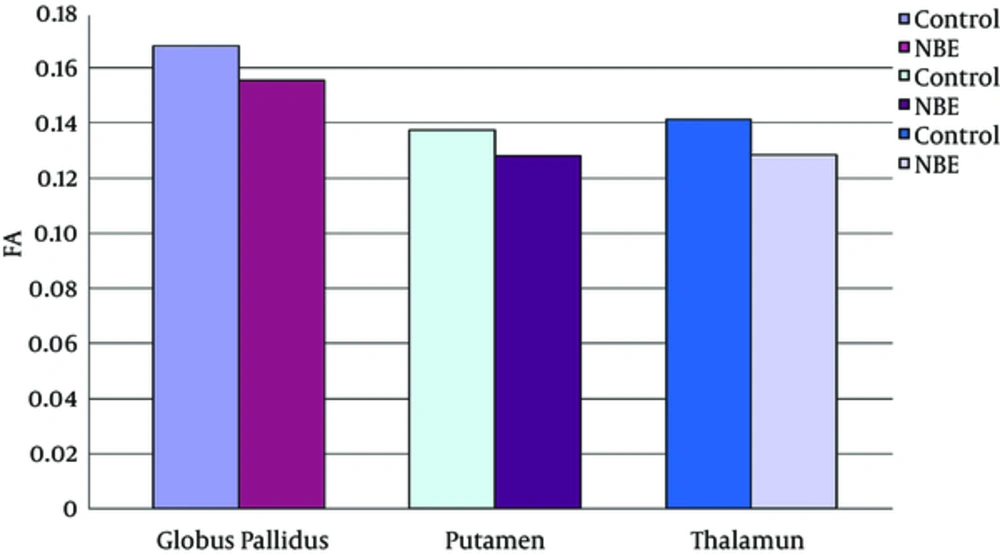
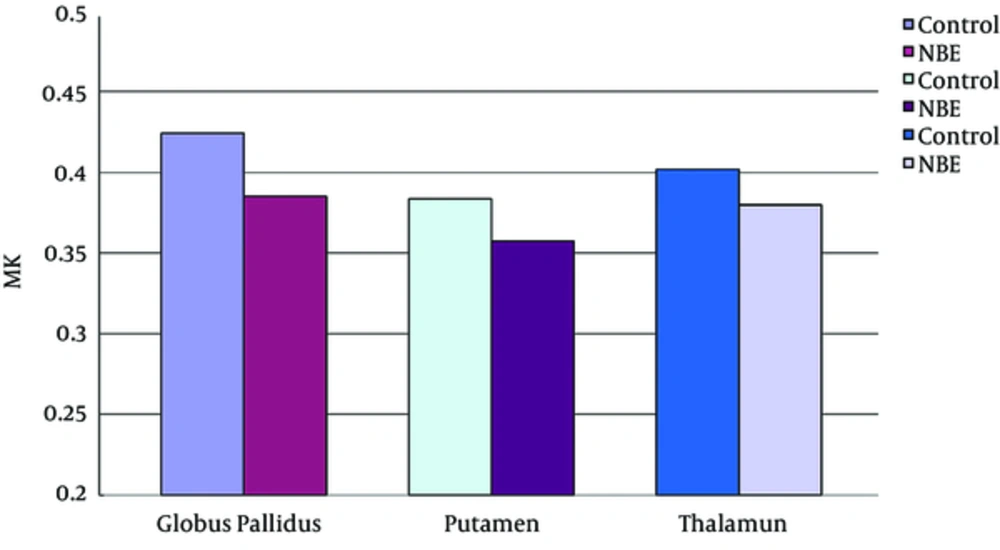
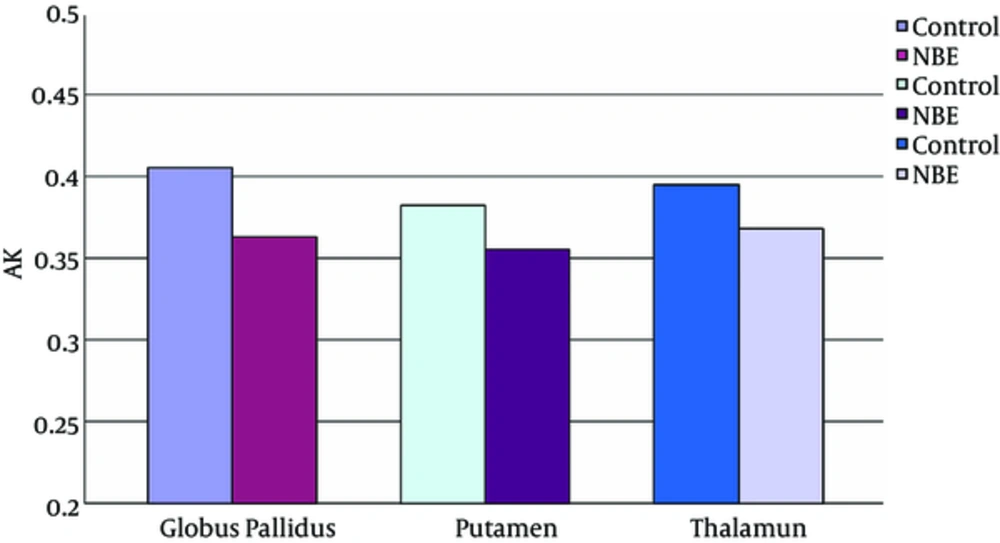
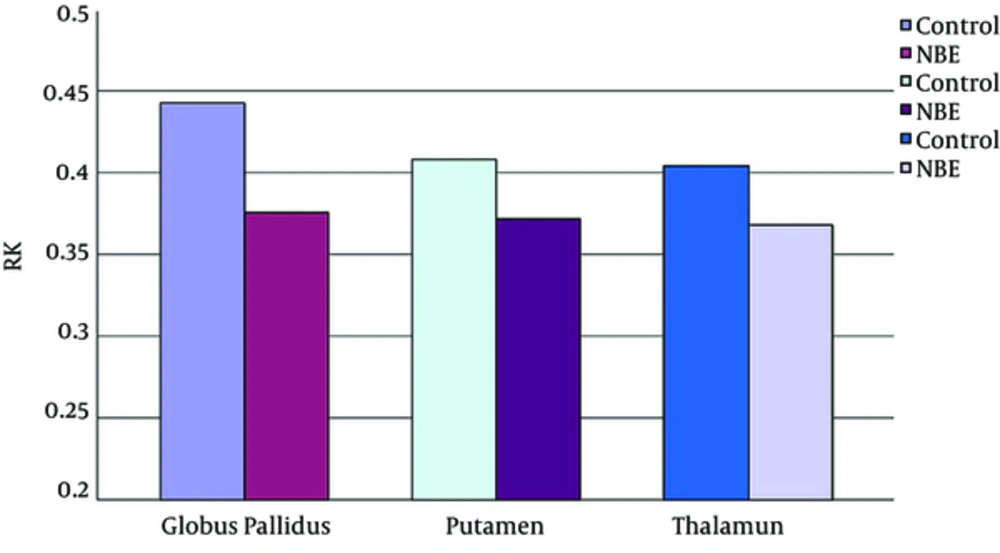
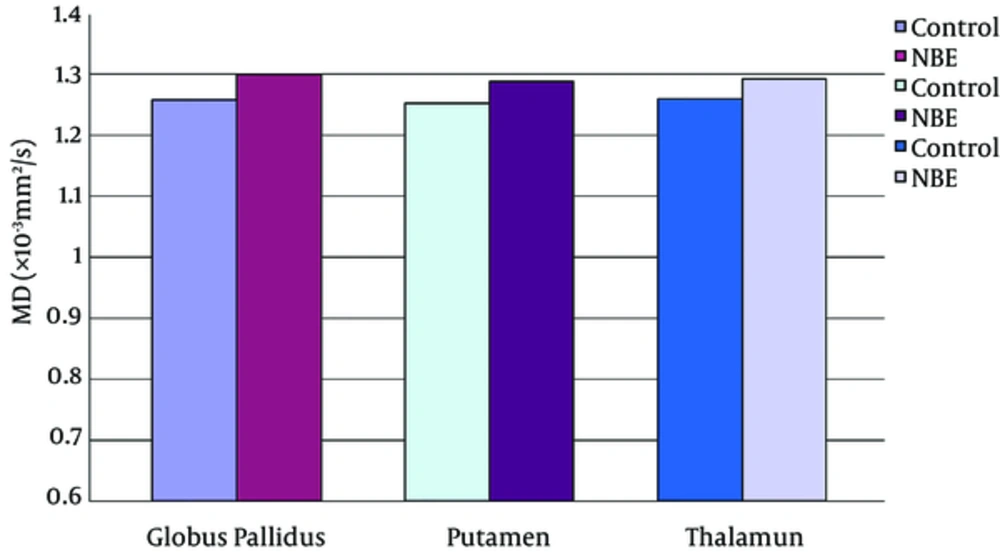
Parametric maps of the diffusion tensor [mean diffusion (MD) and fractional anisotropy (FA)] and kurtosis tensor [mean kurtosis (MK), axial kurtosis (AK), and radial kurtosis (RK)] were generated for each of the subjects (Figure 1A - E). FA, MK, AK, and RK of all VOIs were significantly decreased in the NBE group as compared with the control group, whereas MD increased in NBE (Figures 3 - 7 and Table 1). Compared with MK and AK, the change of RK was largest between NBE and normal newborns (Figure 6). Between NBE and control newborns, the MK, AK, RK, and MD more markedly varied in the globus pallidus than in the putamen and thalamus (Figures 4 - 7). However, FA more obviously changed in the thalamus than in the globus pallidus and putamen (Figure 3).
Mean fractional anisotropy (FA) in the globus pallidus, putamen, and thalamus. Independent samples t tests showed a significant decrease of FA in all voxels of interest (VOIs) in neonatal bilirubin encephalopathy (NBE) group as compared with the control group, and reduced 7.5% in the globus pallidus, 6.9% in the putamen, and 9.1% in the thalamus, respectively.
Mean mean kurtosis (MK) in the globus pallidus, putamen, and thalamus. Independent samples t tests showed a significant decrease of MK in all voxels of interest (VOIs) in NBE group as compared with the control group, and reduced 9.2% in the globus pallidus, 6.8% in the putamen, and 5.5% in the thalamus, respectively.
Mean axial kurtosis (AK) in the globus pallidus, putamen, and thalamus. Independent samples t tests showed a significant decrease of AK in all voxels of interest (VOIs) in NBE group as compared with the control group, and reduced 10.5% in the globus pallidus, 7.1% in the putamen, and 6.9% in the thalamus, respectively.
Mean radial kurtosis (RK) in the globus pallidus, putamen, and thalamus. Independent samples t-tests showed a significant decrease of the RK in all voxels of interest (VOIs) in the NBE group relative to the control group, with a reduction by 15.2% in the globus pallidus, 8.8% in the putamen, and 9.0% in the thalamus.
Mean mean diffusion (MD) in the globus pallidus, putamen, and thalamus. Independent samples t-tests showed the significant increase of MD in all voxels of interest (VOIs) in the NBE group relative to the control group, with an increase of 3.3% in the globus pallidus, 2.8% in the putamen, and 2.6% in the thalamus.
| Globus Pallidus | Putamen | Thalamus | ||
|---|---|---|---|---|
| FA | t | -2.300 | -2.117 | -3.459 |
| P Value | 0.027 | 0.041 | 0.010 | |
| MD | t | 3.669 | 2.416 | 2.791 |
| P Value | 0.001 | 0.021 | 0.008 | |
| MK | t | -3.114 | -2.140 | -2.157 |
| P Value | 0.004 | 0.039 | 0.038 | |
| AK | t | -2.761 | -2.510 | -2.255 |
| P Value | 0.009 | 0.038 | 0.030 | |
| RK | t | -3.935 | -2.484 | -2.416 |
| P Value | 0.000 | 0.018 | 0.021 |
Abbreviations: AK, axial kurtosis; FA, fractional anisotropy; MD, mean diffusion; MK, mean kurtosis; RK, radial kurtosis.
aIndependent samples t test, two-tailed significance P < 0.05.
5. Discussion
Conventional DTI assumes that water molecules diffuse uniformly in a certain direction. However, in real brain tissue with complex cellular structures, the water molecules diffuse through a highly heterogeneous environment in any direction, thereby leading to deviation from the Gaussian distribution (21). DKI was proposed as an extension of DTI to describe non-Gaussian water diffusion as a reflective marker of tissue heterogeneity. Since its first introduction by Jensen et al. (16), DKI has already shown extremely sensitive and specific in detecting microstructural alteration in the white matter and the isotropic gray matter of various encephalopathies (17-20). With a stronger b value, DKI has the potential to further explore intracellular space and membrane interactions (21). Brain microstructural alterations in NBE were investigated in the current study.
Bilirubin is largely produced from the degradation of hemoglobin; this natural antioxidant is beneficial at physiological levels. However, extremely high levels of bilirubin, especially unconjugated form exceeding the buffering capacity of the blood may move into the brain, thereby causing a unique pattern of brain injury called bilirubin encephalopathy (3, 4). Furthermore, the pathogenesis of cell damage in NBE may be related to mitochondrial disruption, which may consequently affect cellular and molecular cascades, including plasma membrane perturbations, excitotoxicity, neuroinflammation, oxidative stress, and cell cycle arrest (12, 22). Similar to previous studies (10-12), our study showed the bilateral higher signal intensity in the globus pallidus. The reason for this selective involvement patterns has not been completely understood. The position of the globus pallidus within the neuronal circuitry of the basal ganglia, its electrical activity, and its intrinsic vulnerability may be responsible for the selective involvement (23). Slightly higher bilateral signal intensity in these areas of some control newborns were demonstrated in our study, which may be associated with different development of myelin sheath. Therefore, the use of conventional MRI in the diagnosis of NBE may have some subjectivity.
Our results indicate that DKI-derived parameters, including the diffusivity and kurtosis tensors, provide additional information that is not available through conventional MRI; DKI can obtain more information to characterize the subtle changes in brain tissues. As a direct index to detect diffusion restriction, MK significantly decreased in NBE, this trend may be attributed to bilirubin accumulation in nerve cells, which may impede the proliferation of cell membranes and organelles, destroy the addition of basal dendrites, and cause loss of cellular structures (24). And this may be also the factors leading to the increase of MD in NBE. A recent study reported the increased diffusivity apparent diffusion coefficient (ADC) in the globus pallidus in NBE, but methodological concerns limited their conclusions (25).
A preliminary report focused on DTI in the Gunn rat model showed that FA decreased in hyperbilirubinemic j/j pups (12). Our VOIs results are similar to this, which show that FA decreased in the NBE as compared with the control newborns. These results are presumably related to myelin damage, disruption of neuronal plasma membranes, spongy changes, and neuronal degeneration (26). Previous studies found the preferential deposition of bilirubin in the globus pallidus in NBE (3, 5, 6); notably, the change of FA in the thalamus between NBE and control newborns is greater than that in the globus pallidus and putamen. This difference may be attributed to the special structure of the thalamus. Although a predominantly gray matter structure, the thalamus also has a sizeable fraction of linear axonal white matter tracts. Therefore, this structure has some internal anisotropy, which may be more sensitively detected by FA.
Compared with the diffusion tensor parameters (MD and FA), MK was more specific and sensitive for investigating microstructural variations in gray matter, which correspond to the largely isotropic architecture (16, 21). Our study showed that the changes of MK between NBE and control newborns were greater in the globus pallidus than in the putamen and thalamus, which may illustrate that the greatest internal environment change of globus pallidus, probably due to its location in the circuit of the basal ganglia. The internal globus pallidus contains output neurons of the basal ganglia, which project through the motor thalamus and back to the motor cortex (2).
Both the AK and RK decreased in the NBE as compared with the control group. The decrease in AK may reflect the decrease of restriction in the axial direction of the NBE, which may contribute to mixed features of cell necrosis and apoptosis. Unconjugated bilirubin has been hypothesized to cause neuronal apoptosis via the mitochondrial pathway or the extrinsic apoptotic pathway (27). RK has the greater change as compared with AK. The higher sensitivity of RK may be a result of less diffusion restrictions from the damage of myelin and axons, which is mainly in the radial direction. RK is thought to be primarily affected by cellular membranes and myelin sheaths, whereas AK is thought to be more influenced by intracellular structures (21). The observed greater change in RK would support the theory that changes in kurtosis patterns in NBE are primarily attributed to the rapid induction of oxidative damage by unconjugated bilirubin to neuronal plasma membranes, thereby changing the phospholipid and protein structures (27, 28).
5.1. Conclusions and Limitations
The sensitivity of DKI was validated in this preliminary study. DKI parametrics may comprehensively evaluate microstructural changes and may serve as an in vivo marker for NBE. However, as NBE is a relatively rare neurological syndrome, we have retrospectively analyzed the MRI data of 17 NBE patients who have developed with neurological sequelae on follow-up so far, the sample size is slightly small. More detailed brain changes of DKI parameters are to be investigated by further study with a larger population size, including the longitudinal microstructural changes in white and gray matter of the brain following bilirubin encephalopathy. The relationship between DKI parametrics and the prognosis of patients need to be investigated in future studies.
![Trans-axial diffusional kurtosis imaging (DKI) parametric maps of one neonatal bilirubin encephalopathy (NBE) patient [A, fractional anisotropy (FA); B, meandiffusion (MD); C, mean kurtosis (MK); D, axial kurtosis (AK); E, radial kurtosis (RK)]. Examples of voxels of interest (VOIs) drawn on transaxial FA maps over the globus pallidus (F, red), putamen (G, blue), and thalamus (H, green). Trans-axial diffusional kurtosis imaging (DKI) parametric maps of one neonatal bilirubin encephalopathy (NBE) patient [A, fractional anisotropy (FA); B, meandiffusion (MD); C, mean kurtosis (MK); D, axial kurtosis (AK); E, radial kurtosis (RK)]. Examples of voxels of interest (VOIs) drawn on transaxial FA maps over the globus pallidus (F, red), putamen (G, blue), and thalamus (H, green).](https://services.brieflands.com/cdn/serve/3170b/bbb65d6989f96f9b60594e5c389ac67accbaa682/iranjradiol-In_Press-In_Press-44126-i001-preview-preview.webp)
