


1. Background
Rathke’s cleft cyst (RCC) is a benign, non-neoplastic lesion originating from the remnant of Rathke’s pouch (1). Such lesions are often small and clinically silent throughout life, with an incidence of up to 22% on routine autopsies (1, 2). RCCs typically are diagnosed based on the shape, signal intensity, and enhancement characteristics of the lesions on MRI (3-6). However, to the author’s knowledge, these MRI findings are not specific and may be difficult to interpret, such as differentiating the enhancement of the cyst wall from that of the normal pituitary gland, necessitating a cyst wall biopsy to obtain a more definitive diagnosis.
2. Objectives
Since an RCC develops between the anterior and posterior lobes of the pituitary gland (1), we wonder if this characteristic of RCC can be used for RCC diagnosis. The aim of this study was to identify and predict the diagnosis of RCCs by an improved understanding of the cyst’s localization.
3. Patients and Methods
3.1. Study Population
Records of patients diagnosed with RCCs (n = 90) and cystic pituitary adenomas (CPAs) (n = 34) between March 2012 and February 2015 from the department of radiology in the first affiliated hospital of Chongqing Medical University were retrospectively evaluated. The diagnosis was verified both surgically and histologically. The histological criteria for RCC is dense eosinophilic amorphous mucin containing small strips of simple cuboidal or pseudostratified columnar, ciliated epithelial cyst wall lining. These patients were divided into RCC and CPA groups. This study was approved by the review board and ethics committee of our institution.
3.2. MRI Data Acquisition
All MRI studies were performed with an 8-channel head coil on a 1.5-tesla system (Signa Horizon Lx; General Electric Medical System, Milwaukee, WI, USA). All patients underwent presurgical imaging within 1 week of the operation. Conventional MRI included coronal T1-weighted spin-echo (SE, repetition time (TR)/echo time (TE) = 360/14 msec), T2-weighted spin-echo (SE, TR/TE = 2000/140 msec) and sagittal T1-weighted spin-echo (SE, TR/TE = 360/14 msec). The imaging parameters were: a 200 mm × 200 mm field of view, a slice thickness of 3 mm with a 0.5 mm gap, and a matrix size of 320 × 192. Contrast-enhanced T1-weighted images were obtained in each patient after intravenous injection of 0.1 mmol/kg gadolinium-DTPA (Magnevist, Schering AG, Berlin, Germany), with a velocity of 1.5 mL/s.
Two experienced radiologists (Q.L. and X.F., both with 8 years of experience) reviewed the images. All lesions were reviewed for shape, size, localization, and signal characteristics, including signal intensity on T1 and T2 weighted images (T1WI, T2WI), presence of an intracystic nodule, or fluid-fluid level.
3.3. Statistical Analysis
The χ2 test was used for numerical data, such as sex, proportion of patients with each symptom, and MRI features between RCC and CPA groups.
Interobserver agreement between the two readers was evaluated with Kappa scores (κ). Agreement was considered fair to good if κ-values were between 0.40 and 0.75 and high if values were > 0.75.
Areas under receiver-operating-characteristic (ROC) curves (AUCs of ROC curves) were used to judge the diagnostic performance for each parameter with a significant difference between the groups, and logistic regression analysis was performed, producing values from 0.5 (no correlation) to 1.0 (perfect concordance) (7, 8).
AUCs were performed using MedCalc 12.7, while the rest statistical analyses were using SPSS for Windows (version21.0; SPSS, Chicago, IL, USA). A P value of < 0.05 was considered statistically significant.
4. Results
4.1. Baseline Characteristics of the Patients
The data for age, sex, and symptoms between RCC and CPA groups are summarized in Table 1. The study included 90 patients with RCCs, 33 men and 57 women, ranging in age between 6 and 76 years (average, 40.92 ± 1.79 years) at presentation. The clinical symptoms included headache (28 patients), visual impairment (14 patients), pituitary dysfunction (26 patients) and no symptoms (22 patients, who were misdiagnosed as having other cystic lesions by MRI). The comparison patients included 12 men and 22 women, ranging in age from 18 to 70 years (average, 43.53 ± 2.72 years) at presentation. Their clinical symptoms included headache (nine patients), visual impairment (seven patients), pituitary dysfunction (17 patients), and no symptoms (one patient whose lesion was found incidentally on a screening MRI of the brain). There were no differences regarding sex and age between the groups (P = 0.887 and P = 0.487, respectively). Symptoms differed significantly, so further comparisons were made, and a significant difference was found between those with no symptoms and those presenting with space-occupying lesion causing symptoms (P = 0.032) and pituitary dysfunction (P = 0.002). Space-occupying lesion causing symptoms (42/90) was the most common presentation in the RCC group, while pituitary dysfunction (17/34) was most common in the CPA group.
| Baseline Characteristics | RCC | CPA | P Value |
|---|---|---|---|
| Sex | F/M (57/33) | F/M (22/12) | 0.887 |
| Age, y (mean ± SD) | 40.92 ± 1.79 | 43.53 ± 2.72 | 0.487 |
| Symptoms | 0.009 | ||
| None | 22 | 1 | 0.032/0.002a |
| Space-occupying symptom | 42 | 16 | |
| Pituitary dysfunction | 26 | 17 |
aP value of comparison between two symptoms.
4.2. Size and Localization of Lesions in Reference to the Sella Turcica
Most of the 90 RCCs had an intrasellar location, at least partially, with 43 lesions contained completely in the sella and having a height of less than 1.2 cm. An additional 43 lesions were larger, with a height of more than 1.2 cm (maximum: approximately 2.8 cm), extending from within the sella to the suprasellar region. There were only four lesions that were completely suprasellar in location. A round or ovoid shape was observed for 83 lesions, while the remaining seven had snowman appearances.
Of the CPA patients, 14 lesions were located completely within the sella, while 20 lesions extended from within the intrasellar region to the suprasellar region. Lesion heights ranged from 0.5 to 2.3 cm on preoperative imaging.
4.3. Localization of the RCC in Reference to the Pituitary Gland on the Coronal View
The cysts were located in the middle of the pituitary gland or laterally. Either lesion location could be found with or without shift of the pituitary stalk. There were two main types of localization of the RCC in reference to the pituitary stalk on the coronal view. The overwhelming majority (83 lesions, 92.2%) of RCCs were located without shift of the pituitary stalk, while only seven (7.8%) lesions were located with the pituitary shifted. On the other hand, CPAs were mostly located with the pituitary shifted (27 lesions, 79.4%), with only seven (20.6%) lesions located without shift of the pituitary stalk.
4.4. Localization of the RCC in Reference to the Pituitary Gland on the Sagittal View
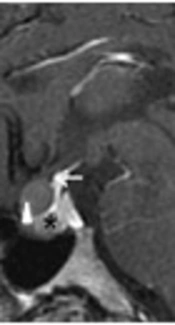
In our study, all the RCCs and corresponding pituitary stalks were easily viewed at the same level on the sagittal view. We identified three localization types for the RCC in reference to the junction of the pituitary stalk with the pituitary gland. Least frequently, the inferior margin of the RCC in 10 patients was located in front of the junction (type 1, Figure 1A and 2A). In 50 others, the superior margin of the RCC was located behind the junction (type 2, Figure 1B and 2B), while the superior margin of the RCC in 30 patients was located across the junction (type 3, Figure 1C and 2C) or encircled the pituitary stalk with a snowman appearance (type 3, Figure 1D and 2D). The last two types were more commonly seen (88.9% in total).
 or cystic pituitary adenoma (CPA) in reference to the junction of the pituitary stalk.")
Types of localization of Rathke’s cleft cyst (RCC) or cystic pituitary adenoma (CPA) in reference to the junction of the pituitary stalk.
In contrast, there were only three CPAs of type 2 or 3 in total (Figure 2F). The bulk of 16 CPAs did not overlap with their corresponding pituitary stalks on the sagittal view (Figures 1E and 2G and 2H), the rest of 15 lesions were of type 1 (Figure 2E). These two types comprised the majority of CPAs (91.2% in total).
; E - H, Cystic pituitary adenoma (CPA). Triangle: lesion, arrow: junction of the pituitary stalk, asterisk: pituitary gland.")
Localization of the lesion in reference to the junction of the pituitary stalk with the pituitary gland on sagittal, contrast-enhanced, T1-weighted images. A - D, Rathke’s cleft cyst (RCC); E - H, Cystic pituitary adenoma (CPA). Triangle: lesion, arrow: junction of the pituitary stalk, asterisk: pituitary gland.
4.5. Comparison of Conventional MRI Characteristics and Lesion Localization Between the RCC and CPA Groups
The data for conventional MRI characteristics and lesion localization between RCC and CPA groups are summarized in Table 2. While all the RCCs and their corresponding pituitary stalks appeared at the same levels on the sagittal MRI view, the bulk of some CPAs did not overlap with their corresponding pituitary stalks on the sagittal view. We therefore combined types 2 and 3, in order to compare the common localization of RCCs with those of CPAs.
| MRI Characteristics | RCC | CPA | P Value | AUC |
|---|---|---|---|---|
| T1 signala | 0.2765 | 0.570 | ||
| Hypo- | 10 | 6 | ||
| Iso | 6 | 4 | ||
| Hyper- | 53 | 7 | ||
| Mixed | 21 | 17 | ||
| T2 signala | 0.0624 | 0.605 | ||
| Hypo- | 28 | 8 | ||
| Iso | 4 | 1 | ||
| Hyper- | 31 | 7 | ||
| Mixed | 27 | 18 | ||
| Intracystic noduleb | 23 (25.6) | 2 (5.9) | 0.8161 | 0.510 |
| Fluid-fluid levelb | 1 (1.1) | 6 (17.6) | 0.0140 | 0.583 |
| Coronal localization(no stalk shift/stalk shift)b | 83/7 (92.2) | 7/27 (20.6) | < 0.0001 | 0.853 |
| Sagittal localization (Type 2 + 3/the rest)b | 80/10 (88.9) | 3/31 (8.8) | < 0.0001 | 0.889 |
aMRI signals were classified as hypo-intensity, iso-intensity, hyper-intensity and mixed intensity.
bValues are expressed as No. (%).
Abbreviations: AUC,area under the curve.
The agreement between the two readers was high (κ = 0.926). The ROC curve was performed, and the following two variables exhibited good performances in diagnosing RCCs: the coronal localization (sensitivity, 91.1%; specificity, 79.4%; AUC = 0.853, 95% confidence interval: 0.778 - 0.910, P < 0.0001), and sagittal localization (sensitivity, 88.9%; specificity, 91.2%; AUC = 0.889, 95% confidence interval: 0.821 - 0.939, P < 0.0001) (Figure 3). There were no differences between the groups about T1 and T2 signal intensity, the presence of fluid-fluid level and an intracystic nodule (P = 0.2765, 0.0624, 0.0140, and 0.8161, respectively). The AUCs of these variants are successively 0.570 (95% confidence interval: 0.478 - 0.658), 0.605 (95% confidence interval: 0.513 - 0.692), 0.583 (95% confidence interval: 0.491 - 0.671), and 0.510 (95% confidence interval: 0.419 - 0.601). Since cyst localization provided valuable clues for the differential diagnosis between RCCs and CPAs, a suggested diagnostic pathway is outlined in Figure 4.
![Graph depicts receiver operating characteristic (ROC) curves of conventional MRI characteristics and lesion localization. Localization on the sagittal and coronal views is the most effective for the differentiation between Rathke’s cleft cyst (RCC) and cystic pituitary adenoma (CPA) (area under the curve [AUC] = 0.889, 0.853 respectively).](https://services.brieflands.com/cdn/serve/3170b/7fb23f3157814c3710a08a72424a9eca6fae63fe/iranjradiol-In_Press-In_Press-57152-i002-preview-preview.webp "Graph depicts receiver operating characteristic (ROC) curves of conventional MRI characteristics and lesion localization. Localization on the sagittal and coronal views is the most effective for the differentiation between Rathke’s cleft cyst (RCC) and cystic pituitary adenoma (CPA) (area under the curve [AUC] = 0.889, 0.853 respectively).")
Graph depicts receiver operating characteristic (ROC) curves of conventional MRI characteristics and lesion localization. Localization on the sagittal and coronal views is the most effective for the differentiation between Rathke’s cleft cyst (RCC) and cystic pituitary adenoma (CPA) (area under the curve [AUC] = 0.889, 0.853 respectively).
 from cystic pituitary adenoma (CPA)")
Flowchart for decision making in the differentiation of Rathke's cleft cyst (RCC) from cystic pituitary adenoma (CPA)
5. Discussion
To better understand the features of RCCs, we compared these 90 RCCs with 34 pituitary adenomas, the most common neoplasms found in the sella turcica. All adenomas were cystic, which might lead to a misdiagnosis of RCC by MRI. There were no significant differences between the groups in sex or age, but symptoms did differ between the two types of lesions. Space-occupying lesions causing symptoms were the most common symptom in the RCC group, but were also common in the CPA group (16/34). So differentiation cannot be made by symptoms alone.
In view of the origin, we first detailed the localization of RCCs on the coronal and sagittal views, finding these to be statistically different between the groups. To the authors’ knowledge, this is the first study to use detailed localization of RCC, very easily observed, as a basis for diagnosis.
The localization of RCC correlates with the origin of pituitary gland and the Rathke’s pouch. Two components of the pituitary gland, the adenohypophysis and neurohypophysis, are of different ectodermal origins. Cells in the anterior wall of Rathke’s pouch proliferate rapidly, forming the pars distalis (the anterior lobe of the pituitary gland), while cells from the posterior wall differentiate into the pars intermedia, then extend superiorly to become the pars tuberalis (9-11)(Figure 5). This is the development of the adenohypophysis. During the fifth week of gestation, the pouch fuses dorsally with the infundibulum (9, 10), which gradually gives rise to the median eminence, the infundibular stem, and the pars nervosa of the neurohypophysis, also known as the posterior lobe of the pituitary (9). The infundibular stem, along with the pars tuberalis, comprises the pituitary stalk (10).
. A, 4th week of gestation; B, 5th week of gestation; C, D, 3rd - 5th month of gestation.")
Development of the pituitary gland (11). A, 4th week of gestation; B, 5th week of gestation; C, D, 3rd - 5th month of gestation.
Traditional embryology makes clear two pertinent points. First, Rathke’s cleft normally detaches from the oral epithelium (9-11). If it fails to regress and be obliterated, the cleft may dilate and be filled with fluid or mucus, resulting in a RCC. This histological and anatomic basis of RCC formation also explains why most RCCs are located between the anterior and posterior lobes of the pituitary (10-12). Some authors have suggested that the cyst could appear anywhere along the usual migration path of Rathke’s pouch (12, 13). Second, the adenohypophysis develops closely with the neurohypophysis, especially the median parts (the pars intermedia and pars tuberalis), along with the infundibular stem. It is believed that contact between these two structures is necessary to provide neuroectodermal signaling for proliferation and later cell fate determination of pituitary cells (14). The infundibular stem, along with the pars tuberalis, comprises the pituitary stalk (11).
Our series revealed three localization types of the RCC on the sagittal view, with different connections with the pituitary stalk. We suppose that Rathke’s pouch, located between the anterior and posterior lobes of the pituitary gland, might be separated into supra-anterior and infra-posterior parts by the infundibulum during gestation. If the supra-anterior portion of Rathke’s cleft remains and enlarges into a cyst, the inferior margin of the cyst would be located in front of the junction of the pituitary stalk with the pituitary gland (type 1). Otherwise, if the infra-posterior portion enlarges, the superior margin of the cyst would lie behind the junction of the pituitary stalk when the cyst is small (type 2), but could stretch across it once the cyst is dilates to a sufficient degree (type 3). If both portions are retained and enlarge, the cyst might form with a snowman or figure-eight appearance. Such cysts usually extend across the pituitary stalk and encircle it (type 3). Furthermore, the midline localization of RCCs on the coronal view coordinates with the position of Rathke’s pouch. The reason might be the pars tuberalis, consisting of the pituitary stalk, also develops from the Rathke’s pouch. No matter how the Rathke’s cleft enlarges into a cyst (RCC), the pituitary stalk could not be shifted easily.
As mentioned above, the localization of RCCs in reference to the pituitary gland makes sense in terms of their embryological development. Conversely, a pituitary adenoma is formed by proliferation of the anterior wall of Rathke pouch (15). Prolactinoma and growth hormone-secreting adenoma, the two most common types, are often located laterally in the sella turcica (16, 17). Thus, a lateral localization with shift of the pituitary stalk is considered valuable for diagnosing a pituitary adenoma, except for the adrenocorticotropic hormone-secreting adenoma, which is often located at midline, overlapping with the RCC to a certain degree (16, 17).
This interpretation matches the embryological theory. The diagnostic performance according to the pituitary origin is excellent. ROC analysis obtained the highest AUC = 0.889 with the sagittal localization and AUC = 0.853 with the coronal localization respectively.
It has been suggested that RCCs can be diagnosed on MRI based on shape, signal intensity, enhancement features, and an intracystic nodule, if present (3-6). However, these characteristics are also present in other cystic sellar lesions. For example, wall enhancement reportedly provides information regarding the nature of cystic lesions, such as whether they are neoplastic or not (3-6). However, it is difficult to see the enhancement of the thin wall of an RCC through the enhancing normal pituitary gland surrounding it, especially when there is a partial volume-averaging effect (18). That is the reason why we did not record the enhancement features of lesions in this study.
Conventional MRI characteristics also helped to distinguish the two types of lesions. In the present study, RCCs tended to display hyper-intensity on T1 images, and to have intracystic nodules, which is consistent with previous publications (19-22). However, these features were not effective for differential diagnosis. MRI signal intensity depends on the composition of the cyst, which may include protein, mucopolysaccharides, and cholesterol (23, 24). Hence intensity is insufficient for making the diagnosis. In various previous studies, intracystic nodules have been regarded to have diagnostic value for RCC. While our series found no difference between RCCs and CPAs. The nodules correspond to protein concretions inside the cyst, which is difficult to distinguish from acute hemorrhage observed in pituitary apoplexy. CPAs are due to cystic degenerations, it is believed to be the result of hemorrhage or necrosis (25). It must be the reason why no difference about the intracystic nodule, which also explains the presence of fluid-fluid level was relatively specific for CPAs.
There were several limitations to the present study. First, it was a retrospective study, which may have caused a selection bias. Second, there were few comparison adenoma cases included, with only one type of cystic lesion. Studies with more cases, including cystic lesions of different types, such as craniopharyngiomas, need to be performed in the future to validate these preliminary results.
In conclusion, Cyst localization, observed easily on MRI, can be used as an effective parameter for diagnosing RCC and distinguishing it from a CPA. It is thought to relate to the Rathke’s pouch, which might to be separated into supra-anterior and infra-posterior parts by the infundibulum during gestation.
