


1. Background
Pulmonary thromboembolism (PTE) is a common complication of lower extremity deep venous thrombosis. The incidence rate of this pathology is 0.4% and may be life-threatening (1). PTE can be fatal in more than 30% of the cases and it is responsible for 10% of deaths in hospitals (2, 3). Diagnosis of PTE can be masked by comorbidities (4). Invasive pulmonary angiography has been accepted as the gold standard for the diagnosis of PTE; however, its use is limited due to its high mortality rate (0.5%), invasiveness, expense and requirement for specialized infrastructure that may not be available in all centers (5).
Multi-detector CT (MDCT) is a new area in CT angiography applications which is non-invasive and has been largely replacing invasive techniques for the diagnosis of PTE (6-8). The radiation dose is higher in MDCT angiography because of thin slices and more cross-sections; however it is possible to decrease the radiation dose without affecting the diagnostic accuracy of PTE by decreasing the kV value (9). Although the side effects of CM are well known, contrasted CT examinations using iodine-based contrast media (CM) are routinely used in radiological examinations. Some patients may experience kidney failure because of CM given during angiography applications (10). CM volume can significantly be decreased by using CM protocols in CT angiography for pulmonary embolism (PE) without impairment of the diagnostic image quality (11).
2. Objectives
The aim of this study is to investigate the application of low dose CM and low tube voltage for the evaluation of pulmonary arteries (PAs) using MDCT in patients with suspected PTE.
3. Patients and Methods
In this retrospective study, 120 patients with an initial diagnosis of PTE referred to the radiology department for computed tomography pulmonary angiography (CTPA) examination between January, 2014 and April, 2015 have been screened. Twenty patients have been excluded (allergy to CM, n = 8; serum creatinine > 1.5 mg/dL, n = 12) and 100 patients (age- and gender-matched, 50 patients in each group) have been included. Ethical approval for the study was obtained from the local university ethics committee, and all the participants signed a written informed consent. Patients with a known allergy to CM, kidney function disorder (serum creatinine > 1.5 mg/dL), pregnancy, respiratory distress, general condition disorder, hyperthyroidism and epilepsy were not included in the study. CT examination was carried out with a 128 multi-slice CT device (Definition AS, Siemens Medical Solutions, Forchheim, Germany). CTPA parameters were determined as follows: 300 ms rotation time, 128 × 0.6 mm collimation, 1 mm slice thickness and 1.0 - 1.2 pitch value. The tube current was determined by taking a reference value of 100 milliampere second (mAs). CareDose4D (Siemens) method was used for all the patients. The cases were divided into two groups: group A (n = 50) with 0.5 mL/kg CM and 80 kV value, group B (n = 50) with 1 mL/kg CM and 100 kV value. Attenuation values were measured from the center of different pulmonary arterial segments. Values over 350 HU were accepted as significant. Image qualities of all pulmonary arterial segments were sufficient for diagnosis. For all cases, the CM used was iopromide (Ultravist; Schering, Berlin, Germany) at a dose of 370/100 mg/mL that was delivered at 5 mL/s for CTPA scans. After CM injection, serum physiologic (30 mL) was given at a bolus dose of 5 mL/s. In this way, any residual CM in the injector line and the spaces on the right was transferred to the arterial system. Serum physiological and CM applications were made by using a two-headed automatic injector (Stellant, Medrad, and Inianola, USA). CTPA examination was started automatically using the ‘bolus tracking’ method (Care bolus, Siemens). The triggering value for a region of interest (ROI) located in the main pulmonary artery (PA) was chosen as 120 HU in this method. Slices in craniocaudal direction starting from the thorax up to the level of the diaphragm were taken. All CTPA data were recorded in a picture archiving and communication system (PACS). CTPA images were evaluated after transferring into different workstations from the capturing console and postprocessing (Leonardo, Siemens Medical Solutions, and Forcheim, Germany). Measurements of PAs density were made in axial CTPA images with a thickness of 0.6 mm. After the images were acquired, we evaluated PA enhancement, image quality sufficiency, motion artifacts, and radiation dose. All CTPA findings were independently evaluated by two radiologists. Findings of CTPA examination such as thrombus location, pleural effusion and consolidation accompanying pulmonary embolism and measurements of PAs density were carried out and recorded by radiologists. PTE is an emergency, and CTPA applications are usually achieved in emergency condition. So, body-mass index of patients was not measured in our study.
A region of interest (ROI) with a minimum area of 2 cm2 was used to evaluate the PA attenuation in the central segment. Measurements were made in segmental or sub-segmental arteries in apical and basal segments in order to evaluate the attenuation of peripheral PAs. The area located between the upper and lower borders of the arcus aorta was chosen for the apical segment. The area located between the inferior pulmonary veins and diaphragm was evaluated as the basal segment. Since peripheral PAs have a very small diameter, the highest value that could be measured was used. Evaluations were made solely in the axial segments. 700 separate density measurements for PAs including the main PA, right main PA, left main PA, right-left apical PA, right-left basal PA were made for the entire patient cohort (n = 100).
CTPA (window width 700 HU, window level 80 HU) and lung parenchymal (window width 1200 HU, window level 600 HU) windows were used in the examination. Image quality parameters, PAs contrasting and motion artifacts were previously defined in the literature (12) by using subjective evaluation scales (Table 1).
| Scale and score | Describtion |
|---|---|
| Image quality | |
| 1 | Very bad, no diagnosis possible |
| 2 | Low, confidence in making diagnosis degraded |
| 3 | Moderate but sufficient for diagnosis |
| 4 | Good |
| 5 | Excellent, enabling excellent differentiation of even small structures |
| Pulmonary arterial enhancement | |
| 1 | None, no diagnosis of PE possible |
| 2 | Slight |
| 3 | Sufficient |
| 4 | Good |
| 5 | Excellent |
| Motion artefacts | |
| 1 | Massive, no diagnosis possible |
| 2 | Definite, establishment of diagnosis impeded |
| 3 | Definite but image sufficient for establishment of diagnosis |
| 4 | Slight |
| 5 | None |
Image Quality Characteristics Scales
Prediction of effective dose for CTPA was based on the European study group’s quality criteria for CT (13). With this method, the effective dose was calculated by multiplying the dose length (the dose taken across the length of the anatomical area covered by the examination; dose length product [DLP], mGy.cm) and the conversion factor of the anatomical chest area was examined (k = 0.017 mSv.mGy-1.cm-1). During the capture of the images, the CT device used in the current study was determined the mAs amount automatically according to the reference mAs value based on the width of the slice area.
3.1. Statistical Analysis
SPSS 15.0 (SPSS, Inc., Chicago, IL) was used for statistical analysis. The baseline characteristics and measurement of attenuation values of study subjects were presented as percentages for dichotomous variables and mean ± standard deviation and as appropriate according to the distribution of the data. Categorical variables were shown as number and percentage. The differences between groups were checked by χ2 test for categorical variables or by independent t test for continuous variables. A P value of < 0.05 was considered as significant.
4. Results
One hundred patients (49 male and 51 female, age range: 23 - 85 years old) were enrolled in this study. Gender and age distribution of patients were as follows: group A; mean age 61.7 ± 15.9 years, males 24, females 26 and group B; mean age 54.2 ± 20.9 years, males 25, females 25. No statistically significant difference was determined in age and gender distribution between the groups (P > 0.05).
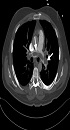
PTE was detected in twenty-one patients (21%) in both groups. On CTPA examination, PTE was detected in the central PAs of three patients (3%), segmental and sub segmental peripheral PAs of 18 patients (18%) (Figure 1). The pleural effusion of 13 patients (13%), consolidation of 17 patients (17%), and an increase of PAs diameters of 25 patients (25%) were detected.
 and group B (D - F)")
Measurements diagnosed with pulmonary embolism; group A (A - C) and group B (D - F)
Density measurements of the PAs segments were made for every patient in both groups in the main PA, right main PA, left main PA, right-left apical PA, and right-left basal PA segments (Table 2). Attenuation values were over 500 HU in all PA segments measured in group A where low dose CM and low voltage (0.5 mL/kg and 80 kV) were used. In group B where standard dose CM and standard voltage (1 mL/kg and 100 kV) were used, the highest attenuation value measured was 421.7 ± 144.8 HU (Figures 1 and 2).
| Variables | Group A: 80 kVp | Group B: 100 kVp | P value |
|---|---|---|---|
| Total mAs | 1393.6 ± 235.8 | 1433.6 ± 231.3 | 0.396 |
| Total DLP | 76.5 ± 17.3 | 162.1 ± 31.3 | < 0.001 |
| Main PA | 544.9 ± 178.9 | 385.2 ± 124.9 | < 0.001 |
| R. Main PA | 520.6 ± 166.9 | 373.5 ± 116.1 | < 0.001 |
| L. Main PA | 513.1 ± 161.1 | 365.5 ± 117.4 | < 0.001 |
| R. Upper lobe PA | 545.0 ± 161.9 | 405.6 ± 142.5 | < 0.001 |
| R. Lower lobe PA | 550.7 ± 162.9 | 394.4 ± 143.0 | < 0.001 |
| L. Upper lobe PA | 575.0 ± 183.1 | 421.7 ± 144.8 | < 0.001 |
| L. Lower lobe PA | 566.5 ± 181.4 | 412.6 ± 126.6 | < 0.001 |
| Average of all data | 532.7 ± 243 | 380.6 ± 232 | < 0.001 |
, right pulmonary artery 694.71 HU, left pulmonary artery 767.13 HU. B, Mean attenuation values of group B; main pulmonary artery 513.10 HU, right pulmonary artery 486.20 HU, left pulmonary artery 476.50 HU. C, Mean attenuation values of group A; right lower zone pulmonary artery branch 879.68 HU, left lower zone pulmonary artery branch 860.03 HU. D, Mean attenuation values of group B; right lower zone pulmonary artery branch 494. 30 HU, left lower zone pulmonary artery branch 411.50 HU. E, Mean attenuation values of group A; right upper zone pulmonary artery branch 779.40 HU, left upper zone pulmonary artery branch 859.30 HU. F, Mean attenuation values of group B; right upper zone pulmonary artery branch 611.00 HU, left upper zone pulmonary artery branch 537.40 HU.")
A, Mean attenuation values of group A; main pulmonary artery 730.66 Hounsfield unit (HU), right pulmonary artery 694.71 HU, left pulmonary artery 767.13 HU. B, Mean attenuation values of group B; main pulmonary artery 513.10 HU, right pulmonary artery 486.20 HU, left pulmonary artery 476.50 HU. C, Mean attenuation values of group A; right lower zone pulmonary artery branch 879.68 HU, left lower zone pulmonary artery branch 860.03 HU. D, Mean attenuation values of group B; right lower zone pulmonary artery branch 494. 30 HU, left lower zone pulmonary artery branch 411.50 HU. E, Mean attenuation values of group A; right upper zone pulmonary artery branch 779.40 HU, left upper zone pulmonary artery branch 859.30 HU. F, Mean attenuation values of group B; right upper zone pulmonary artery branch 611.00 HU, left upper zone pulmonary artery branch 537.40 HU.
Average attenuation values in the main PA and bilateral PA segments were measured as 532.7 ± 243 HU in group A and 380.6 ± 232 HU in group B; attenuation values were significantly higher in group A than group B (P < 0.001) (Figure 2).
The CT device automatically calculated the effective dose calculations based on DLP values. Total DLP (76.5 ± 17.3 mGy.cm vs. 162.1 ± 31.3 mGy.cm, P < 0.001) and effective dose values (1.2 ± 0.2 mSv vs. 2.4 ± 0.2 mSv, P < 0.001) were significantly lower in group A than in group B.
5. Discussion
We found that the total mean attenuation values of PAs were significantly higher in group A than in group B (532.7 ± 243 HU vs. 380.6 ± 232 HU, respectively) (Table 2). Additionally, total DLP and effective dose values were significantly lower in group A than in group B. Twenty-one patients (21%) in both groups were detected for PTE.
Pulmonary angiography is the gold standard in the diagnosis of PTE and the sensitivity and specificity of this technique has been reported to be 90% and 94%, respectively (13). Pulmonary angiography is an invasive procedure and is not widely available. On the other hand, CTPA is a non-invasive radiological imaging method using an multi-detector CT (MDCT) device with high sensitivity and specificity, low false negativity or false positivity ratios. CTPA is used widely in daily clinical applications for PTE diagnosis in many clinics (14).
One disadvantage of CTPA is the health risk associated with the radiation dose and amount of CM used. The radiation dose constitutes an important problem especially in less risky pulmonary embolism, in young female patients and patients who clinically have low probability for pulmonary embolism (12). Alterations in technical parameters without significantly affecting the diagnostic quality can decrease the radiation dose. These technical parameters include decreasing the tube current (mA) and gantry rotation time (s), decreasing the kV, using automatic tube current modulation, decreasing the scanning area and increasing the table speed (7).
Different voltage amounts such as 140 KV - 80 kV were used in CTPA examinations in different clinics (13-15). Keeping other factors constant, decreasing the tube voltage from 120 kV to 80 kV decreases the radiation dose by at least 60%. However, decreasing the tube voltage increases noise while increasing the image contrast. As a result, signal noise ratio (SNR) is decreased since the relative increase in noise is more than the increase in image contrast (6, 12). On the other hand, it was demonstrated that diagnostic imaging quality in CTPA is preserved even when the tube voltage applied is decreased to 80 kV due to the increase in photo-electric event (14). Decreasing the tube voltage from 140 kV to 120 kV and even to 80 kV increases X-ray attenuation in the order of 2 and 1.6, respectively (15). In our study, the HU numbers are higher in group A than group B thanks to lower kV values in group A.
Image noise can increase appreciably when low kV is used. This is particularly important in wide body areas such as the abdomen. However, low kV applications in the lungs do not constitute a problem since there is a very significant density difference between the interstitium surrounding the air-filled alveoli and vascular structures. X-ray attenuation and absorption in the alveoli are significantly low. This increases the image clarity of the neighboring parenchymal and vascular structures (15). The aim of the current study was to take advantage of this low X-ray attenuation and absorption in the thoracic cavity and investigate the feasibility of using low tube voltage in CTPA captures.
Although the side effects of CM are well known, contrasted CT examinations using iodine-based CMs are routinely used in radiological examinations. On the other hand, renal toxicity is the most important complication of iodine-based CMs. Amongst the patients administered with CM, 15% reported nephropathy in the absence of any other significant risk factor. This incidence may rise up to 80% in the presence of additional risk factors such as diabetes, cardiac failure, hyperglycemia, old age, and over use of CM (10, 16, 17). Many recent studies suggest a reduction in the amount of CM during CT examinations, especially in angiography to minimize renal toxicity (10, 18).
On the other hand, considering that low tube voltage increases CM opacification, many authors have suggested that both volume of CM used and tube voltage should be lowered together (11, 19). In this study, we aimed to acquire better attenuation values with better image quality by using low dose CM and low kV value in patients who underwent CTPA scan for suspected PTE.
Schuller-Weidekamm et al. (12) detected significantly higher attenuation values at 100 kV compared to 140 kV in central and peripheral PAs with an average density of 268 ± 63 HU at 140 kV and 379 ± 95HU at 100 kV in the main PA. Wintersperger et al. (15) reported an average arterial attenuation value of 432 ± 80 HU at 100 kV and 333 ± 90 HU at 120 kV where the mAs value was held constant in aortoiliac CT angiography. These authors reported a significant decrease in the radiation dose taken by the patient.
In a previous study, we separated the cases into two groups as standard dose (group A; 120 kV and 1 mL/kg, CM) and low dose (group B; 100 kV and 0.5 mL/kg CM) in order to investigate the feasibility of using low CM volume and kV values in carotid computed tomography angiography (CTA) using 128 slice MDCT (6). We observed that in low dose applications (group B), the arterial attenuation values were higher and the exposed radiation dose was lower (6).
Viteri-Ramirez et al. (20) used a dual-source CT system (similar to the current study) on 70 patients with a pre-diagnosis of PTE. The patients were divided into two groups: n = 35, 80 kv/60 mL for group A and n = 35, 100 kV/80 mL for group B. The average attenuation values were 362.4 ± 100.2 HU for group A and 262.4 ± 134.3 HU for group B and the difference was statistically significant. Total DLP values were measured as 64.5 ± 43.5 mGy-cm in group A and 161 ± 69.1 mGy-cm in group B and effective dose values were measured as 1.1 ± 0.7 mSv in group A and 2.7 ± 1.2 mSv in group B. The difference in total DLP and effective dose between the two groups was statistically significant (P < 0.001). In the current study, amongst the 100 patients with a pre-diagnosis of PTE the total mean attenuation values for PAs were measured 532.7 ± 243 HU in group A (n = 50, 0.5 mg/kg CM and 80 kV) and 380.6 ± 232 HU in group B (n = 50, 1 mg/kg CM and 100 kV). Total DLP (76.5 ± 17.3 mGy.cm in group A, 162.1 ± 31.3 mGy.cm in group B) and effective dose values (1.2 ± 0.2 in group B and 2.4 ± 0.2 in group B) were found to be significantly lower in group A (P < 0.001).
Viteri-Ramirez et al. (20) used a protocol whereby the tube voltage was decreased from 100 kV to 80 kV similar to the current study. These authors used a standard dose of 80 mL CM in group B while a lower CM volume of 60 mL was used in group A. In the current study, a standard CM dose of 1 mL/kg was used in group B while the dose was halved to 0.5 mL/kg in group A. In spite of the lower CM volume, we observed higher average attenuation values of PAs in group A. Additionally, we think that there may be a significant decrease in the dose of radiation with the lower tube voltage in group A. Moreover, allergic reaction and possibility of CM-induced nephropathy can be significantly decreased.
The time of initiation of CT angiography after the application of CM is important for which bolus injection and bolus tracking methods are routinely used. In this case, image capturing starts automatically when CM attenuation value reaches a pre-determined threshold (21, 22). In our study, 30 mL serum physiological was given at 5 mL/s after application of CM at 5 mL/s to transfer any remnant CM in the injector line and other spaces using "bolus tracking" technique in 128 slice MDCT.
Increasing the scanning rate and shortening the examination time provides an opportunity to decrease the CM dose in CT angiography applications. Previously, doses between 140 and 160 mL were used in PA CT angiography; this was reduced to less than 100 mL with the new MDCT devices (14). We aimed to decrease CM amount further by using a dose of 0.5 mL/kg. The heaviest patient in our cohort was 120 kg for whom 60 mL CM was used while the leanest patient was 55 kg and the CM amount used was 22.5 mL. An average of 40 - 45 mL CM was used, which is well below the amount that is used routinely.
The limitations of our study include a relatively small cohort of 100 patients and a lack of data on body mass index since most of the CTPA were carried out as an emergency procedure. Additionally, comparative CTPA examinations using two separate kV values and CMs could not be carried out in the same patient to minimize exposure to radiation and CM.
