1. Background
Assessment of disease activity in Crohn’s disease is important in defining its management, as well as for monitoring the effects of treatment. The Crohn’s Disease Activity Index (CDAI) is well established for the evaluation of the clinical activity of Crohn’s disease, along with elevation of C-reactive protein (CRP) concentrations (1, 2). The CDAI is a clinical evaluation based on scores for eight variables based on symptoms, laboratory data, and clinical status (Table 1). Radiologically, Doppler ultrasonography (US) and magnetic resonance imaging (MRI) have also been evaluated in several studies to examine whether they reflect the disease activity in patients with Crohn's disease (3-5). No radiologic technique is regarded as the gold standard for a reliable and reproducible method of inflammatory activity in Crohn’s disease.
| Variable | Weighting Factor |
|---|---|
| Number of liquid or soft stools over 7 days | × 2 |
| Abdominal pain | × 6 |
| 0 = none | |
| 1 - 2 = intermediate | |
| 3 = severe | |
| General well-being | × 6 |
| 0 = well | |
| 1 - 3 = intermediate | |
| 4 = terrible | |
| Extraintestinal complications | × 20 |
| Arthritis/arthralgia, iritis/uveitis, erythema nodosum, pyoderma gangrenosum, aphthous stomatitis, fissure/fistula/abscess, or fever of > 37.8°C during the previous week | |
| Use of antidiarrheal drugs in the previous 7 days | × 30 |
| Abdominal mass | × 10 |
| 0 = none | |
| 2 = questionable | |
| 5 = definite | |
| Hematocrit level | × 6 |
| 0.47 in males | |
| 0.42 in females | |
| Percentage deviation from standard body weight | × 1 |
Computerized tomography enterography (CTE) is useful in evaluating patients with Crohn’s disease because it is an accurate and feasible technique for detecting enteric inflammation in addition to extraluminal complications (6, 7), compared with capsule endoscopy (8). CTE differs from routine abdominal CT in that it uses a large volume of a neutral oral contrast agent to improve distention of the bowel lumen and depiction of the small bowel wall. CTE can also show changes in bowel wall thickening or enhancement in detail, as compared with conventional CT. In the current study, segmental mural hyperenhancement, small bowel wall thickening, increased density of mesenteric fat, and engorged vasa recta (the “comb sign”) were shown, which are correlated with active inflammation in Crohn’s disease (6, 8-14). In addition, previous studies revealed that CTE might be useful for monitoring Crohn’s disease activity, which was evaluated based on symptoms and clinical follow-ups (15).
Several studies have reported the imaging features of CTE to be helpful in the diagnosis of active Crohn’s disease, and evaluated whether imaging findings are correlated to disease activity for each CTE finding (8, 16). However, few studies have evaluated which CTE findings independently predict disease activity in Crohn’s patients, or the reproducibility of visual assessments of CTE findings. To our knowledge, the diagnostic accuracy of CTE to predict Crohn’s disease activity has not been previously reported.
2. Objectives
The purpose of this study was to evaluate the useful findings of CTE in the prediction of Crohn’s disease activity, and to correlate the CTE findings with CDAI and CRP.
3. Patients and Methods
3.1. Patients
This retrospective study was approved by the institutional review board, and the need for informed consent was waived. All patients with inflammatory bowel disease at our institution between March 2007 and March 2013 were referred to a gastroenterologist for small bowel evaluation and CTE. The inclusion criteria included a known diagnosis of Crohn’s disease based on endoscopic or pathologic findings, and contrast-enhanced CTE examinations. Fifty CTE imaging in 39 patients (13 women, 26 men; mean age 27 years, range 14 - 46 years) confirmed as Crohn’s disease involving the small bowel were evaluated. Ten patients underwent second follow-up CT scans, and one patient underwent a third follow-up CT scan at least 6 months later. The diagnosis of Crohn’s disease was based on pathologic findings in 32 cases, with 27 patients which were proven by surgical resection in 6 patients, and endoscopic biopsy in 21 patients. Histopathologic examinations of resected bowel and endoscopic biopsy specimens indicated chronic and active inflammation with the formation of non-caseating granulomas and negative results for acid-fast staining in all 21 of these patients. For the other 18 patients, the diagnosis was based on characteristic imaging findings, such as multifocal layered wall thickening with skipped lesions, pseudosacculation, negative results for acid-fast staining, capsule endoscopic findings, and clinical response to treatment for Crohn’s disease.
The CDAI was assessed based on clinical and laboratory variables. CRP was also recorded, which was performed within one month (mean, 6.9 days; range 0 - 30 days) before or after CTE.
3.2. CT Enterography Technique
All patients underwent CTE after fasting for at least 6 hours. Each patient was administered 1500 mL of 3% sorbitol solution during the 60 minutes before CTE, in the form of 250 mL aliquots administered every 10 minutes. CTE was performed with a 64-MDCT scanner (Brilliance 64, Philips Medical Systems, Cleveland, OH, USA). After non-enhanced images were obtained, each patient was given 130 mL of iopromide (Ultravist 370; Schering, Berlin, Germany) intravenously at a rate of 3.0 - 3.5 mL/s with an automatic power injector. Late arterial phase and portal venous phase scanning was performed at 45 seconds and 80 seconds, respectively, after contrast injection. The scanning parameters were as follows: beam collimation, 64 × 0.625 mm; gantry rotation time, 0.75 seconds; pitch, 0.891; field of view, 350 mm; 120 kVp; and 300 mA. Both axial and coronal reconstruction images were generated with section thicknesses of 3 mm and reconstruction intervals of 3 mm.
3.3. Image analysis
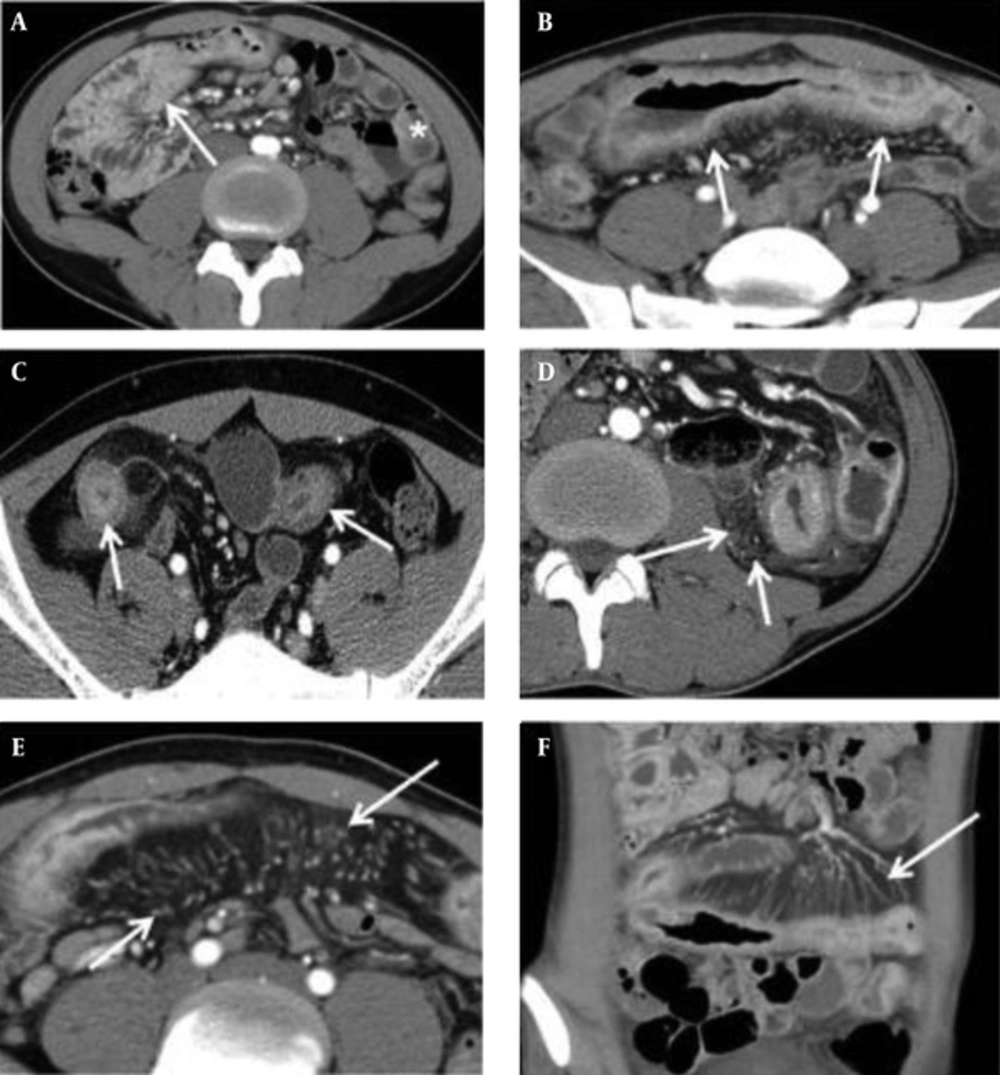
Two gastrointestinal radiologists (with 11 and 8 years of abdominal CT experience, respectively) independently reviewed all CT images to evaluate findings for Crohn’s disease. They were given no clinical, endoscopic, or pathologic information, and were blinded to the results of other imaging examinations. If the inter-observer agreement was greater than a good degree, we used the scores of the CT parameters of one of the reviewers. These findings included mural hyperenhancement, mural thickness, mural stratification, the comb sign, and mesenteric fat density. Mural hyperenhancement was defined as segmental increased attenuation of the bowel wall compared with the attenuation of adjacent normal small bowel loops. Mural thickening was classified as the degree of small bowel wall thickness. Mural stratification was defined as visualization of a two- or three-layer appearance within the small bowel wall, classified based on patterns of layered wall thickening. The comb sign was defined as regional vascular enlargement of the vasa recta, as previously described (12). Increased mesenteric fat density was defined as increased inhomogeneous attenuation in the perienteric fat, compared with the attenuation of perienteric fat or subcutaneous fat adjacent to non-affected bowel loops (17) (Figure 1). Each of these CT parameters was graded with a four-point scale, which is described in detail in Table 2. If multifocal skipped lesions were involved in a small bowel loop, an affected bowel loop that presented with the most severe degree of CT parameters was evaluated. Enhanced lymph nodes, fibrofatty proliferation, sinus or fistula, abscess, and stricture were also evaluated as absent (0) or present (1).
Five CTE Parameters. A, Mural hyperenhancement, defined as segmental increased attenuation of the bowel wall (arrow) compared with the attenuation of normal small bowel loop (asterisk); B, Mural thickness, defined as a bowel wall thickness of > 3 mm (arrows); C, Mural stratification, defined as a visualization of a two- or three-layer appearance within the bowel wall (arrows); D, Increased density in the mesenteric fat (arrows); E, and F, The comb sign, defined as vascular enlargement of the vasa recta (arrows).
| Parameters | |
|---|---|
| Mural Hyperenhancement (Late Arterial Phase) | |
| 0 | Not greater than enhancement of the normal-appearing distended loops in the same bowel segment |
| 1 | Greater than enhancement of the adjacent normal-appearing distended bowel loops |
| 2 | Present to a moderate degree, not 1 or 3 |
| 3 | Greater than enhancement of collapsed bowel loop wall |
| Mural thickening (portal phase) | |
| 0 | Same thickness of the adjacent non-inflamed bowel loops |
| 1 | Greater than 3 mm and less than 5 mm |
| 2 | Greater than 5 mm and less than 7 mm |
| 3 | Greater than 7 mm |
| Mural stratification (late arterial phase) | |
| 0 | Non-visualization of layers of the bowel wall |
| 1 | Bilaminar appearance of the small bowel wall |
| 2 | Trilaminar appearance of the small bowel wall |
| 3 | Trilaminar appearance with intramural edema (soft-tissue or water attenuation in the submucosa) |
| Comb sign (portal phase) | |
| 0 | Normal mesenteric vascularity |
| 1 | Minimal regional engorged vasa recta |
| 2 | Segmental dilatation of vasa recta with mild tortuosity |
| 3 | Diffuse tortuous vasa recta, oriented perpendicularly with extension to the affected bowel wall |
| Increased mesenteric fat density (portal phase) | |
| 0 | Same attenuation as perienteric fat adjacent to non-inflamed bowel loops |
| 1 | Mild inhomogeneous attenuation as compared to that of non-inflamed bowel loops |
| 2 | Present to a moderate degree, not 1 or 3 |
| 3 | Diffuse increased mesenteric fat attenuation |
3.4. Statistical Analysis
For analysis of correlations between scores of 0 to 3 in each of five CT parameters, as well as of CDAI and CRP, we used Spearman’s rank correlation analysis. A binary logistic regression analysis was also used to examine the associations between potential predictors and active Crohn’s disease. The clinically active inflammatory state of Crohn’s disease is defined as the cut-off value of CDAI at more than 150 (18). For the five CT parameters evaluated on the four-point scale, 0 - 1 was regarded as ‘negative’ and 2 - 3 was ‘positive’ in the binary logistic regression analysis. The predictive model, the CTE index, was established by adding together the scores for the five CT parameters. To assess the predictive accuracy of the model, a receiver-operating characteristic curve analysis was used, and area under the receiver operating characteristic curve (AUROC) estimates were reported. The cut-off value was determined where the value of the sum showed the greatest sensitivity and specificity. With this cut-off value, the sensitivity, specificity, positive predictive value, negative predictive value, and overall accuracy were estimated.
The agreement between the two radiologists for assessment of CT parameters using the four-point scale was also evaluated by using the κ statistics. According to Landis and Koch (19), the κ value ranges are < 0.20, 0.21 - 0.40, 0.41 - 0.60, 0.61 - 0.80, and 0.81 - 1.00, indicating poor, fair, moderate, good, and almost perfect agreement, respectively. Statistical software (SPSS, IBM Corp. Released 2011. IBM SPSS Statistics for Windows, Version 20.0. Armonk, NY: IBM Corp.) was used for all data analyses except for the ROC curve analysis, which was done with MedCalc (version 10.3.0.0; MedCalc Software, Mariakerke, Belgium). A p value of less than 0.05 was considered to indicate a significant difference.
4. Results
4.1. Basic Characteristics
A total of 50 cases of Crohn’s disease were studied with CTE. The CDAI scores ranged from 6 to 350.5, with a median value of 128.8. Twenty-one cases (42%) had high CDAI scores exceeding 150, which was regarded as the active inflammatory phase. The remaining 29 cases (58%) had CDAI scores of < 150, which reflected the inactive phase of Crohn’s disease. Forty-eight cases had CRP concentrations ranging from 0.19 to 291 mg/dL. Of those, 44 cases (92%) had an elevated CRP of > 2.0 mg/dL, and four cases (8%) had normal CRP levels, defined as <0.8 mg/dL. There were enhanced lymph nodes in 14 cases (28%), fibrofatty proliferation in 10 (20%), sinus or fistula in four (8%), abscess in three (6%), and stricture in 24 (48%).
Most cases with CDAI scores of > 150 (n = 21) were positive for all of the CT parameters for both reviewers. In these cases, mural hyperenhancement was observed in all cases, mural thickening in 20/21 (95%), mural stratification in 19/21 (91%), the comb sign in 19/21 (91%), and mesenteric fat density in 8/21 (38%) at a moderate to severe degree. Moreover, 21/29 (72%) cases with CDAI scores of < 150 showed a moderate to severe degree of mural hyperenhancement for both reviewers. Mural thickening in 18/29 cases (62%), mural stratification in 8/29 (28%), the comb sign in 19/29 (66%), and increased mesenteric fat density in 8/29 (28%) were shown, respectively.
4.2. Associations Between CTE Parameters and CDAI and CRP
Spearman’s rank correlation coefficients comparing the different CT parameters of active Crohn’s disease are summarized in Table 3. Of the five CT parameters, CDAI and CRP were significantly correlated with mural hyperenhancement, mural thickness, mural stratification, the comb sign, and mesenteric fat density (Spearman’s coefficient = 0.318 - 0.548, P < 0.05). CRP was significantly correlated with CDAI (r = 0.676; P < 0.001).
| CT Parameter | CDAI | CRP | ||
|---|---|---|---|---|
| Coefficient | P Value | Coefficient | P Value | |
| Mural hyperenhancement | 0.516 | 0.000 | 0.389 | 0.005 |
| Mural thickening | 0.442 | 0.001 | 0.386 | 0.006 |
| Mural stratification | 0.487 | 0.000 | 0.521 | 0.000 |
| Comb sign | 0.377 | 0.007 | 0.318 | 0.024 |
| Mesenteric fat density | 0.548 | 0.000 | 0.523 | 0.000 |
Abbreviations: CDAI, Crohn’s disease activity index CRP, C reactive protein.
To identify independent predictors of CTE parameters in the activity of Crohn’s disease, a binary logistic regression analysis was performed using multiple different CT parameters and CDAI scores. Accordingly, mural stratification, mesenteric fat density, and the presence of enhanced lymph nodes were identified as independent factors of active Crohn’s disease (P = 0.016, 0.021, and 0.038, respectively). The other CTE parameters, including mural hyperenhancement, mural thickness, the comb sign, and the presence of fibrofatty proliferation, were not significantly correlated with CDAI scores in a binary logistic regression analysis (Table 4).
| CT parameter | Beta Coefficient | Standard Error | Odds Ratio | P Value | 95% Confidence Interval | |
|---|---|---|---|---|---|---|
| Mural stratification | 1.823 | 0.760 | 6.192 | 0.016 | 1.395 | 27.480 |
| Mesenteric fat density | 3.420 | 1.485 | 30.556 | 0.021 | 1.665 | 560.666 |
| Enhanced lymph nodes | 3.218 | 1.548 | 24.983 | 0.038 | 1.293 | 518.768 |
| Fibrofatty proliferation | -2.866 | 1.934 | 0.057 | 0.138 | 0.001 | 2.522 |
| Fistula | 28.896 | 15248.249 | 3543617.343 | 0.998 | 0.000 | - |
| Stricture | -1.991 | 1.299 | 0.136 | 0.125 | 0.011 | 1.740 |
4.3. ROC Analysis
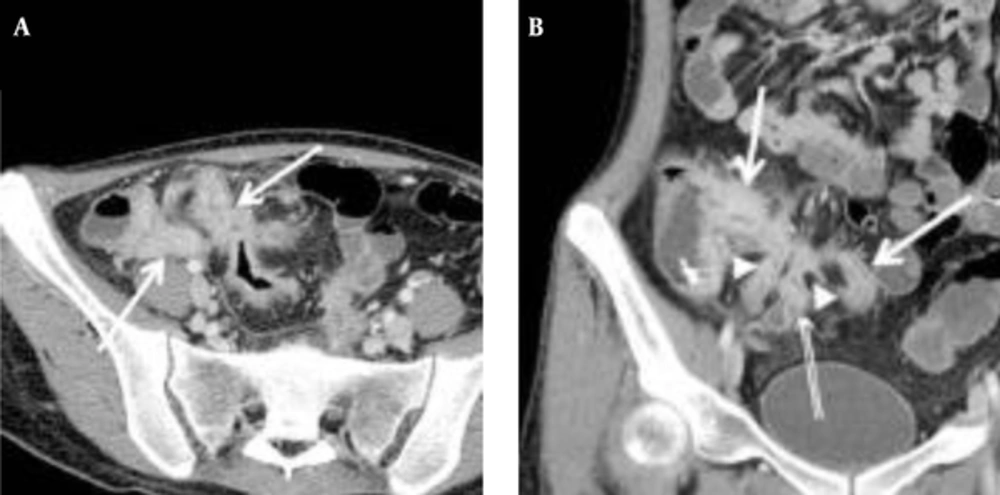
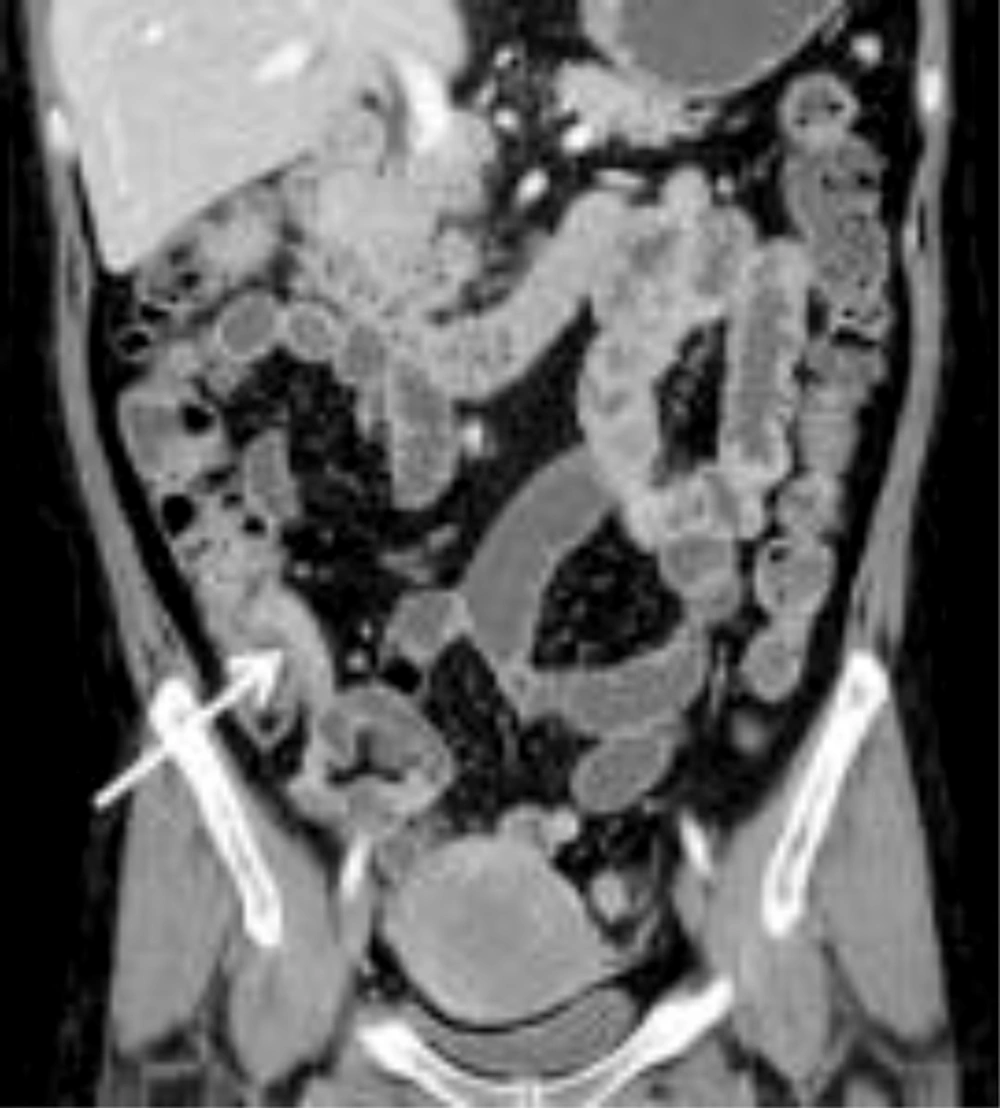
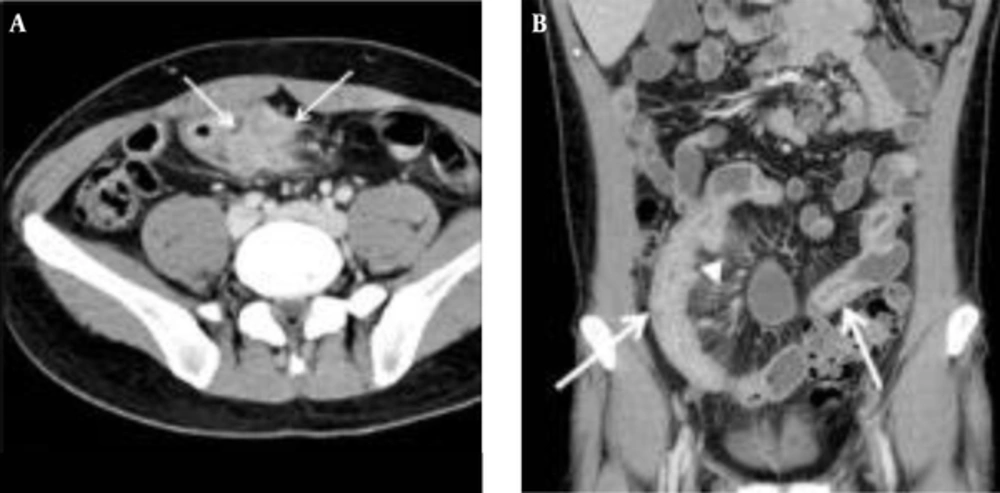
The mean CTE index in 50 cases was 10 (range, 4 - 14). The best cut-off value with which to differentiate inactive from active Crohn’s disease with the ROC curve analysis was 8, which yielded a sensitivity of 95% (20/21; 95% confidence interval [CI]: 76%, 100%) and a specificity of 59% (17/29; 95% CI: 39%, 77%) (Figures 2 and 3). There was one false-negative case using the CTE index, which was 7, with a CDAI score of 157, indicating active Crohn’s disease (Figure 4). With the given cut-off value of the CTE index, the positive predictive value was 63% (20/32), the negative predictive value was 94% (17/18), and overall accuracy was 74% (37/50). The AUROC was 0.85 (95% CI: 0.72, 0.94) for the differentiation of inactive from active Crohn’s disease.
A, Transverse; B, Coronal CTE images of a 21-year-old woman with the highest CTE index (score of 15) among the 23 patients, showing abnormal bowel enhancement with wall thickening (white arrows) in the terminal and distal ileum, mural hyperenhancement (double arrows), and fistula formation (arrow heads) between the distal ileal loops (CDAI = 197.5, CRP = 67.3 mg/dL).
A, Transverse; B Coronal CTE images of a 32-year-old man with a low CTE index (score of 7), which is lower than the given cut-off value, showing mural hyperenhancement with mild thickening (arrows). This patient’s CDAI score was 157, indicating active Crohn’s disease, and his CRP was 6.4 mg/dL
4.4. Inter-Observer Agreement of CT Parameters
The CT parameters between the two reviewers demonstrated good inter-observer agreement (κ = 0.653). The readers had almost perfect agreement (κ = 0.823) in identifying the comb sign as a finding of Crohn’s disease. There was good agreement for the identification of mural thickening (κ = 0.685), mural stratification (κ = 0.808), and mesenteric fat density (κ = 0.638), and fair agreement for mural hyperenhancement (κ = 0.311).
5. Discussion
Our study evaluated the usefulness of CTE in predicting Crohn’s disease activity using five CTE parameters: mural hyperenhancement, mural thickness, mural stratification, the comb sign, and mesenteric fat density. Our study validated the ability of visual assessment of CTE findings to indicate the active disease state in Crohn's disease, compared to clinical disease activity assessed by the noninvasive markers of CDAI and CRP. Visual assessment by two experienced radiologists had good inter-observer agreement (κ = 0.653) for all CT parameters, despite the subjectivity compared with quantitative measurements. Furthermore, the ROC analysis revealed that CTE findings predicted the presence of disease activity, with AUROCs ranging from 0.72 to 0.94.
CTE has received increasing attention because of its ability to detect small bowel mucosal inflammation, as well as the extra-enteric inflammatory changes that are radiographic signs of Crohn’s disease. In a previous study, CTE was more specific than capsule endoscopy or fluoroscopic small bowel examinations for active Crohn’s disease (2). Many researchers have investigated the imaging findings of conventional CT or CTE, including mural attenuation, bowel wall thickening, and the comb sign, which reflected the active inflammatory state of Crohn’s disease (6, 8, 9, 19, 20). Moreover, CTE has superiority compared to other clinical markers. Although CDAI scores or endoscopic findings have been used to monitor disease activity and treatment response in Crohn’s disease, imaging studies are necessary for evaluating the extent of disease and the presence of complications, such as fistula or abscess. The use of CTE enables the localization of disease activity to the small bowel. Capsule endoscopy is sensitive for the detection of early Crohn’s disease (15); however, radiologic examination is required in order to exclude obstruction before capsule ingestion, and there is a risk of capsule retention, which can occur in up to 6.7% of patients with Crohn’s disease (21).
Crohn’s disease is a transmural inflammatory process involving the bowel wall and mesentery. Recent studies have reported mural hyperenhancement and increased mural thickness as the most sensitive CT findings of active Crohn’s disease (9, 20). As in the literature, our results demonstrated a positive correlation between mural hyperenhancement, mural thickness, and the CDAI. Quantitative measures of these findings on CTE were also attempted by Bodily et al. (9), who found that mural hyperattenuation can predict histologic inflammation with relatively high sensitivity (81%). Mural thickening with multilayered stratification was predictive of acute disease, while homogeneous enhancement was prevalent in inactive disease (6). However, these were not independent predictors of disease activity in Crohn's disease in our study (P = 0.213 - 0.23). In particular, the inter-observer agreement for mural hyperenhancement was relatively low (κ = 0.311, fair agreement) compared with other parameters (better-than-good agreement).
Increased mesenteric fat density is often seen in active Crohn’s disease, and this appearance is due to the transmural extension of inflammation across the serosa and engorgement of the pericolic or perienteric vasculature surrounding the inflamed bowel segment (19, 20, 22). Several studies have reported positive correlations between the comb sign, mesenteric fat density, and the clinical activity of Crohn’s disease (10, 12). Moreover, Lee et al. (12) reported that the comb sign indicated active, advanced, and extended clinical disease. Of those, we identified a good correlation between CTE findings of mesenteric fat density and CDAI and CRP, and increased mesenteric fat density was a potential predictor of Crohn’s disease activity. Increased mesenteric fat density is a specific marker of active Crohn’s disease, reflecting inflammatory infiltration within the perienteric fat due to mesenteric adipocytes, which are believed to play a major role in the inflammatory response (17).
In this study, CTE had high sensitivity and negative predictive values of 95% and 94%, respectively, for the detection of active Crohn’s disease using the CTE index. There was one false-negative case in our study, which had active Crohn’s disease with a high CDAI; however, this was classified as the inactive state by the CTE index. This situation may be explained by insufficient dilatation of small bowel loops on CTE. To our knowledge, no published studies have assessed the diagnostic value of visual assessment of disease severity using CTE findings in the determination of Crohn’s disease activity. We evaluated the sum of the CT scores with a ROC curve analysis. The cut-off value was 8, which could differentiate between active and inactive Crohn’s disease. We could insist the active disease in case that almost CTE show strong positive findings.
In the present study, the inter-observer agreement for the CT parameters of Crohn’s disease was relatively high (κ = 0.653), particularly for the comb sign (κ = 0.823). In most prior studies of CTE in Crohn’s disease, researchers reviewed the CT findings by either one radiologist or in a consensus, rather than individually (9, 10, 15, 23). Booya et al. (8) evaluated small bowel enhancement characteristics on CTE and inter-observer agreement between two radiologists, for 42 patients with Crohn’s disease. The inter-observer agreement for specific CT findings was also high, particularly for mural thickening (κ = 0.83) and mural hyperenhancement (κ = 0.61) (9). Such agreement between two radiologists demonstrates the usefulness of CTE as an evaluation tool for active Crohn’s disease, and may improve the objectivity for monitoring disease activity. Of the five CT parameters, mural hyperenhancement had the lowest inter-observer agreement (κ = 0.311, fair agreement). Compared to a previous study (κ = 0.61), our result showed a lower agreement level (8). The reason for the lower inter-observer agreement in the evaluation of the severity of mural hyperenhancement may be that it was relatively subjective and divided based on a four-point scale in our study, while Booya et al. (8) used semiautomated quantitative measurements of mural attenuation.
Our study had several limitations. First, the radiation dose from CTE is higher than that from a routine single-phase abdominopelvic scan, and follow-up examinations are necessary due to the characteristics of Crohn’s disease. Recently, MR enterography has emerged; lack of ionizing radiation is its advantage over CTE (14, 24). However, MR enterography is more time-consuming, more costly, and more variable with regard to image quality, compared to CTE. Secondly, we focused on small bowel inflammation to evaluate the usefulness of CTE; however, the clinical and laboratory findings reflect all bowel segments. Although Crohn’s disease most commonly involves the small bowel, large bowel involvement is not uncommon. Involvement of the large bowel could affect the clinical variables. Thirdly, we relied on CDAI scores for defining disease activity in Crohn's disease; however, the CDAI reflects extra-enteric inflammation rather than enteric inflammation. Three of the five CT parameters evaluated in our study, including mural hyperenhancement, mural thickening, and mural stratification, were findings of enteric inflammation.
CT enterographic findings, such as mural hyperenhancement, mural thickening, the comb sign, and increased mesenteric fat density, are correlated to disease activity in patients with Crohn's disease. Mesenteric fat density is also correlated to CRP and is an independent predictor of the active disease state. Visual assessments of CTE findings are considerably reproducible and may be a useful diagnostic modality for the evaluation of Crohn’s disease activity.


