


1. Background
Nodular disease of thyroid gland is a common clinical problem. With the increasing use of ultrasonography, the detection rate has also increased. The prevalence of nodules detected in population during physical examination is 4% - 7% and 10% - 40% during ultrasonographic evaluation (1, 2). Approximately 5% of these nodules are malignant (3, 4). The primary aim of imaging modalities is to detect these malignant nodules.
The traditional evaluation of thyroid nodules includes physical examination, thyroid function tests, ultrasonography and scintigraphy. However, these methods can not reliably differentiate benign nodules from the malignant ones. Fine-needle aspiration biopsy (FNAB) is an efficient method but it has limitations (5, 6). Conventional T1 and T2 weighted sequences used in magnetic resonance imaging (MRI) also have limited value in differential diagnosis.
Diffusion-weighted MRI imaging (DWI) and the quantitative parameter, apparent diffusion coefficient (ADC) derived from it are used for evaluation of microscopic water diffusion percentage in tissues. Clinically, the most common application of DWI is in early recognition of cerebral infarction (7). However, its clinical applications have increased rapidly and DWI has been used in the evaluation of tumors. Studies in the head and neck region have shown that DWI can provide information in the characterization of tumors, cervical lymphadenopathies, and thyroid nodules (8-12). In recent years, several authors have shown that 1.5 Tesla (T) diffusion-weighted MRI imaging can give important data for differential diagnosis of thyroid nodules (2, 8-10). Recently, 3 T MR imaging is widely used clinically and has a higher signal to noise ratio. These high field strength magnets have the potential to provide better quality DWI image and ADC maps. Therefore, it is important to investigate how the ADC values of the norrnal thyroid gland, benign and malignant thyroid nodules vary in 3 T MR scanners. In literature, there are a limited number of studies related to DWI characteristics of thyroid nodules in 3 Tesla scanners (13, 14).
2. Objectives
The purpose of our study was to evaluate the clinical utility of 3 Tesla ADC values and normalized ADC ratios (nodule ADCMEAN/thyroid paranchymal ADCMEAN ratio) in differentiation between malignant and benign thyroid nodules and to compare these results with histopathological examinations.
3. Patients and Methods:
3.1. Patients and Control Group
In this prospective study, 32 patients who were candidates of surgery (20 women, 12 men, age range: 28 - 73, mean age: 52) were included. All patients had sonographically detected either solitary or multiple thyroid nodules. The participants were selected from the patients that were admitted to the General Surgery Department of our institution from November 2010 to March 2011. The study protocol was approved by the Local Ethics Committee. Informed consent was obtained before the examination. Patients with a history of FNAB within 3 weeks were excluded from the study. All patients were evaluated sonographically (Antares, Siemens, Erlangen, Germany) prior to MRI examination and patients with purely cystic nodules and nodules with a diameter smaller than 1 cm were excluded.
Twenty subjects without a known thyroid disease and who had undergone neck MR studies (11 male, nine female, mean age: 30) were also enrolled in the study.
3.2. MRI Protocol
MRI studies were performed with a high performance gradient of 3 Tesla MRI system (maximum gradient strength of 40 mT/m and the maximum slow rate in sec 200 mT/m) (Verio, Siemens, Erlangen, Germany). Four-channel phased-array neck coil was used.
The MRI protocol included: Turbo Spin Echo (TSE) T1 axial (repetition time [TR]/echo time [TE] 493/9.6, flip angle 150 degrees, number of excitation [NEX]: 2, matrix 384 × 257, field of view [FOV] 23 cm, slice thickness 5 mm, intersection gap 0 mm), T2 axial (TR/TE 3740/89, flip angle 150 degrees, NEX: 2, matrix 384 × 257, FOV 23 cm, slice thickness 5 mm, intersection gap 0 mm) and sagittal short tau inversion recovery [STIR] (TR/TE 4000/57, flip angle of 150 degrees, NEX: 2, matrix 320 × 240, FOV of 22 cm, slice thickness 5 mm; sectional width 1 mm, generalized autocalibrating partially parallel acquisitions [GRAPPA] factor 2) sequences.
DWI was acquired using a single shot spin echo echoplanar imaging (EPI) sequence, diffusion gradients were applied in three orthogonal directions simultaneously. Multiple axial scans covering the thyroid gland was acquired. Imaging parameters were as follows: TR/TE: 13200/75, matrix: 128 × 128, slice thickness: 4 mm, NEX: 2, FOV: 23 cm, bandwidth 1500 Hz/px. Spectral fat saturation (spectral attenuated inversion recovery [SPAIR]) was added to diffusion imaging and parallel imaging (GRAPPA factor: 2) algorithm was used. Diffusion weighted MR images were acquired with a pair of diffusion factors (b factor): 0 and 500 s/mm2 and 0 and 1000 s/mm2. The ADC maps were calculated for these b values.
3.3. MR Data Analysis
A radiologist specialized in head and neck radiology interpreted the ADC measurements. ADC values were measured using a separate workstation (Leonardo workstation, Siemens). One patient was excluded from the study due to image distortion caused by susceptibility artifact.
Nodular localization, internal structure, and size were determined using sagittal T2-weighted and STIR images. Cystic and hemorrhagic areas of nodules were determined and ADC measurement of these areas was avoided. Smallest standard (0.16 cm2) region of interest (ROI) was used to measure ADC values of nodules. Three different ROI measurements were applied for each ADC value measurement and the average of ADC values were calculated to determine the minimum, mean and maximum ADC values. ADC values were measured from the normal parenchyma of the thyroid gland in patients and in the control group as well. The intact thyroid parenchyma could not be detected in five patients with multinodular thyroid disease. The mean parenchymal ADC values of three patients with histopathological diagnosis of thyroiditis were excluded from the evaluations.
Thyroidectomy was performed for all patients. A pathologist who was blinded to MRI findings analysed the resected surgical material. Surgery was performed within one week after MR imaging. The histopathological results were correlated with the ADC values.
The flowchart provides information about the method of patient recruitment and data analysis (Figure 1).

Flowchart of the study. MRI, magnetic resonance imaging; n, number; MNG, multinodular goiter; ADC, apparent diffusion coefficient; MIN, minimum; MAX, maximum
3.4. Statistical Methods
Statistical analysis was performed by using SPSS version 15.0 software (SPSS Inc., Chicago, Illinois, USA). In case of more than two independent groups one way analysis of variance test (one way ANOVA) and post-hoc test (Bonferroni) was applied. The difference between two independent groups was investigated by individual difference between groups test (independent samples test) and Mann-Whitney U test. A P value less than 0.05 was considered statistically significant. A Receiver operating characteristic (ROC) curve analysis was performed to determine the cut off value for ADC for differentiating malignant from benign thyroid nodules. Intraclass correlation coefficients (ICC) were used to determine intraobserver reliability.
4. Results
The study population included 32 patients. The total number of nodules analyzed in our study was 76. Twelve patients had solitary thyroid nodules, 20 patients had multiple nodules. The size of the nodules varied between 1.1 cm to 6 cm (average size: 2.7cm). According to the histopathological results, 13 (17.1%) of the nodules were malignant, 63 (82.8%) nodules were benign. Histopathological findings of the malignant nodules revealed eight papillary and two medullary cancers, one follicular, one anaplastic and one poorly differentiated carcinoma. The benign nodules were diagnosed as hyperplastic nodules.
The normal thyroid tissue had a mean ADC (ADCMEAN) value of 1.805 × 10⁻³ mm2/s and 1.350 × 10⁻³ mm2/s at b:500 and b:1000, respectively in the control group. The ADCMEAN value of thyroid tissue could be measured in 25 patients. The normal thyroid tissue had a ADCMEAN value of 1.879 × 10⁻³ mm2/s and 1.423 × 10⁻³ mm2/s at b:500 and b:1000, respectively in patients with thyroid nodules. The ADCMEAN value of parenchyma in patients and in control groups did not differ significantly at b:500 and b:1000 (P > 0.05) (Table 1). The intraobserver agreement was very good for ADCMEAN at b:500 (intraclass correlation coefficient: 0.88; 95% confidence interval (CI), 0.73 - 0.94) and good for ADCMEAN at b:1000 (intraclass correlation coefficient 0.71; 95% CI, 0.22 - 0.88).
| Group | Mean, × 10-3 mm2/s | Standard deviation | P valuea |
|---|---|---|---|
| Parenchyma ADCMEAN b500 | > 0.05 | ||
| Malignant | 1.813 (1.310 - 2.300) | 0.278 | |
| Control | 1.805 (1.626 - 2.168) | 0.154 | |
| Benign | 1.954 (1.290 - 2.250) | 0.268 | |
| Parenchyma ADCMEAN b1000 | > 0.05 | ||
| Malignant | 1.491 (1.040 - 1.730) | 0.249 | |
| Control | 1.350 (1.147 - 1.711) | 0.150 | |
| Benign | 1.367 (1.050 - 1.720) | 0.195 |
Abbreviations: ADC, apparent diffusion coefficient
aP < 0.05 indicates significant difference.
The minimum ADC (ADCMIN), mean ADC (ADCMEAN), and maximum ADC (ADCMAX) values of malignant nodules were calculated as 1.092 × 10⁻³ mm2/s, 1.371 × 10⁻³ mm2/s, and 1.692 × 10⁻³ mm2/s, respectively at b:500. The ADCMIN, ADCMEAN, and ADCMAX values of benign nodules were calculated as 1.892 × 10⁻³ mm2/s, 2.176 × 10⁻³ mm2/s, and 2.474 × 10⁻³ mm2/s, respectively at b:500. The mean ADC values of malignant nodules at b:500 were significantly lower than mean ADC values of benign nodules (P < 0.0001).
The ADCMIN, ADCMEAN, ADCMAX values of malignant nodules were calculated as 0.789 × 10⁻³ mm2/s, 1.027 × 10⁻³ mm2/s, and 1.263 × 10⁻³ mm2/s, respectively at b:1000. The ADCMIN, ADCMEAN, ADCMAX values of benign nodules were calculated 1.454 × 10⁻³ mm2/s, 2.022 × 10⁻³ mm2/s, and 1.714 × 10⁻³ mm2/s, respectively at b:1000. The mean ADC values of malignant nodules at b:1000 were significantly lower than mean ADC values of benign nodules (P < 0.0001) (Figures 2 - 4) (Table 2).
| Pathology of nodules | Number of nodules | Mean, ×10-3 mm2/s | Standard deviation | P valuea |
|---|---|---|---|---|
| ADCMIN b500 | < 0.000 | |||
| Malignant | 13 | 1.092 (0.481 - 1.995) | 0.554 | |
| Benign | 63 | 1.892 (1.273 - 2.560) | 0.284 | |
| ADCMAX b500 | < 0.000 | |||
| Malignant | 13 | 1.692 (0.922 - 2.749) | 0.583 | |
| Benign | 63 | 2.474 (1.718 - 3.655) | 0.315 | |
| ADCMEAN b500 | < 0.000 | |||
| Malignant | 13 | 1.371 (0.706 - 2.272) | 0.545 | |
| Benign | 63 | 2.176 (1.505 - 2.988) | 0.285 | |
| ADCMIN b1000 | < 0.000 | |||
| Malignant | 13 | 0.789 (0.391 - 1.396) | 0.359 | |
| Benign | 63 | 1.454 (1.005 - 2.319) | 0.266 | |
| ADCMAX b1000 | < 0.000 | |||
| Malignant | 13 | 1.263 (0.663 - 2.133) | 0.472 | |
| Benign | 63 | 2.022 (1.468 - 3.375) | 0.360 | |
| ADCMEANb1000 | < 0.000 | |||
| Malignant | 13 | 1.027 (0.504 - 1.724) | 0.414 | |
| Benign | 63 | 1.714 (1.252 - 2.954) | 0.310 |
Abbreviations: ADC, apparent diffusion coefficient; MIN, minimum, MAX, maximum
aP < 0.05 indicates significant difference.
![Graph shows receiver operating characteristic (ROC) curves of nodule apparent diffusion coefficients (ADC) [mean, minimum and maximum ADCs] in two b values of 500 and 1000 used for differentiation of benign and malignant nodules.](https://services.brieflands.com/cdn/serve/3170b/9e27daa7757a7999dcc0ecc01ea7879266701b5c/iranjradiol-In_Press-In_Press-63974-i002-preview.webp "Graph shows receiver operating characteristic (ROC) curves of nodule apparent diffusion coefficients (ADC) [mean, minimum and maximum ADCs] in two b values of 500 and 1000 used for differentiation of benign and malignant nodules.")
Graph shows receiver operating characteristic (ROC) curves of nodule apparent diffusion coefficients (ADC) [mean, minimum and maximum ADCs] in two b values of 500 and 1000 used for differentiation of benign and malignant nodules.
. Axial T2 weighted MR image shows the nodule in the right thyroid lobe (A). The nodule has high signal intensity on diffusion weighted imaging (DWI) at b:1000 (B), and low signal intensity on apparent diffusion coefficient (ADC) map (C) with ADC<sub>MEAN</sub> value of 0.746 × 10<sup>-3</sup> mm<sup>2</sup>/s. The ADC<sub>MEAN</sub> value of thyroid parenchyma is measured as 1.951 × 10<sup>-3</sup> mm<sup>2</sup>/s and the nodule ADC<sub>MEAN</sub>/thyroid parenchyma ADC<sub>MEAN</sub> ratio is calculated as 0.38 at b:1000.")
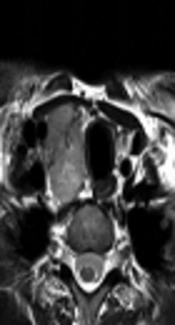
A 42-year-old man with a malignant nodule (histopathologically confirmed as medullary thyroid carcinoma). Axial T2 weighted MR image shows the nodule in the right thyroid lobe (A). The nodule has high signal intensity on diffusion weighted imaging (DWI) at b:1000 (B), and low signal intensity on apparent diffusion coefficient (ADC) map (C) with ADCMEAN value of 0.746 × 10⁻³ mm2/s. The ADCMEAN value of thyroid parenchyma is measured as 1.951 × 10⁻³ mm2/s and the nodule ADCMEAN/thyroid parenchyma ADCMEAN ratio is calculated as 0.38 at b:1000.
 weighted MR image shows multiple thyroid nodules in thyroid lobes. The nodule located in the left lobe has a central cystic colloidal component. Measurement of the nodule was performed from the peripheral solid component on apparent diffusion coefficient (ADC) map. ADC map at b:1000 (B) shows the ADC<sub>MEAN</sub> value of the solid component is 1.407 × 10<sup>-3</sup> mm<sup>2</sup>/s. The high signal intensity (increased diffusion) of the colloidal component (ADC: 2.682 × 10<sup>-3</sup> mm<sup>2</sup>/s) can also be seen.")
Hyperplastic nodule. Axial T2 (A) weighted MR image shows multiple thyroid nodules in thyroid lobes. The nodule located in the left lobe has a central cystic colloidal component. Measurement of the nodule was performed from the peripheral solid component on apparent diffusion coefficient (ADC) map. ADC map at b:1000 (B) shows the ADCMEAN value of the solid component is 1.407 × 10⁻³ mm2/s. The high signal intensity (increased diffusion) of the colloidal component (ADC: 2.682 × 10⁻³ mm2/s) can also be seen.
Receiver operating characteristic (ROC) curve analysis was performed to detect cut off values differentiating benign from malignant thyroid nodules. The area under the curve (AUC) for b:500 was measured as 0.85 at ADCMIN, 0.85 at ADCMEAN, and 0.83 at ADCMAX and as 0.91 at ADCMIN, 0.87 at ADCMEAN, and 0.86 at ADCMAX for b:1000 as shown in Figure 2.
The upper and lower limits of 95% confidence interval (CI) for b:500 was 0.71 - 0.99 at ADCMIN; 0.71 - 1.00 at ADCMEAN; 0.66 - 1.00 at ADCMAX. These limits were detected as 0.82 - 1.00 at ADCMIN; 0.72 - 1.00 at ADCMEAN and 0.71 - 1.00 at ADCMAX for b:1000.
Cut off values to differentiate malignant and benign nodules for ADCMIN, ADCMEAN, and ADCMAX were determined at b:500 and b:1000. According to the selected cut off values, the calculated sensitivity was 77%. The specificity, positive predictive value, and negative predictive value ranged between 88% - 100%, 58% - 100%, and 94% - 95%, respectively (Table 3).
| Cut off value, × 10-3 mm2/s | Sensitivity, % | Specificity, % | PPV, % | NPV, % | |
|---|---|---|---|---|---|
| ADCMIN b500 | 1.574 | 77 | 88 | 58 | 94 |
| ADCMEAN b500 | 1.728 | 77 | 96 | 83 | 95 |
| ADCMAX b500 | 1.910 | 77 | 98 | 90 | 95 |
| ADCMIN b1000 | 1.022 | 77 | 99 | 91 | 95 |
| ADCMEAN b1000 | 1.238 | 77 | 100 | 100 | 95 |
| ADCMAX b1000 | 1.455 | 77 | 100 | 100 | 95 |
Abbreviations: ADC, apparent diffusion coefficient; MIN, minimum, MAX, maximum; NPV, negative predictive value; PPV, positive predictive value
The average parenchymal ADC value could be measured in 25 patients and ADC value of 52 nodules was measured in these patients. Eleven (21%) of these 52 nodules were malignant. Nodule ADCMEAN/thyroid parenchyma ADCMEAN ratios were calculated. This ratio was significantly lower in malignant nodules compared to the benign nodules at b:500 and b:1000 (P < 0.0001) (Table 4).
ROC curve analysis was performed to detect the power of nodule ADCMEAN/thyroid parenchyma ADCMEAN ratio to differentiate benign and malignant nodules. The AUC was 0.99 for b:500 and was 1 for b:1000. The upper and lower limits of 95% CI was 0.98 – 1.00 for b:500, 1.00 - 1.00 for b:1000 as shown in Figure 5.
| Pathologic diagnosis | Number | Nodule ADCMEAN/thyroid parenchymal ADCMEAN ratio | Standard deviation | P valuea |
|---|---|---|---|---|
| b500 | 0.0001 | |||
| Malignant | 11 | 0.64 (0.35 - 0.98) | 0.202 | |
| Benign | 41 | 1.25 (0.93 - 1.68) | 0.200 | |
| b1000 | 0.0001 | |||
| Malignant | 11 | 0.59 (0.29 - 0.95) | 0.163 | |
| Benign | 41 | 1.29 (0.96 - 1.84) | 0.199 |
Abbreviation: ADC, apparent diffusion coefficient
aP < 0.05 indicates significant difference.
 curve of nodule mean apparent diffusion coefficient (ADC<sub>MEAN</sub>) /thyroid parenchyma ADC<sub>MEAN</sub> ratio used for differentiation of benign and malignant nodules. The area under the curve (AUC) was 0.99 for b:500 and was 1 for b:1000.")
Graph shows receiver operating characteristic (ROC) curve of nodule mean apparent diffusion coefficient (ADCMEAN) /thyroid parenchyma ADCMEAN ratio used for differentiation of benign and malignant nodules. The area under the curve (AUC) was 0.99 for b:500 and was 1 for b:1000.
Cut off values to differentiate malignant and benign nodules for the ratio of nodule ADCMEAN/thyroid parenchyma ADCMEAN were determined at b:500 and b:1000. According to the selected cut off values (0.98 for b:500 and 0.95 for b:1000) the calculated sensitivity and negative predictive value were 100%. The specificity, and positive predictive value ranged between 92% - 100%, and 79% - 100%, respectively (Table 5).
| Cut off value | Sensitivity, % | Specificity, % | PPV, % | NPV, % | |
|---|---|---|---|---|---|
| Nodule ADCMEAN/thyroid parenchyma ADCMEAN (b500) | 0.98 | 100 | 92 | 79 | 100 |
| Nodule ADCMEAN/thyroid parenchyma ADCMEAN (b1000) | 0.95 | 100 | 100 | 100 | 100 |
Abbreviations: ADC, apparent diffusion coefficient; NPV, negative predictive value; PPV, positive predictive value
5. Discussion
Thyroid nodules are frequently detected with the widespread application of sonography (15). However, the malignancy rate of palpable nodules is less than 5% (2). The primary goal of imaging is to determine the malignant nodules. MRI diffusion characteristics of thyroid lesions may help us to differentiate different types of thyroid nodules.
Diffusion is a random microscopic movement of water molecules. Measurement of diffusion in vivo is now possible with diffusion-weighted MRI and ADC measurements. The hypercellularity within malignant tumors leads to reduction in the diffusion space of water molecules in the extracellular and intracellular space (16-18). In recent years, DWI in the head and neck region and the thyroid gland has gained importance (2, 8-10, 13, 19-21). The malignant thyroid nodules when compared with the benign ones have larger nuclei and an increased number of cell counts resulting in a decreased extracellular matrix (22). Due to these tissue characteristics, there is restriction in movement of water molecules in malignant nodules resulting in findings of restricted diffusion, and low ADC values on DWI (2, 8, 10, 13). The difference in ADC values between benign and malignant nodules on 1.5 Tesla magnets has been demonstrated by other authors. Most of the studies demonstrated that the ADC values of benign thyroid nodules are significantly greater than those of malignant nodules (2, 8, 10). The b value has an impact on image quality and ADC measurement. A high b value image provides valuable diffusion data with restricted perfusion and T2-weighted effects. However, as the b value increases, the noise increases leading to distortion of the images (23). Image distortion due to susceptibility artifacts is prominant at higher field strength magnets. However, these limitations can be overcome by using parallel imaging, smaller voxel size and shorter echo times (11, 24, 25). In our study, to improve image quality, we performed DWI with parallel imaging (GRAPPA factor: 2), 4 mm slice thickness and 128 × 128 matrix size and obtained images without degradation. In literature, there are limited number of studies about thyroid nodules that have been performed on 3 Tesla magnets (13, 14). In a recent study conducted by Ilica et al., they used six b values, with the highest b value of 1500. The mean ADC values for benign and malignant nodules were 1.548 × 10⁻³ mm2/s, and 0.814 × 10⁻³ mm2/s respectively. The ADC values were significantly different among these groups (P < 0.001). Similarly in our study, we used high b values (b:500, b:1000) and the ADC values of 63 benign nodules were significantly higher than the 13 malignant nodules at both b levels (P < 0.000). The mean ADC value of the benign nodules was 2.022 × 10⁻³ mm2/s and the mean ADC of the malignant nodules was 1.027 × 10⁻³ mm2/s for b:1000 in the present study. Ilicaet al. reported the mean ADC value of the normal thyroid tissue as 1.323 ± 210 (× 10-3 mm2/s) in the healthy control group. This finding is similar with the ADC values of our healthy control group at b:1000 (1.350 ± 150 × 10-3 mm2/s) (13).
Despite the new automated measurement techniques, ADC values can vary between patients and within patients. For this reason, ADC measurements from unaffected tissues of patient groups were compared with each other and with the control group. Calculation of the normalized ADC values can eliminate the imaging related variability (21, 26). Bozgeyik et al. checked the normal looking parenchyma of patients with thyroid nodules. There were no significant difference between the ADC values of thyroid tissue in healthy subjects and the patient group with nodules (10). They reported that the thyroid parenchyma ADC values of the patient group can be regarded as a reference as control group (10). We could evaluate the average parencyhmal ADC value in 25 patients. ADC values obtained from the parenchyma fields were confirmed histopathologically as normal in these patients. Therefore, we think that the parenchyma ADC values of this patient group can be accepted as a reference for thyroid gland parenchyma. Similar to the study carried out by Bozgeyik et al. (10) in our study, no statistically significant difference was found between the normal parenchyma ADCMEAN of the patient and control group at b: 500 and b:1000. When we compared the parenchyma ADCMEAN values of the malignant, benign and control groups, we also found no difference between the three groups (Table 1). In our study, nodal ADCMEAN/thyroid parenchyma ADCMEAN ratios of malignant nodules were significantly lower than benign nodules in both b: 500 and b:1000 values and there was no overlap between these groups. In the analysis of the ROC curve showing the power of the ADCMEAN/thyroid parenchyma ADCMEAN ratio to differentiate benign and malignant nodules, the area under the curve was 0.99 for b:500 and 1 for b:1000. Sensitivity at thresholds determined by the curve was found to be 100% for both b:500 and b:1000 values. That is, the ADC ratio of all malignant nodules is below 0.98 at b:500 and below 0.95 at b:1000 and the specificity is 92% and 100% respectively at b:500, b:1000. According to these results, the use of the nodal ADCMEAN/thyroid parenchyma ADCMEAN ratio in distinction of malignant-benign thyroid nodules appears to be a very sensitive and specific method. The limitation of this method is multinodular goiter cases in which measurement of intact thyroid parenchyma may be difficult. Mutlu et al. normalized their measurements using the spine as a reference (21). However, the spinal cord is surrounded by spinal osseous elements, which can lead difficulty in measurements. According to our findings, the intact thyroid tissue of the patient can be used for normalization issues. Therefore, combination of normalized ADC values might be helpful in the interpretation of thyroid nodules and might determine the optimal ADC ratio for quantitative evaluation.
There are several limitations of the study. First, evaluation of nodules below 1 cm was not included in the study. Therefore, it is necessary to determine the accuracy of 3 Tesla diffusion MRI findings in this group of patients as well. Second, the sample size of malignant nodules was relatively small in our study group. A larger population would probably strengthen these findings and provide more information.
In conclusion, the findings of our study show that ADC values obtained with high b values at 3 T are beneficial in differentiation of benign and malignant thyroid nodules. Measurement of nodule ADCMEAN/thyroid parenchyma ADCMEAN ratio is a valuable adjunctive tool. Further large scale studies are mandatory to predict the clinical impact of 3 T DWI.
