

1. Background
Tumors of the sacrum are relatively rare entities, accounting for only 1% - 7% of overall clinical tumors of the spine (1, 2). The most common type of primary malignant tumor of the sacrum are sacral chordomas (SCs), which account for 50% of the primary sacral tumors (3). Giant cell tumors (GCTs), on the other hand, are the most common type of benign tumor of the sacrum (4). GCTs and other common primary tumors of the sacrum, including SCs and sacral schwannomas (SSs), have many clinical and conventional imaging similarities. These tumors often present with nonspecific complaints at early stages and are only found when the mass volume increases induced compression to the surrounding organs (2, 5). Preoperative diagnoses mainly rely on the medical imaging methods, such as X-ray, CT and MRI. Sacral GCTs and other tumors can display a combination of abdominal and posterior extensions, and often display as heterogeneous lesions with cystic areas, which can easily be confused by radiologists (5, 6).
CT is the preferred method for evaluating sacral lesions in case of suspected of sacral tumors based on clinical signs (6). Although some CT morphological features of sacral GCTs have been described in the literature, the assessment of enhanced CT characteristics of sacral GCTs have not been intensively evaluated.
2. Objectives
The purpose of our study was to find a new way to quantitatively evaluate the enhanced CT features of sacral GCTs and to compare these characteristics with those of other common primary tumors of the sacrum, namely, SCs and sacral SSs.
3. Patients and Methods
3.1. Patients
We retrospectively reviewed the data from 61 patients at our institution from January 2009 to February 2017; 20 patients presented with GCTs (16 women and 4 men), 22 patients with SCs (5 women and 17 men) and 19 patients with SSs (10 women and 9 men). The ethics committee of our research institution approved this retrospective study and waived the requirement for informed consent. The most common symptoms among all patients was lower lumbar or hip pain, which usually radiated to the perineum and/or thigh. Patients who had undergone previous surgeries, biopsies, chemotherapy, or radiation therapy were not included in our study. There were no local or distant metastases in any of the 61 enrolled patients, and the final diagnoses were confirmed by surgery or biopsy.
3.2. CT Protocols
All 61 patients underwent both non-contrast and contrast-enhanced CT scanning on a 16 slices spiral CT scanner (Sensation, Siemens, Erlangen, Germany) according to an established hospital protocol. Each scan covered the area from the iliac crest to the bottom of the pelvis. The scanning parameters were as follows: Section thickness/intervals = 2/3.0 mm; and reconstructed section thickness = 5 mm; tube voltage = 120 kV; and tube current = 200 mA. Iodine contrast material (300 mgL/mL), was injected intravenously at a rate of 4 ml/s within a dose of 2.0 mL/kg of body weight by using a high pressure injector. Then, 20 mL of saline was injected at the same rate immediately after to ensure complete delivery of the iodine. Two-phase enhancement CT images were acquired at the time intervals of 30 seconds (arterial phase) and 70 seconds (portal vein phase).
3.3. Imaging Analysis
Noncontrast images and two-phase contrast enhancement images were reviewed. The enhancement index (EI) of each mass was compared by the formula: EI(a/v) = [D(a/v) − D(pre)]/D(pre), where D(a/v) was the density of the lesion on the enhanced CT (a = arterial phase, approximately 30 seconds; v = portal vein phase, approximately 70 seconds), and D(pre) was the density of the lesion on the pre-enhanced images. Maximum enhancement was calculated by the formula: Emax = D(v) - D(pre). Two radiologists with 5 years of musculoskeletal imaging experience measured the attenuation values (Hounsfield unit, HU) of the solid part of each tumor. The measurements were conducted on the picture archiving and communication system (PACS) workstation. A circular region of interest (ROI) was placed in each mass, while carefully avoiding areas of bone, calcification, necrosis, and hemorrhage (ROI area range = 30 - 50 mm2). Each mass was measured three times, and the mean value was adopted. The size of each tumor was defined as the maximum diameter of the lesion. Each observer was blinded to the pathological results at the time of the measurements and calculations.
3.4. Statistical Analysis
The parameters of the three groups in different phases were compared using One-way ANOVA analysis. All of the data from each group were evaluated with homogeneity variances test in advance. The Chi-square tests were used to determine if there were differences in the clinical and mass characteristics among the three groups. Positive predictive values, negative predictive values, sensitivity, specificity, and area under the receiver operator curve (AUC) were computed for each disease and compared with the pathological results. AUC values were classified as follows: 0.60 - 0.70, poor; 0.71 - 0.80, fair; 0.81 - 0.90, good; and 0.91 - 1.00, excellent. The data were analyzed by the SPSS 17.0 software package (SPSS Inc., Chicago, IL, USA), and the results were statistically significant when the P values was less than 0.05.
4. Results
The reviewers successfully evaluated the images from all of the patients, with no images considered uninterpretable. The data are shown in Table 1. There was a significant difference in age among the three groups of tumor (F = 13.531, P < 0.001). SCs were more prevalent in middle-aged and elderly people (mean ± standard deviation [SD]: 56.77 ± 9.51 years), while GCTs (mean ± SD: 38.85 ± 12.19 years) and SSs (mean ± SD: 44.8 ± 12.56 years) were more prominent in young adults and middle-aged people. Some CT features among the three groups of tumors were significantly different: Location in the upper sacrum (above S3) and eccentric bone destruction were more common with GCTs, while SCs usually occurred in the midline lower sacral vertebrae (below S3) (Figure 1). Multiple and small cystic areas were found in SCs (36.4%) and GCTs (65%), while larger centrally located cystic areas were observed in all SSs (73.7%). Tumors extending toward the pelvic cavity were common, particularly those with a large mass. Invasion of the spinal canal was present with GCTs (75%), SCs (33.3%) and SSs (78.9%) (Figure 2H). Histologically, GCTs contained many large multinucleated giant cells and scattered mononuclear cells (Figure 1D). SSs were consisted of oval cells with central nuclei and vacuolated cytoplasm embedded in an eosinophilic myxomatous stroma (Figure 1H). SCs consisted of many classical Schwannoma cells (Figure 1L).
| Parameter | GCTs, % | SCs, % | SSs, % | P value |
|---|---|---|---|---|
| Age, y | 38.85 ± 12.19 | 56.77 ± 9.51 | 44.8 ± 12.56 | 0.000 |
| Gender | 0.001 | |||
| Male | 4 (20) | 17 (77.3) | 9 (47.4) | |
| Female | 16 (80) | 5 (22.7) | 10 (52.6) | |
| Location | 0.006 | |||
| Upper sacrum (above S3) | 17 (85) | 5 (22.7) | 9 (47.4) | |
| Lower sacrum (below S3) | 3 (15) | 17 (77.3) | 10 (52.6) | |
| Tumor size, cm | 6.84 ± 2.15 | 8.28 ± 2.72 | 8.62 ± 3.24 | 0.100 |
| Internal cyst | 0.002 | |||
| Present | 13 (65) | 5 (22.7) | 14 (73.7) | |
| Absent | 7 (35) | 17 (77.3) | 5 (26.3) | |
| Internal calcification | 0.000 | |||
| Present | 1 (5) | 2 (9) | 10 (52.6) | |
| Absent | 19 (95) | 20 (91) | 9 (47.4) | |
| Total | 20 | 22 | 19 |
Clinical and CT Characteristics of Giant Cell Tumors (GCTs), Sacral Chordomas (SCs) and Sacral Schwannomas (SSs)a
![Giant cell tumor (GCT) in a 22-year-old female. The mass was located in the upper sacral vertebra, expanding toward the periphery (A - D). Histopathology (Hematoxylin and eosin [H & E], staining ×10) showed osteoclast-type giant cells and mononuclear cells (D). Sacral chordoma (SC) in a 39-year-old male. The mass was located in the midline lower sacral vertebra (S3 - S5). Residual bone can be seen in the tumor (pink arrow) (E - H). Histopathology showed a hyalinized extracellular matrix with myxoid regions and typical chordoma cells (H). A 50-year-old female with a sacral schwannoma (SS). The mass was located centrally in the upper sacral vertebra (S1-S3). Calcification can be seen in the tumor (yellow arrow). Central cystic areas were not enhanced (red arrow) (I - L). Histopathology showed that the tumors consisted of schwannoma cells (L). Axial CT precontrast scan (A, E, I), arterial phase enhancement (B, F, J), portal venous phase enhancement(C, G, K).](https://services.brieflands.com/cdn/serve/314ad/2ea6d33407ab788bfe4bf8c3e1a3b7dd1a139f47/iranjradiol-16-1-66372-i001-preview.png "Giant cell tumor (GCT) in a 22-year-old female. The mass was located in the upper sacral vertebra, expanding toward the periphery (A - D). Histopathology (Hematoxylin and eosin [H & E], staining ×10) showed osteoclast-type giant cells and mononuclear cells (D). Sacral chordoma (SC) in a 39-year-old male. The mass was located in the midline lower sacral vertebra (S3 - S5). Residual bone can be seen in the tumor (pink arrow) (E - H). Histopathology showed a hyalinized extracellular matrix with myxoid regions and typical chordoma cells (H). A 50-year-old female with a sacral schwannoma (SS). The mass was located centrally in the upper sacral vertebra (S1-S3). Calcification can be seen in the tumor (yellow arrow). Central cystic areas were not enhanced (red arrow) (I - L). Histopathology showed that the tumors consisted of schwannoma cells (L). Axial CT precontrast scan (A, E, I), arterial phase enhancement (B, F, J), portal venous phase enhancement(C, G, K).")
Giant cell tumor (GCT) in a 22-year-old female. The mass was located in the upper sacral vertebra, expanding toward the periphery (A - D). Histopathology (Hematoxylin and eosin [H & E], staining ×10) showed osteoclast-type giant cells and mononuclear cells (D). Sacral chordoma (SC) in a 39-year-old male. The mass was located in the midline lower sacral vertebra (S3 - S5). Residual bone can be seen in the tumor (pink arrow) (E - H). Histopathology showed a hyalinized extracellular matrix with myxoid regions and typical chordoma cells (H). A 50-year-old female with a sacral schwannoma (SS). The mass was located centrally in the upper sacral vertebra (S1-S3). Calcification can be seen in the tumor (yellow arrow). Central cystic areas were not enhanced (red arrow) (I - L). Histopathology showed that the tumors consisted of schwannoma cells (L). Axial CT precontrast scan (A, E, I), arterial phase enhancement (B, F, J), portal venous phase enhancement(C, G, K).
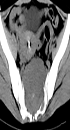
 in a 36-year-old woman. The images show that the mass was located in the eccentric upper sacrum. The precontrast mass CT value was 35 Hounsfield unit (HU), that in the arterial phase was 63 HU, and that in the venous phase was 75 HU. However, the cystic area was not enhanced (yellow arrow) (A - D). GCT in a 27-year-old man. The large mass occupied the entire sacrum, extending forward to the pelvic cavity and extending backward into the spinal canal (red arrow). The enhancement of the mass was clearly persistent across the arterial phase and the venous phase. The maximum enhancement was 80 HU (E - H). Axial CT precontrast scan (A, E), arterial phase enhancement (B, F), portal venous phase enhancement (C, G), coronal reconstruction image (D), and sagittal reconstruction image (H).")
Giant cell tumor (GCT) in a 36-year-old woman. The images show that the mass was located in the eccentric upper sacrum. The precontrast mass CT value was 35 Hounsfield unit (HU), that in the arterial phase was 63 HU, and that in the venous phase was 75 HU. However, the cystic area was not enhanced (yellow arrow) (A - D). GCT in a 27-year-old man. The large mass occupied the entire sacrum, extending forward to the pelvic cavity and extending backward into the spinal canal (red arrow). The enhancement of the mass was clearly persistent across the arterial phase and the venous phase. The maximum enhancement was 80 HU (E - H). Axial CT precontrast scan (A, E), arterial phase enhancement (B, F), portal venous phase enhancement (C, G), coronal reconstruction image (D), and sagittal reconstruction image (H).
On the noncontrast images, the densities of the SCs were lower than those of the GCTs and SSs (Figure 1A, E and I), but there was no difference between GCTs and SSs (P > 0.05). Calcification occurred more frequently in SSs (Figure 1I), but rarely appeared in SCs. Incomplete bony shells were only detected in SCs (Figure 1E). The cystic areas had uniformly low densities on CT plain scan images and without enhancement after contrast medium administration (Figures 1K and 2A - D). Varying degrees of enhancement were found in all of the cases (Figure 3). The enhancement index (EI) values of the lesions in every group at the different phases are shown in Table 2. In the arterial phase (30 seconds), the enhancement index of the arterial phase (EIa) of the GCTs was higher than those in the other two groups (P < 0.05), with the EIa of SCs being the lowest. In the venous phase (70 seconds), the EIv of the GCTs was higher than that in the arterial phase and was also highest among the three groups (P < 0.05). Differences in the EIa and enhancement index of the portal venous phase (EIv) were found among the GCTs, SCs, and SSs groups (P < 0.05), with the EIa and EIv of the SCs group being the lowest among the three groups. The Emax of GCTs was the highest among the three groups (P < 0.05). The positive predictive values (PPV) and negative predictive values (NPV) of four different parameters of the GCTs are shown in Table 3 and Figure 4. The predictive value of the Emax was notably higher than those of the other parameters. The area under the receiver operating characteristic (ROC) curve values of the precontrast, EIa, EIv and maximum enhancement (Emax) were: 0.684, 0.926, 0.898 and 0.955, respectively (Table 3 and Figure 4). From the above data, the optimal cut-off values for Emax was set at 46.5 Hounsfield unit (HU). Based on these cut-off values, the calculated sensitivity and specificity were highest among the four parameters.
| Parameter | AUC | Cutoff value | Sensitivity | Specificity | PPV, % | NPV, % |
|---|---|---|---|---|---|---|
| Precontrast | 0.678 | 38.50 (HU) | 0.85 | 0.537 | 47.22 | 88.00 |
| EIa | 0.950 | 0.6853 | 0.90 | 0.878 | 78.26 | 94.74 |
| EIv | 0.939 | 1.0326 | 0.95 | 0.805 | 70.37 | 97.06 |
| Emax | 0.964 | 46.50 (HU) | 0.95 | 0.878 | 79.17 | 97.29 |
Diagnosis Efficiency of CT Quantitative Parameters of Sacral Giant Cell Tumors
, A = arterial phase (red), V = portal venous phase (blue). (GCT, giant cell tumors; SC, sacral chordoma; SS, sacral Schwannoma).")
The CT values of the three groups. The arterial phase enhancement and portal venous phase enhancement of GCTs were higher than those of SSs and SCs. P = precontrast (black), A = arterial phase (red), V = portal venous phase (blue). (GCT, giant cell tumors; SC, sacral chordoma; SS, sacral Schwannoma).
. The area under the curve (AUC) values of the precontrast, EIa, EIv and Emax curve types were 0.684 (95% CI, 0.548 - 0.820), 0.926 (95% CI, 0.862 - 0.989), 0.898 (95% CI, 0.822 - 0.973) and 0.955 (95% CI, 0.904 - 1.000), respectively. (CI, confidence interval; EIa, enhancement index of the arterial phase; EIv, enhancement index of the portal venous phase; Emax, maximum enhancement).")
Comparison of the four different parameters of the Receiver operating characteristics (ROCs). The area under the curve (AUC) values of the precontrast, EIa, EIv and Emax curve types were 0.684 (95% CI, 0.548 - 0.820), 0.926 (95% CI, 0.862 - 0.989), 0.898 (95% CI, 0.822 - 0.973) and 0.955 (95% CI, 0.904 - 1.000), respectively. (CI, confidence interval; EIa, enhancement index of the arterial phase; EIv, enhancement index of the portal venous phase; Emax, maximum enhancement).
5. Discussion
Our work demonstrated a new way to quantitatively analyze the enhancement characteristics of sacral giant cell tumors. The enhancement CT parameters showed higher sensitivity and specificity in the diagnosis of the sacral GCTs than of SCs and SSs.
GCTs generally occur after skeletal maturation, peaking in the 30’s, with 80% of cases occurring between 20 and 50 years of age and a higher prevalence in females (7, 8). SCs are usually found in the 40 - 70 years old, and men are twice as likely as women to develop this type of tumor (9). SSs are more common in patients 20 to 50 years of age but has no significant age predominance (5). The ages of the patients were significantly different among the three tumor groups, which can aide in the differential diagnose of GCTs, SCs and SSs. In our study, GCTs occurred more frequently in females (80%), and SCs were more common in males (77.3%), with SSs being about equal in both. GCTs are typically eccentric, expansive, osteolytic lesions with no sclerotic margins or calcifications. In our study, GCTs more likely occurred in the upper sacrum (85%) while SCs generally arose in the lower sacral segments (the third, fourth, or fifth sacral vertebra) or on the midline or paramedian area of the sacrococcygeal region (77.3%). These findings were in accordance with those of previous studies (9-11) and can help in the differential diagnoses of GCTs and SCs.
CT has a superior density resolution to that of traditional X-ray imaging; in particular, thin-slice spiral CT scanning and three-dimensional computerized reconstruction can provide substantial help in showing details and calcification inside the tumor. In our study, internal calcifications were rare in GCTs and SCs, but appeared in SSs. Cysts rarely appeared in SCs but were commonly seen in GCTs and SSs and were usually small and found in multiples. Sometimes fluid–fluid levels could be found in GCTs; this may have been caused by the secondary changes in the aneurysmal bone cyst, which was accompanied in GCTs. Cyst formation, hemorrhage, and necrosis are relatively common in SSs (12). Previous studies have shown that SSs tend to have cystic changes (5, 13, 14). Histologically, these cystic areas are Antoni B areas (loose and hypocellular regions with more myxoid or edematous components). The Antoni B areas appear as hypo-dense on CT images (15).
On the noncontrast CT images, the densities of the GCTs were higher than those of SCs but were not significantly different from those of SSs. A previous study (16) measured the densities of GCTs between 20 to 70 HU, and found that densities below those values more likely indicated a cyst than an aneurysmal bone cyst (ABC).
In this study, a double-phase dynamic contrast enhancement was used to quantitatively assess the enhanement features of GCTs, SCs, and SSs in the arterial and venous phases. The enhancement parameters of GCTs, SCs, and SSs were compared in the different contrast-enhanced phases. In the arterial phase, different enhancements were found among the three tumor types, with GCTs showing far higher enhancement than the two other tumor types, and with SSs showing higher enhancement than SCs. The reason for this might be that GCTs are often hypervascular (17-19). GCTs in bones are associated with great vascularity, and are supported by the expression of vascular endothelial growth factors (20). Imaging contrast agents can flow into the tumor tissue in a shorter amount of time. In the portal venous phase, all the cases across the three groups appeared as gradually enhancement. The enhancement index of the GCTs was still higher than that of the SCs and SSs. GCTs and the other two tumors were all gradually enhanced, with varying degrees of enhancement. The Emax value of the GCTs was higher than those of the SSs and SCs. There was also a small amount of overlap among the EIa, EIv, and Emax values between GCTs and SSs. The Emax values had superior sensitivity and specificity for GCTs than for SCs and SSs. Based on this approach and the use ROC analysis, we defined Emax > 46.50 (HU) as the optimal cut-off values in predicting GCTs. The results of our study demonstrated that the Emax plays a very important role in the accuracy of the diagnosis of sacral GCTs compared with the roles of other contrast parameters.
There were some limitations that affected our current study. First, the number of patients that were included in this study was relatively small. More cases and multi-institutional studies are needed to further confirm our findings. Second, although we used contrast-enhanced CT to assess the features of GCTs, SCs and SSs, the calculation formula used may not be the perfect approach for evaluating the hemodynamics of tumors. MRI perfusion weighted imaging might be an accurate way to evaluate the angiogenesis of tumors (21). This method can be used to study the state of intratumoral vessels in the future. Third, we did not complete point-by-point analysis of the histopathologic changes in the GCTs with the strong enhancement areas.
In conclusion, sacral GCTs demonstrate distinctive features on enhanced CT compared to SCs and SSs. The enhancement characteristics of GCTs can be quantitatively analyzed by enhancement indexes (EIa and EIv) and Emax values. The Emax value of the GCTs was clearly higher than those of the other two tumor types. Quantitative analysis of the characteristics contrast-enhanced CT is a useful method for diagnosing sacral GCTs and can differentiate GCTs from SCs and SSs.
