


1. Background
The role of breast ultrasonography (US) is not limited to simply distinguishing malignant from benign tumors among breast lesions but has been rapidly expanded to use as an adjunct to mammography (1, 2). The most significant shortcoming of the use of breast US is that the performance and interpretation is subjective. Thus, the ultrasonographic breast imaging reporting and data system (BI-RADS) was developed to aid in the characterization of breast lesions using qualitative assessments of the lesion features in an image (3). Image features, such as shape, orientation, margin, echogenicity, posterior features, calcifications, and associated findings, have been used, which has been proven to be both effective and feasible in breast mass characterization by numerous studies (2, 4-6).
Computer-aided diagnosis (CAD) as an adjunct to breast US has been extensively developed using different breast imaging techniques to help improve radiologists’ diagnostic accuracy, particularly in distinguishing malignant from benign breast lesions. CAD, combined with breast US, could help radiologists improve their accuracy, sensitivity, and consistency in the diagnosis of breast tumors (7-10).
Several studies have compared the usefulness of a CAD system (S-Detect) as an adjunct to grayscale breast US (10-12). Computer-based analyses based on the morphological features of S-Detect may be very useful for improving the diagnostic performance of breast US (13). Additionally, S-Detect may be used as an additional diagnostic tool to improve the specificity of breast US in clinical practice and guide decision making for breast masses detected on US by dedicated breast radiologists (14). Even quantitative variables could be obtained using CAD.
2. Objectives
The aim of this study was to evaluate the usefulness of a CAD system as an adjunct to breast US by comparing the diagnostic performance of the BI-RADS descriptors and quantitative variables in US and CAD.
3. Patients and Methods
3.1. Patients
This prospective study was approved by our Institutional Review Board (Seoul St. Mary’s Hospital, The Catholic University of Korea, KC16RISI0439), and all enrolled women provided written informed consent.
Between October 2015 and December 2016, four experienced readers (breast radiologists with greater than 4 years of breast imaging experience) performed breast US examinations using a US device (Samsung Ultrasound RS80A, Samsung Medison Co. Ltd., Seoul, Korea) with CAD (S-Detect) for screening or diagnostic purposes. Each patient was assessed by only one radiologist, according to the original schedule of the institution.
All suspicious or probable benign breast lesions were analyzed according to the BI-RADS lexicons and categories; therefore, lesions with BI-RADS categories of 3, 4, or 5 were included. Known postoperative changes and typical multiple BI-RADS category 2 lesions were excluded in this study.
3.2. Imaging Analyses and Management Planning
When using this US device, the images were first analyzed according to the BI-RADS lexicon and categories per the usual procedure. The result of this analysis was defined as breast US.
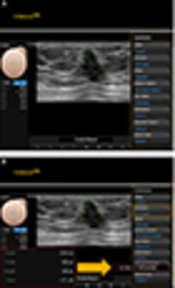
Then, CAD (S-Detect) was simultaneously added. A region-of-interest (ROI) was drawn along the border of the mass either automatically by the CAD program. Several drawn borders were presented on the screen of the US, and the radiologist who performed the breast US selected the most appropriate border of the picture. The lesions were automatically analyzed according to the features on the US according to the BI-RADS lexicon and final assessment categories. In this system (S-Detect), the final assessment classification was divided into ‘possibly benign’ and ‘possibly malignant’. The CAD program applies a novel feature extraction technique and support vector machine classifier that classifies breast lesions as benign or malignant according to the US BI-RADS lexicons (15). The result of this analysis was defined as CAD. Quantitative variables (width, height, height/width (H/W) ratio, area, and depth) were automatically obtained in this CAD system (Figure 1). Then, the proper combined decision was chosen subjectively based on the US with CAD results, which was defined as the subjective combination.
 (S-Detect) images for this study. These figures demonstrate that the breast lesion is classified automatically by the S-Detect program, and a final assessment is produced. The quantitative values are automatically obtained (A). Using obtained height and width (H/W) could be calculated (B) by readers. This lesion is confirmed as invasive breast carcinoma.")
Representative computer aided diagnosis (CAD) (S-Detect) images for this study. These figures demonstrate that the breast lesion is classified automatically by the S-Detect program, and a final assessment is produced. The quantitative values are automatically obtained (A). Using obtained height and width (H/W) could be calculated (B) by readers. This lesion is confirmed as invasive breast carcinoma.
Per the standard routine, US-guided 14-gauge core-needle biopsy was performed for all suspicious lesions (above category 4) based on US examination results. In case of probable benign lesions (category 3), some were confirmed by core-needle biopsy, and some were followed up by US. When the core-needle biopsy results were borderline or indicated malignancy, surgery (including excisional biopsy) was performed as per the usual practice in our institution. Borderline lesions are breast lesions with an increased risk of breast cancer development or more severe pathology near or associated with the lesion. Atypical ductal hyperplasia (ADH), lobular neoplasms (atypical lobular hyperplasia, lobular carcinoma in situ) radial scars, papillary neoplasms, flat epithelial atypia (FEA), and mucocele-like lesions were considered borderline breast lesions (16, 17).
If borderline lesions were determined to be malignant according to surgical findings, the final pathology was defined as the final surgical result.
3.3. Data and Statistical Analyses
First, we obtained each BI-RADS descriptor (i.e., shape, orientation, margin, echo pattern, and posterior features) in both breast US and CAD of 521 lesions. We obtained BI-RADS final assessment categories of image variables, including US, CAD, and the subjective combination of US with CAD. For the subjective combination, each reader chose the appropriate decision subjectively, based on grayscale US with CAD. We also evaluated the size (longest length) on US and determined the width, height, H/W ratio, area, and depth in CAD as quantitative variables.
Second, the diagnostic performance, including the area under the receiver operating characteristic (ROC) curve (AUC), sensitivity, specificity, positive predictive value (PPV), and negative predictive value (NPV), of the image variables, including US, CAD, and the subjective combination of US with CAD, was calculated. Later, we assessed the conjunctive and disjunctive combined results of the final assessment category of US and CAD. For conjunctive combinations, “not suspicious” on both grayscale US (category 3) and CAD (possibly benign) was defined as negative, and “suspicious” on either grayscale US (above category 4) or CAD (possibly malignant) was defined as a positive image. For disjunctive combinations, “not suspicious” on either grayscale US or CAD was defined as negative, and “suspicious” on the both grayscale US and CAD was defined as positive.
Then, the AUC, cut-off points, sensitivity, specificity, PPV and NPV were calculated to determine the accuracy of the quantitative variables measured by CAD. The optimal cutoff point was determined using ROC curve analysis with the Youden index. The best cut-off values were selected to provide optimal sensitivity and specificity. Additionally, we assessed the conjunctive and disjunctive combined results of the final assessment category and quantitative variables in CAD.
We assessed the diagnostic performance of each BI-RADS descriptor in US and CAD.
In addition, we evaluated the agreement between the descriptors in US and those in CAD. Agreement between the BI-RADS descriptors in US and those in CAD was examined using the coefficient for inter-rater agreement (Cohen kappa). The interpretation was based on the following five scales: poor (less than 0.2), fair (0.21 to 0.4), moderate (0.41 to 0.60), good (0.61 to 0.80), and very good (0.81 to 1.00) (18).
Finally, we evaluated the consistency between the orientations in the grayscale breast US and the H/W ratio in CAD. Because, the H/W ratio on CAD is directly correlated with the orientation in grayscale breast US.
Statistical analysis was performed using the Statistical Package for the Social Sciences (SPSS) Statistics software 24.0 (IBM Corp, Armonk, New York). A P value less than 0.05 was considered statistically significant.
4. Results
All 432 consecutive women (mean age, 48.6 ± 11.7 years) with 521 breast lesions were enrolled and underwent US and CAD. The mean size of the breast lesions was 1.2 ± 0.8 cm (range, 0.2 to 4.8 cm).
The characteristics of the patients and lesions are described in Table 1.
| Variable | Valuea |
|---|---|
| Total | 521 |
| Age, y | |
| Mean ± SD | 48.6 ± 11.7 |
| Median (range) | 48 (20 - 86) |
| Screening or diagnostic | |
| First screening | 36 (6.9) |
| Second or more screening | 206 (39.5) |
| Postoperative surveillance | 98 (18.8) |
| Probable benign follow-upb | 119 (22.8) |
| Diagnostic | 62 (11.9) |
| Symptom | |
| No | 442 (84.8) |
| Palpable (self-exam) | 66 (12.7) |
| Palpable (clinical exam) | 6 (1.2) |
| Pain | 2 (0.4) |
| Discharge (serous) | 3 (0.6) |
| Discharge (blood) | 2 (0.4) |
| Family or past history | |
| No | 413 (79.3) |
| First-degree relative | 10 (1.9) |
| Personal historyc | 98 (18.8) |
| Menopausal status | |
| Premenopausal state | 298 (57.2) |
| Postmenopausal state | 223 (42.8) |
| Pathology | |
| Benign | 407 (78.1) |
| Borderlined | 35 (6.7) |
| Malignancy | 79 (15.2) |
| Size (longest length), cm | |
| Mean ± SD | 1.2 ± 0.8 |
| Median (range) | 1 (0.2 - 4.8) |
Abbreviation: SD, standard deviation.
a Values are expressed as No. (%) or mean ± SD.
b Probable benign follow-up includes 17 palpable lesions.
c Personal history includes previous breast cancer or borderline lesion.
d Borderline breast lesions include atypical ductal hyperplasia (ADH), lobular neoplasms (atypical lobular hyperplasia, lobular carcinoma in situ), radial scars, papillary neoplasms, flat epithelial atypia (FEA), and mucocele-like lesions.
Of the 521 breast lesions, 79 (15.2%) lesions were pathologically confirmed as malignant by core-needle biopsy and surgery, including 56 invasive ductal carcinomas, 11 ductal carcinomas in situ, 8 mucinous carcinomas, 2 invasive lobular carcinomas, and 2 papillary carcinomas.
Borderline or benign lesions confirmed by core-needle biopsy or surgery and lesions unchanged for more than 2 years were defined as non-malignant in this study. Thirty-five (6.7%) lesions were confirmed as borderline by core-needle biopsy and surgery, including 18 papillary neoplasms, 10 atypical ductal hyperplasias, 2 flat epithelial atypias, 2 radial scars, 2 phyllodes tumors, and 1 mucocele-like lesion. The remaining 407 (78.1%) breast lesions were histologically diagnosed as benign or unchanged for more than 2 years, including 88 fibroadenomas; 72 fibrocystic changes; 9 hyperplasias; 7 stromal fibrosis; 5 fat necrosis; 3 inflammations; 2 of each adenosis, duct ectasias, fibrosis; 1 each of hamartoma, intramammary lymph node, and parasite; and 212 unchanged lesions for greater than 2 years. The diagnostic performance of the image variables according to the final assessment category is provided in Table 2. The subjective and disjunctive combination of US with CAD exhibited the highest AUC (0.83), followed by US (0.82) and CAD (0.78). The AUC, sensitivity, specificity, PPV and NPV of US were 0.82, 95%, 69%, 36%, and 99%, respectively. The AUC, sensitivity, specificity, PPV and NPV of CAD were 0.78, 78%, 78%, 39%, and 95%, respectively. CAD exhibited a lower sensitivity (78% vs. 95%) and NPV (95% vs. 99%) and a higher specificity (78% vs. 69%) and PPV (39% vs. 36%) than US. When CAD was subjectively and disjunctively combined with breast US, the specificity was significantly improved (P < 0.05).
| Variable | AUC | Sensitivity | Specificity | PPV | NPV |
|---|---|---|---|---|---|
| Breast US (US) (cut-off: Category 4) | 0.82 | 95 | 69 | 36 | 99 |
| CADa of US (CAD) (cut-off: Possibly malignant) | 0.78 | 78 | 78 | 39 | 95 |
| Subjective combinationb (US + CAD) | 0.83 | 98 | 72 | 38 | 99 |
| Conjunctive combinationc (US + CAD) | 0.77 | 96 | 58 | 29 | 99 |
| Disjunctive combinationd (US + CAD) | 0.83 | 77 | 89 | 55 | 96 |
| Size, longest length (cut-off: 0.97) | 0.66 | 75 | 54 | 23 | 92 |
| Width in CAD (cut-off: 0.86) | 0.65 | 77 | 50 | 21 | 92 |
| Height in CAD (cut-off: 0.64) | 0.76 | 77 | 67 | 29 | 94 |
| H/W ratio in CAD (cut-off: 0.55) | 0.75 | 91 | 48 | 24 | 97 |
| Area in CAD (cut-off: 0.46) | 0.71 | 68 | 66 | 27 | 92 |
| Depth in CAD (cut-off: 0.98) | 0.55 | 87 | 27 | 18 | 92 |
| Conjunctive combinationc (CAD + height) | 0.73 | 87 | 59 | 27 | 96 |
| Disjunctive combinationd (CAD + height) | 0.77 | 68 | 85 | 45 | 94 |
| Conjunctive combination (CAD + H/W ratio) | 0.69 | 96 | 42 | 23 | 96 |
| Disjunctive combination (CAD + H/W ratio) | 0.79 | 73 | 84 | 45 | 95 |
Abbreviations: AUC, area under the receiver operating characteristic curve; CAD, computer-aided diagnosis; H/W, height/width; NPV, negative predictive value; PPV, positive predictive value; US, ultrasonography.
a In CAD (S-Detect), the final assessments were dichotomized as follows: Possibly benign and possibly malignant.
b Subjective combination: The appropriate decision was chosen subjectively, based on grayscale US with CAD.
c Conjunctive combination: Negative, not suspicious using both systems; positive, suspicious using either system.
d Disjunctive combination: Negative, not suspicious using either system; positive, suspicious using both systems.
The AUC was calculated to determine the accuracy of the quantitative variables measured by CAD (Table 2). The AUCs for size, width, height, H/W ratio, area, and depth were 0.66, 0.65, 0.76, 0.75, 0.71 and 0.55, respectively (Figure 2). For all quantitative variables, the height (cut-off = 0.64) and H/W ratio (cut-off = 0.55) exhibited the highest AUC (0.76 and 0.75), and the H/W ratio exhibited the highest sensitivity (90%).
 curves for quantitative variables in computer aided diagnosis (CAD) (S-Detect). ROC curves for size (A), width (B), height (C), height/width (H/W) ratio (D), area (E), and depth in CAD (F) (AUC, area under the receiver operating characteristic curve).")
Receiver operating characteristic (ROC) curves for quantitative variables in computer aided diagnosis (CAD) (S-Detect). ROC curves for size (A), width (B), height (C), height/width (H/W) ratio (D), area (E), and depth in CAD (F) (AUC, area under the receiver operating characteristic curve).
The conjunctive combinations of final assessment and quantitative variables (height and H/W ratio) in CAD exhibited a higher sensitivity (87% vs. 77%, and 96% vs. 91%) than quantitative variables alone, respectively. The disjunctive combinations of final assessment and quantitative variables (height and H/W ratio) in CAD exhibited higher specificity (85% vs. 67%, and 84% vs. 48%) and PPV (45% vs. 29%, and 45% vs. 24%) than quantitative variables alone, respectively.
Table 3 presents the diagnostic performance, including the PPV, of the BI-RADS descriptors in US and CAD. The not-parallel orientation descriptor in US and CAD exhibited a consistent and even high AUC (0.6 vs. 0.6) and PPV (40% vs. 40%).
| Variable | AUC | Sensitivity | Specificity | PPV | NPV |
|---|---|---|---|---|---|
| Breast US | |||||
| Shape | |||||
| Oval | 0.26 | 29 | 23 | 6 | 65 |
| Round | 0.5 | 5 | 95 | 15 | 85 |
| Irregular | 0.74 | 66 | 82 | 39 | 93 |
| Orientation | |||||
| Parallel | 0.4 | 73 | 7 | 12 | 60 |
| Not-parallel | 0.6 | 27 | 93 | 40 | 88 |
| Margin | |||||
| Circumscribed | 0.21 | 11 | 30 | 3 | 66 |
| Indistinct | 0.55 | 23 | 87 | 23 | 86 |
| Angular | 0.54 | 11 | 96 | 32 | 86 |
| Microlobulated | 0.66 | 43 | 89 | 40 | 90 |
| Spiculated | 0.55 | 11 | 99 | 60 | 86 |
| Echogenicity | |||||
| Anecho | 0.48 | 1 | 94 | 4 | 84 |
| Hyper | 0.49 | 0 | 98 | 0 | 85 |
| Complex | 0.5 | 3 | 97 | 12 | 85 |
| Hypo | 0.57 | 73 | 41 | 18 | 90 |
| Iso | 0.43 | 11 | 74 | 7 | 82 |
| Hetero | 0.53 | 11 | 95 | 31 | 86 |
| CAD (S-detect) | |||||
| Shape | |||||
| Oval | 0.32 | 25 | 38 | 7 | 74 |
| Round | 0.48 | 1 | 94 | 4 | 84 |
| Irregular | 0.7 | 73 | 67 | 29 | 93 |
| Orientation | |||||
| Parallel | 0.4 | 73 | 7 | 12 | 60 |
| Not-parallel | 0.6 | 27 | 93 | 40 | 88 |
| Margin | |||||
| Circumscribed | 0.29 | 22 | 37 | 6 | 72 |
| Indistinct | 0.56 | 27 | 86 | 26 | 87 |
| Angular | 0.5 | 1 | 99 | 25 | 85 |
| Microlobulated | 0.6 | 38 | 81 | 27 | 88 |
| Spiculated | 0.55 | 13 | 96 | 38 | 86 |
| Echogenicity | |||||
| Anecho | 0.48 | 3 | 93 | 6 | 84 |
| Hyper | 0.49 | 0 | 99 | 0 | 85 |
| Complex | 0.51 | 4 | 98 | 27 | 85 |
| Hypo | 0.6 | 82 | 39 | 19 | 92 |
| Iso | 0.42 | 11 | 73 | 7 | 82 |
| Hetero | 0.49 | 0 | 99 | 0 | 85 |
Abbreviations: AUC, area under the receiver operating characteristic curve ; BI-RADS, Breast Imaging Reporting and Data System; CAD, computer-aided diagnosis ; NPV, negative predictive value; PPV, positive predictive value; US, ultrasonography.
According to the concordance analysis regarding each descriptors and categories between US and CAD, orientations, shapes, and echogenicities exhibited moderate agreement (kappa = 0.57, 0.51, and 0.44, respectively). The margins, posterior features, and final categories exhibited fair agreement (kappa = 0.38, 0.38, and 0.37, respectively) (Table 4).
| Lexicon | Kappa statistics | Agreement |
|---|---|---|
| Shape | 0.51 (0.43 - 0.58) | Moderate |
| Orientation | 0.57 (0.44 - 0.69) | Moderate |
| Margin | 0.38 (0.31 - 0.45) | Fair |
| Echogenicity | 0.44 (0.36 - 0.51) | Moderate |
| Posterior feature | 0.38 (0.28 - 0.48) | Fair |
| Final assessment category | 0.37 (0.27 - 0.46) | Fair |
Abbreviations: CAD, computer-aided diagnosis; US, ultrasonography.
The mean H/W ratios of parallel orientations and non-parallel orientations were significantly different in both US (0.6 ± 0.1 vs. 0.9 ± 0.2, P < 0.05) and CAD (0.6 ± 0.2 vs. 0.9 ± 0.2, P < 0.05) (Table 5).
| H/W ratio | Parallel | Not-parallel | P value |
|---|---|---|---|
| Orientation in breast US | < 0.001 | ||
| N | 469 | 52 | |
| Mean ± SD | 0.6 ± 0.1 | 0.9 ± 0.2 | |
| Median (range) | 0.56 (0.19 - 1.04) | 0.88 (0.38 -1.49) | |
| Orientation in CAD | < 0.001 | ||
| N | 468 | 53 | |
| Mean ± SD | 0.6 ± 0.2 | 0.9 ± 0.2 | |
| Median (range) | 0.6 (0.19 - 1.21) | 0.86 (0.57 - 1.49) |
Abbreviations: CAD, computer-aided diagnosis; H/W, height/width; SD, standard deviation; US, ultrasonography.
5. Discussion
The high degree of accuracy of breast US in differentiating between benign and malignant lesions has been clearly demonstrated (19). As a result, ultrasonographic evaluation was included in the classification of breast masses in the 2003 edition of American College of Radiology (ACR) breast imaging reporting and data system (BI-RADS®) (20).
In 2013, the fifth edition of BI-RADS was released (3). Shapes, orientations, margins, echo patterns, posterior features, and calcifications are included in the lesion descriptions of breast masses detected on breast US. Certain features, including an irregular shape, microlobulated or spiculated margins, and a width-to-anteroposterior (AP) dimension ratio of 1.4 or less, suggest malignancy (21).
Despite the excellent performances reported using the ultrasonographic BI-RADS, the final assessments made for breast masses by different performers vary significantly, mostly due to the multiple BI-RADS ultrasonographic descriptors used for describing breast lesions and the subjectiveness of US (4, 5). To increase the diagnostic accuracy of breast US, several additional ultrasonographic techniques have been developed and applied in clinical practice, such as elastography, automated breast US, and CAD systems (22). Among these additional imaging modalities, CAD systems enable efficient interpretation, in which consistent improved accuracy can be expected (22).
S-Detect is a recently developed CAD system for breast US that provides assistance in the morphological analysis based on the BI-RADS lexicon and the final assessment (14). S-Detect exhibits a significantly higher specificity, PPV, AUC and accuracy than radiologists (all P < 0.05) (14, 23). In a recent study, the AUC, sensitivity, specificity, PPV, and NPV of S-Detect were 0.73, 79%, 66%, 58%, and 84% (14). We assessed the diagnostic performance, including the AUC, sensitivity, specificity, PPV, and NPV, of the BI-RADS descriptors, categories, and quantitative variables.
In this study, the AUC, sensitivity, specificity, PPV and NPV of US vs. CAD were 0.82 vs. 0.78, 95% vs. 78%, 69% vs. 78%, 36% vs. 39%, and 99% vs. 95%, respectively. CAD exhibited a higher specificity (78% vs. 69%) and PPV (39% vs. 36%) than US. The AUC, sensitivity, specificity, PPV and NPV of the subjective combination of US with CAD were 0.83, 95%, 72%, 38%, and 99%. The subjective and disjunctive combination of US with CAD showed the highest AUC. When CAD was subjectively and disjunctively combined with breast US, the specificity was significantly improved (P < 0.05). The diagnostic performance of each quantitative variable of CAD could not be better than that of the final assessment category that combined the entire lexicon. However, the height and H/W ratio exhibited the greatest AUC (0.76, 0.75) among all descriptors and quantitative variables. The H/W ratio exhibited the highest sensitivity (91%) among all descriptors and quantitative variables. Orientation in US is directly correlated with the H/W ratio in CAD; therefore, we analyzed orientation because it is an important factor. When combining CAD with quantitative variables (height and H/W ratio), no significant improvement was observed in the diagnostic performance. However, the sensitivities were improved for conjunctive combinations. The specificities and PPVs were improved for disjunctive combinations.
Although the PPV obtained for lesions with a final assessment category of 4 according to the US BI-RADS criteria is consistent with previous studies, the percentage of malignant lesions varied, ranging from 16.2% to 60% (5, 19, 24-26). This variation is probably due to sample heterogeneity and different interpretations of lesions that should be classified into categories 4 and 5 (24). Thus, we aimed to analyze the PPVs of each BI-RADS descriptor and quantitative variable in this study. Among the BI-RADS descriptors, a spiculated margin was the most important covariate for diagnosis (27). The PPVs of a spiculated margin as a single factor in US and CAD were 60% and 38% and depended on the modality. A not-parallel orientation was the second most important descriptor (27). The PPVs of a not-parallel orientation as a single factor in US and CAD were both 40%.
According to the concordance analysis, the orientations, shapes, and echogenicities exhibited moderate agreement (kappa = 0.57, 0.51, and 0.44, respectively). The margins, posterior features, and final categories exhibited fair agreement (kappa = 0.38, 0.38, and 0.37). By performing an interobserver variability analysis in the recent study, substantial agreement was observed for lesion orientation and shape (kappa = 0.61 and 0.66). Moderate agreement was observed for lesion margins and posterior features (kappa = 0.40 for both). Fair agreement was observed for lesion echo patterns (kappa = 0.29) (19). Other studies have demonstrated that the margin was the most important factor, but high variability exists across studies (1, 19). In general, the determination of parallel or not-parallel orientation to the skin of the mass can be easily assessed, which explains the relatively robust interobserver variability (1). In our study, the orientation was a consistent factor, and we could obtain the H/W ratio, which is one of the accurate quantitative variables in CAD.
In addition, the mean H/W ratios of parallel and not-parallel orientations were significantly different in both grayscale US (0.6 ± 0.1 vs. 0.9 ± 0.2, P < 0.05) and CAD (0.6 ± 0.2 vs. 0.9 ± 0.2, P < 0.05) (Table 5). Therefore, the orientation and H/W ratio were particularly useful in both grayscale US and CAD. Additionally, we determined that readers perceive a not-parallel orientation of the lesion when the H/W ratio is approximately 0.9 or higher.
Our study had some limitations. First, for CAD to analyze a lesion, a radiologist must first identify the breast lesion, which can differ based on the experience of the radiologist. In this study, the four readers had similar levels of experience to reduce reader dependency. Second, we did not include calcifications or non-mass lesions in the analysis due to the lack of detection of these cases on US during the study period. This situation may differ from CAD applications in clinical practice. Third, the small number of malignant lesions (75 of 521) and the disparity between the number of malignant and benign lesions might be influenced the results. Fourth, a biopsy was performed for lesions that were suspicious on US as usual practice; therefore, lesions that were suspicious only on CAD or according to the quantitative value were not biopsied but were followed up only by breast US in this study.
In conclusion, we can obtain the BI-RADS descriptors, categories, and accurate quantitative variables in CAD. The combined CAD and US results showed the greatest diagnostic performance. When CAD was subjectively and disjunctively combined with breast US, the specificity was significantly improved. Additionally, the orientation and H/W ratio are consistent key factors that could be used to differentiate benign from malignant lesions using both US and CAD.
