


1. Background
Elasticity is a condition that manifests as tissue stiffness indicating the biological and mechanical properties of the tissue (1). Shear wave elastography (SWE) is a novel In vivo imaging technique based on the principle that shear waves move faster in hard tissue and their velocities can be measured (2). The short acoustic pushing pulse generated by SWE produces a displacement and measurable velocity (m/sec) at the target organ (3). The pushing pulse leads to a high velocity by causing less displacement in hard tissues, whereas it causes a low velocity in soft tissues; therefore, tissue stiffness can be measured quantitatively with SWE (4). The most important advantages of SWE are that it is a non-invasive technique, as it allows for the simultaneous evaluation of the ultrasonography (US) device, which performs a B-mode and Doppler examination and is not operator-dependent, as dynamic compression is not required (5-7). The studies investigating the pathology of the liver and pancreas reported that it was significant to assess elasticity with SWE (6, 8, 9). Today, the elasticity of the placenta can be measured by the SWE technique.
The placenta is a soft organ rich in vessels with a unique significance, providing a biological connection between the mother and fetus (10, 11). It is known that pathological developments in the placenta cause poor prognoses by affecting fetal growth. Placental elasticity was reported to be decreased and hardened in preeclamptic pregnancies, and it was emphasised in previous studies that SWE helps in placental assessment and can be used as a support in the prediction of preeclampsia (12, 13). It was reported that the decreased elasticity in the placentas of pregnant women having preeclampsia or fetuses with intrauterine growth retardation, in combination with fibrosis and inflammation, might have been associated with ischemic changes and infarcts, and it was emphasised that an elasticity assessment could be useful for assessing placental status (14).
2. Objectives
There are few studies on placental assessment with SWE in normal pregnant women and on their normal values. We aimed to determine the normal elastogram values of the placentas of healthy pregnant women and to examine the factors affecting their elasticities due to the importance of placental assessment and early diagnosis in risky pregnancies.
3. Patients and Methods
Of the 368 pregnant women who were examined with obstetric US between January 1 and March 15, 288 pregnant women in the second or third trimester were included. Ethical committee approval and local institutional committee permission were obtained from Necmettin Erbakan University for this study. Informed consent forms were also obtained from the participating pregnant women. The pregnant women whose fetuses were detected to have congenital anomalies and intrauterine growth retardation and/or the pregnant women with complicated pathologies, such as developmental abnormalities, diffuse calcification, masses or hematoma in the placenta; the pregnant women with a posteriorly located placenta, as the device could not perform the measurement; and the pregnant women with an abnormal amount of amniotic fluid were excluded from the study. In addition, the pregnant women with diabetes mellitus, severe anemia, hypertension, heart disease or any other disease were also excluded from the study. The pregnant women with normal physical examinations, laboratory tests and US examinations were included in the study. All patients underwent obstetric US in the supine position with the Toshiba Aplio 500 (Toshiba Medical Systems Corporation, Tokyo, Japan) device using a 1-6-MHz convex transducer. In the B-mode examination, fetal biometric measurements, including biparietal diameter (BPD), femur length (FL), abdominal circumference (AC) and estimated fetal weight; amniotic fluid index (AFI); and the placental data, including its localization, thickness and echo structure, were obtained and their B-mode images were recorded. Subsequently, an SWE examination not exceeding 5 seconds was conducted on the placenta. At this time, the patient was instructed to breath slowly and stand still for 5 seconds, and imaging was carried out with the adjustable trapezoid-shaped imaging box in the period when the fetus was at rest. The measurement was performed via the round and free region of interest (ROI) after colouring, and images were frozen with the color scale, reflecting the stiffness in the imaging box and ranging from blue to red.
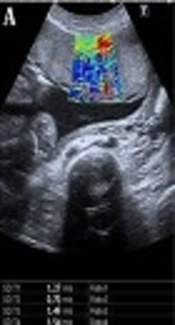
The central region of the placenta, which is the thickest part, was divided into three parts, including the maternal surface, central part and fetal surface. Three measurements were carried out and coded as S1, S2, and S3, respectively. Afterwards, a fourth measurement was taken from the thickest part of the central placental area to encompass the previous three measurements and coded as S4. Subsequently, a fifth measurement was obtained from the centre of the peripheral placenta and coded as P. The velocity values from coded zones as m/sec via the ROI were obtained (Figure 1A and B). The ROI’s volume was not standardized, as the placental thicknesses were different. The placentas with anterior, anterolateral, posterolateral and fundus localizations whose depth did not exceed 10 cm and that could be penetrated were preferred for measurement. It was examined whether there was any difference in elasticity in the placental regions. The factors affecting elasticity were analyzed by investigating gestational age, parity, gravidity, AFI, placental location, thickness, and grade, and the ideal measurement area was determined.
 images of the placenta in pregnant women. Two split shear wave elastography images are at the same level. The rectangular box represents the stiffness spectrum in blue to red. A, SWE images of the central placenta of a 21-year-old pregnant woman in the 27th week of gestation. Round and free regions of interests (ROI) are placed in the colour area. SWE velocity values were measured as 1.27 m/s, 0.70 m/s, 1.49 m/s, and 1.54 m/s, from S1, S2, S3 and S4, respectively. B, SWE images of the peripheral placenta of a 28-year-old pregnant woman in the 37th week of gestation. ROI is placed in the center of the colour area. SWE velocity value was measured as 1.08 m/s, from P area (P,centre of the peripheral placenta ;S1, maternal surface of central placenta; S2, central part of central placenta; S3, fetal surface of central placenta; S4, central
placental area).")
Shear wave elastography (SWE) images of the placenta in pregnant women. Two split shear wave elastography images are at the same level. The rectangular box represents the stiffness spectrum in blue to red. A, SWE images of the central placenta of a 21-year-old pregnant woman in the 27th week of gestation. Round and free regions of interests (ROI) are placed in the colour area. SWE velocity values were measured as 1.27 m/s, 0.70 m/s, 1.49 m/s, and 1.54 m/s, from S1, S2, S3 and S4, respectively. B, SWE images of the peripheral placenta of a 28-year-old pregnant woman in the 37th week of gestation. ROI is placed in the center of the colour area. SWE velocity value was measured as 1.08 m/s, from P area (P,centre of the peripheral placenta ;S1, maternal surface of central placenta; S2, central part of central placenta; S3, fetal surface of central placenta; S4, central placental area).
3.1. Statistical Analysis
The statistical analysis was performed with the SPSS 22 software (Released 2013, SPSS Statistics for Windows, Version 22.0 Armonk, NY: IBM Corp) (Copyright IBM Corporation and its licensors 1989, 2012). The results of the descriptive statistics were given as mean ± standard deviation (SD) and min - max. The normality of the data was analyzed using the Shapiro-Wilk normality test. The Kruskal-Wallis test, analysis of variance (ANOVA) and student’s t-test were performed for examining the differences among groups. Multiple comparisons among groups were carried out using the Conover-Iman test of multiple comparisons and Tukey’s honest significant difference multiple comparison test with Bonferroni correction. The relationship between continuous variables was examined by Spearman’s Rho and Pearson’s correlation coefficient, and P < 0.05 was considered statistically significant.
4. Results
The mean age of the 288 participating pregnant women with a gestational age range of 14 - 41 weeks was 26 years (18 - 46 years). The descriptive characteristics of the pregnant women, including age, gravidity, parity, gestational week (GW) and body mass index (BMI), are shown in Table 1. There were significant differences among the velocity values obtained from five different sites of the placenta. The mean S1 and S4 zone velocity values were higher than the mean P zone (P < 0.001). The central region of the placenta was harder than the peripheral region, and there was a significant difference between the mean velocity measurements obtained from the S1, S2 and S3 zones (P < 0.001). The mean S1 zone velocity values were higher than S2 and S3 zones. The hardest region of the placenta was the maternal surface of the central region, whereas the softest regions were the peripheral region and the centre of the central region (Table 2 and Figure 2).
| Maternal age | Gravidity | Parity | Gestational week | BMI | Trimester | ||
|---|---|---|---|---|---|---|---|
| 2 (%) | 3 (%) | ||||||
| n | 288 | 288 | 288 | 288 | 288 | 159 (55.21) | 129 (44.79) |
| Mean ± SD | 26.16 ± 5.84 | 2.64 ± 1.66 | 1.30 ± 1.38 | 26.40 ± 6.98 | 27.50 ± 5.29 | ||
| Min - Max | 18.00 - 44.00 | 1.00 - 11.00 | 0.00 - 10.00 | 14.00 - 39.00 | 17.70 - 48.40 | ||
Abbreviations: BMI, body mass index; SD, standard deviation.
| SWE (m/sec) | Mean | SD | Min | 1Q | Med | 3Q | Max | P value | Pairwise comparison |
|---|---|---|---|---|---|---|---|---|---|
| (a) S1 | 2.52 | 0.79 | 0.51 | 1.96 | 2.41 | 3.02 | 4.69 | (b) (e) | |
| (b) S2 | 2.30 | 0.75 | 0.20 | 1.78 | 2.23 | 2.82 | 4.10 | (a) (d) | |
| (c) S3 | 2.37 | 0.83 | 0.23 | 1.78 | 2.28 | 2.92 | 4.44 | < 0.001a | - |
| (d) S4 | 2.51 | 0.43 | 1.50 | 2.22 | 2.50 | 2.82 | 3.76 | (b) (e) | |
| (e) P | 2.28 | 0.72 | 0.38 | 1.78 | 2.19 | 2.75 | 4.25 | (a) (d) |
Abbreviations: SWE, shear wave elastography; 1Q, first quantile; 3Q, third quantile; S1, maternal surface of central placenta; S2, central part of central placenta; S3, fetal surface of central placenta; S4, central placental area;P,centre of the peripheral placenta SD, standard deviation.
a Statistically significant.

Multiple comparison and distribution of velocity values obtained from placenta measurement regions
Although there was a correlation between the elastographic velocity values of the placenta and age, BMI and placental localization, thickness, and grade, there was no association with gravidity, parity, GW, and AFI. There was a negative correlation between the mean S1 elastography velocity value and age, and there was a positive correlation between the S2 value and BMI, as well as between the S3 and S4 values and placental thickness (P < 0.05) (Table 3). In addition, a positive correlation was found between the S4 value and placental localization (P < 0.001) and between the S2 value and placental grade (P < 0.03) (Table 4). There was no relationship between P zone velocities and numeric and non-numeric properties of the study group (Tables 3 and 4). There was a positive correlation between placental thickness and GW and BMI (P < 0.001) (Table 5).
Abbreviations: AFI, amniotic fluid index; S1, maternal surface of central placenta; BMI, body mass index; S2, central part of central placenta; S3, fetal surface of central placenta; S4, central placental area.
a Values are different from 0 with a significance level alpha = 0.05.
| Non-numeric properties | S1 | S2 | S3 | S4 | P |
|---|---|---|---|---|---|
| Placenta localization | |||||
| Anterior (n = 117) | 2.59 ± 0.74 | 2.32 ± 0.79 | 2.44 ± 0.85 | 2.57 ± 0.38 | 2.32 ± 0.82 |
| Fundus (n = 7) | 2.40 ± 0.90 | 2.45 ± 0.55 | 1.87 ± 0.47 | 2.27 ± 0.22 | 2.01 ± 0.95 |
| Fundus-posterior (n = 95) | 2.42 ± 0.84 | 2.17 ± 0.66 | 2.25 ± 0.82 | 2.35 ± 0.38 | 2.29 ± 0.75 |
| Right side wall (n = 40) | 2.49 ± 0.83 | 2.25 ± 0.71 | 2.46 ± 0.83 | 2.52 ± 0.32 | 2.28 ± 0.75 |
| Left side wall (n = 29) | 2.65 ± 0.80 | 2.11 ± 0.69 | 2.16 ± 0.84 | 2.48 ± 0.35 | 2.42 ± 0.71 |
| P value (OneWay ANOVA) | 0.478 | 0.443 | 0.142 | < 0.001b | 0.777 |
| Placental grade | |||||
| Grade 1 (n = 161) | 2.51 ± 0.77 | 2.29 ± 0.72 | 2.36 ± 0.87 | 2.49 ± 0.37 | 2.30 ± 0.81 |
| Grade 2 (n = 95) | 2.60 ± 0.79 | 2.10 ± 0.73 | 2.26 ± 0.73 | 2.41 ± 0.39 | 2.34 ± 0.75 |
| Grade 3 (n = 32) | 2.35 ± 0.94 | 2.44 ± 0.69 | 2.46 ± 0.96 | 2.58 ± 0.36 | 2.26 ± 0.74 |
| P value (OneWay ANOVA) | 0.282 | 0.033b | 0.427 | 0.057 | 0.848 |
| Trimester | |||||
| 2 (n = 159) | 2.50 ± 0.75 | 2.29 ± 0.73 | 2.33 ± 0.86 | 2.49 ± 0.38 | 2.34 ± 0.80 |
| 3 (n = 129) | 2.56 ± 0.85 | 2.18 ± 0.72 | 2.35 ± 0.81 | 2.46 ± 0.38 | 2.27 ± 0.76 |
| P value (student’s t) | 0.516 | 0.224 | 0.796 | 0.463 | 0.467 |
Abbreviations: S1, maternal surface of central placenta; S2, central part of central placenta; S3, fetal surface of central placenta; S4, central placental area.
a Values are expressed as mean ± SD.
b Statistically significant.
The nomogram table according to trimester was generated with the velocities obtained from the placenta measurement regions (Table 6).
| Trimester | ||||
|---|---|---|---|---|
| 2 | 3 | |||
| SWE velocity values | Mean ± SD | Min - Max | Mean ± SD | Min - Max |
| S1 | 2.50 ± 0.75 | 0.51 - 4.69 | 2.56 ± 0.85 | 0.58 - 4.38 |
| S2 | 2.35 ± 0.75 | 0.25 - 4.10 | 2.25 ± 0.74 | 0.20 - 4.00 |
| S3 | 2.37 ± 0.83 | 0.58 - 4.44 | 2.38 ± 0.84 | 0.23 - 4.42 |
| S4 | 2.50 ± 0.42 | 1.50 - 3.76 | 2.53 ± 0.43 | 1.69 - 3.74 |
| P | 2.25 ± 0.71 | 0.62 - 4.25 | 2.32 ± 0.73 | 0.38 - 4.02 |
Abbreviations: S1, maternal surface of central placenta; S2, central part of central placenta; S3, fetal surface of central placenta; S4, central placental area; SD, standard deviation.
5. Discussion
Today, SWE contributes to measuring placental elasticity and assessing the placenta. The studies investigating and comparing the elasticity characteristics of normal and pathological tissues emphasize the diagnostic importance of this technique (5, 6, 8, 9, 15-17). The SWE velocities of the placenta were found to be lower than those of the breast (18), the liver of a child (19), the endometrium, and the myometrium (10, 20). This is an indication of the fact that the placenta is normally a soft organ. In a study examining placental elasticity Ex vivo, it was found that the placentas of preeclamptic pregnant women were stiffer than the normal placentas of pregnant women (21). Also, placental infarction, sclerotic narrowing of the arteries and villous inflammation in preeclamptic and diabetic pregnant women’s placentas were demonstrated histologically (22-24). Higher placental thicknesses in diabetic pregnancies (24) and high SWE values (25) suggest that histological changes in diabetes may lead to an increase in elasticity values. In our study, we did not have any diabetic patients, but we observed that the placentas of pregnant women with high BMI values were thicker and harder. Placental thickness increased along with GW, whereas its stiffness did not change significantly with the GW. Increased stiffness in pregnant women with a high BMI and a thick placenta leads to the thought that obesity can cause an increase in velocity values by affecting placental histology, as with diabetes, and it increases the importance of an elasticity assessment.
Different velocity values were obtained from placental regions or maternal and fetal surfaces in the studies evaluating placental elasticity. When the ROI was placed at the initiation of cord insertion, elasticity was reported to increase in a study assessing placental elasticity (21). In our study, we observed that the fetal surface close to cord insertion showed a higher velocity value compared to the central placenta, whereas it had a lower velocity value compared to the maternal surface. In another study examining the placental elasticity of pregnant women at GW 20 to 23, no significant difference was found between the velocities measured from the peripheral or central parts of the placenta (12, 13). However, the maternal surface velocity values in the placentas of both preeclamptic and normal pregnant women were higher compared to those in other regions (13). In our study, the values obtained from the central placenta were higher than the periphery values, indicating the central region was harder, but this may be associated with the fact that the central region was thicker. A recent research study predicting the importance of SWE in placental invasion has revealed that elasticity scores are different among the fetal side, maternal side and central portion of placenta, and the elasticity score is higher in invasive placentas (26). In our measurements performed within the central region itself, consistent with previous studies, the higher velocity of the maternal side may be attributed to the neighborhood surrounding the myometrium, which is harder than the placenta
The moderate and high-reliability values of SWE, with inter and intra-observer velocity measurements, are indicative of the fact that it is not a user-dependent test (14). However, because biological tissues are not homogeneous, knowing the fact that the tissue structure and side characteristics will affect the velocity of SWE by the operator, it is important to minimize measurement errors (6). Due to the non-homogeneous structure of the placenta, composed of decidua and chorionic layers rich in vessels, it is recommended to place the ROI on vessel-free homogeneous areas and to leave some placental tissue between the ROI and side in the side samplings (27). To minimize the margin of error, we performed velocity measurements from homogeneous areas. Although the measurement was reported to be affected by depth in previous studies (2, 28), no significant difference was found, even at a depth of 1.5 - 7 cm in the study by Wu et al. (10). Ohmaru et al. also detected no significant relationship between SWE velocity and a ROI depth up to 8 cm. However, they stated that the measurement became difficult if the depth exceeded 8 cm (14). In our study, we preferred the placental regions with anterior, lateral wall and fundus localizations, where we could measure reliably closer than 10 cm.
Theoretically, the hardness of the placenta is expected to increase as the GW progresses. However, no significant relationship was found between trimester and SWE values in the studies conducted (10, 14). It was noted that little change occurred in placental stiffness with gestation progression and placental maturation, even if echogenicity, thickness and volume changed (29). In our study, the velocities obtained from the central part of the central placental region with grade 3 appearances were found to be higher than those of the grade 2 placenta. In the study by Wu et al. (10), no association of SWE velocities was found with trimester, maternal age, placental localizations and sampling depth after examining the placentas of pregnant women in the second and third trimester. Furthermore, no relationship was detected between SWE velocities and GW in our study. SWE was also not associated with gravidity, parity and AFI. However, as the patient age decreased, we noted an increase in the mean velocity value in the S1 region. We also obtained higher values in the anteriorly located placentas compared to the fundal, posteriorly located placentas in the S4 zone velocity measurements. We did not observe different values in other regions and placental localizations. The fundus-posterior localization may be the cause of the low velocity, which is the furthest localization in terms of sampling depth compared to the anterior localization. We did not detect any relationship between P zone velocity values and maternal and placental characteristics. It can be resulted from thinness of placenta's peripheral region.
Studies on the use and safety of the SWE technique have been carried out, and no histological evidence suggestive of thermal or mechanic damage has been found (21). The mechanical pushing index created by SWE is lower than the limits allowed by the US Food and Drug Administration, and it is compatible with color Doppler US. Based on these results, it seems safe to be used in pregnancy (6, 21, 30). The acoustic output settings used during the elastographic examination were less than the limit set by the FDA.
Our study had limitations. An assessment could not be performed, as maximum penetration could not be provided in the posteriorly located placentas, which led to a decrease in our total patient numbers. However, this can be considered a technical factor limiting its use in each pregnancy.
In conclusion, there was a difference in elasticity that was unaffected by GW between the regions and surfaces of the placenta. While the centre of the central region had the lowest velocity values, the maternal surface had the highest values. It may be convenient to use the SWE technique with low user dependence in the follow-up of the placentas of high-risk pregnancies. However, considering the factors affecting placental pathology and the controversial study results, a significant number of large-scale studies is needed to strengthen the role of SWE in assessing placental pathologies.
