


1. Background
Chronic obstructive pulmonary disease (COPD) is a multicomponent disease containing a combination of small airway disease (bronchiolitis) and parenchyma destruction (emphysema), as characterized by incompletely reversible airflow limitation (1). COPD has been currently the fourth leading cause of death worldwide (2). As the global population ages, the social and family burden of COPD are increasing continuously (3).
Pulmonary function test (PFT), especially spirometry, is the most widely used clinical test for COPD, but it can not determine morphological abnormalities, regional dysfunction and pathological changes (4). Moreover, allowing for the risk of bullae ruptures, COPD patients with the presence of pulmonary bulla often can not perform PFT. However, computed tomography (CT) lung perfusion scan could be used to evaluate regional, morphologic, and functional changes in COPD noninvasively (5, 6). In previous studies, the scan range of 16-slice or 64-slice multidetector row CT is incapable to cover the whole lung in a single rotation, thus multiple scanning would lead to the increase of radiation dose (7-9). Furthermore, the bronchial artery hemodynamic abnormalities that are common in COPD patients and correlate closely with life-threatening bleeding from the airways have not been studied quantitatively using CT lung perfusion scan (5, 6, 8, 9). A 320-detector row CT with the dual input model has the capacity to evaluate the dual hemodynamics of organs. Meanwhile, it reduces radiation dose by covering the whole lung in a single rotation (10, 11). To the best of our knowledge, there have been no studies investigating dual hemodynamic changes in severe COPD patients using CT lung perfusion scan.
2. Objectives
In this prospective study, we performed low-dose CT lung perfusion scan using a 320-detector row dynamic volumetric CT in severe COPD patients and healthy subjects. The objective of this study was to determine dual hemodynamic changes quantitatively in patients with severe COPD by using low-dose CT lung perfusion scan.
3. Patients and Methods
3.1. Study Population
This study was approved by the Medical Ethics Committee of Jinan University, and written informed consent was obtained from each participant. Thirty-five subjects with suspicious lung nodules during physical examination and 20 patients with severe COPD were enrolled between January 1, 2015 and January 31, 2016. The inclusion criteria of severe COPD were: post-bronchodilator forced expiratory volume in one second (FEV1)/forced vital capacity (FVC) < 70%, FEV1 < 30% predicted (12). Major exclusion criteria were: (1) coexistence with other pulmonary diseases such as pulmonary tuberculosis, pleural effusion and bronchial asthma; (2) coexistence with heart failure or respiratory failure (3) contraindication for enhanced CT scan, such as allergy to the iodine agent, and renal failure. Finally, fifteen severe COPD patients (nine males and six females; mean age, 54.5 ± 15.5 years) and 31 healthy subjects (16 males and 15 females; mean age, 64.9 ± 10.7 years) were included in this study.
3.2. Imaging Techniques
CT lung perfusion scans were performed in all participants by using a 320-detector row CT scanner (Aquilion One; Toshiba Medical Systems, Tochigi, Japan). In order to minimize the effect of cardiac drugs on vasodilatation, all patients included were required not to take medicine on the day before the CT examination. Baseline chest CT scanning was performed. The imaging parameters of perfusion scan are summarized in Table 1. Restraining bands were placed around the subcostal abdominal wall to limit respiratory motions, and all participants were required to breathe gently during the scan. The density of regions of interest (ROIs) was measured two seconds after the injection of contrast medium, containing 15 volumes with a 2-s interval. Image data of each volume was reconstructed with 0.5-mm slice thickness and 0.5-mm spacing. The scan coverage was 160 mm, thus generating 160/0.5 = 320 images per volume. There were 15 volumes in each perfusion scan, resulting in a total of 15 × 320 = 4800 images. Effective radiation dose was calculated by using the following equation: Effective radiation dose (mSv) = dose-length product (DLP) (mGy.cm) × 0.014 (mSv mGy-1cm-1). The DLP and conversion coefficient was proposed by the International Commission on Radiological Protection (13). The plain scan and perfusion DLP were 26.6 mGy.cm and 260.4 mGy.cm respectively, the total effective radiation dose for each patient was 4.02 mSv.
| Variables | Value |
|---|---|
| Scan parameters | |
| Number of detector rows | 320 |
| Craniocaudal coverage | 160 mm |
| Collimation | 0.5 mm |
| Tube voltage | 80 kV |
| Tube current | 70 mA |
| Gantry rotation time | 0.5 s |
| Matrix | 512 × 512 |
| Field of view | 300 mm × 350 mm |
| Thickness | 0.5 mm |
| Scan center | Hilum of lung |
| Contrast agent | |
| Iodine concentration | 370 mg/mL |
| Injection rate | 7 mLs-1 |
| Total dose | 56 mL |
| Saline flush | 50 mL with 7 ml s-1 |
| Scan | Every 2 s for 30 s |
3.3. Image Analysis
All CT perfusion images were transferred to the CT processing workstation. First, the images were adjusted automatically with body registration software (Body Registration; Toshiba Medical System, Japan). The body perfusion software V4.74 (Toshiba Medical Systems) was applied for perfusion data analysis, which applied the dual-input maximum slope analysis method. The window width range was set as -1000-0 HU to eliminate the interference of bone and large vessels. For each subject, four regions of interest (ROI) were drawn on the main trunk of the pulmonary artery, the descending aorta, the left atrium and the lung parenchyma to generate four time-density curves (TDCs) (Figure 1). The time to peak (TTP) of each TDC was recorded. The ROIs were manually placed in the pulmonary artery trunk and the aorta at the level of the pulmonary hilum to generate the TDCs representing the PA input function and the BA input function respectively, and the left atrium was selected to distinguish body circulation and pulmonary circulation as described by Yuan et al. (14). Then, the functional maps were generated, including pulmonary artery flow (PAF), bronchial artery flow (BAF) and perfusion index [PI = PAF/(PAF + BAF)]. The parameters are expressed in milliliter per 100 mL per min.
On parametric images, ROIs were manually drawn on the bilateral peripheral zone of the lung on three slices including the aortic arch slice, the carina slice, and the slice 2 - 3 cm above the top of the diaphragm. ROIs were chosen to keep away from the surrounding vessels and soft tissues. For each participant, each pulmonary perfusion index was the average of all ROIs on the three slices. Each participant was assessed independently by M.L and D.D, each with 5 and 8 years of experience in chest CT diagnosis.
. B, Four time-density curves (TDCs), among which the yellow one represents TDC of the pulmonary artery (PA), the blue one represents TDC of the left atrium (LA), pink one represents TDC of the descending aorta (artery), and the red one represents TDC of pulmonary tissue (tissue).")
CT perfusion image in a 56-year-old healthy female. A, Regions of interest (ROIs). B, Four time-density curves (TDCs), among which the yellow one represents TDC of the pulmonary artery (PA), the blue one represents TDC of the left atrium (LA), pink one represents TDC of the descending aorta (artery), and the red one represents TDC of pulmonary tissue (tissue).
3.4. Statistical Analysis
Data are expressed as mean ± standard deviation (SD). Interobserver reproducibility of the perfusion parameters was evaluated by using the intraclass correlation coefficient (ICC). The Kolmogorov-Smirnov test and Levene’s test were used to evaluate the normal distribution and homogeneity of variance of all perfusion indexes. The independent sample t-test was applied to compare the lung perfusion indexes and the TTP of TDCs between the COPD group and the control group. Statistical analysis was performed by using SPSS 19.0 software (SPSS Inc., Chicago, IL, USA). P < 0.05 was considered to indicate a significant difference.
4. Results
4.1. Pulmonary Perfusion Parameters
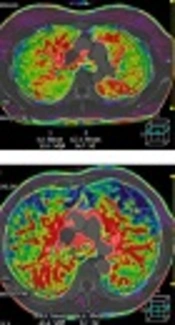
The ICC for PAF, BAF, and PI were 0.952 (95% confidence interval [CI]: 0.922 - 0.968), 0.943 (95% CI: 0.915 - 0.963), and 0.939 (95% CI: 0.907 - 0.956) respectively, suggesting a good interobserver measurement reproducibility. Two radiologists’ measurements of PAF, BAF, and PI in each patient was averaged to generate the final value of perfusion indexes. The pulmonary perfusion indexes in the control group and COPD group are shown in Table 2. The PAF and PI values in the COPD group were significantly lower than that in the control group (P < 0.001, P < 0.001), while the BAF value in the COPD group was significantly higher than that in the control group (P < 0.001). PAF, BAF, and PI parametric maps of a healthy subject and a COPD patient are shown in Figure 2.
| PAF (mL/min/100mL) | BAF (mL.min/100mL) | PI (%) | |
|---|---|---|---|
| Control group | 102.43 ± 71.68 | 2.28 ± 0.29 | 98.76 ± 1.86 |
| COPD group | 76.69 ± 24.90 | 20.70 ± 23.72 | 82.22 ± 6.63 |
| P value | < 0.001 | < 0.001 | < 0.001 |
Abbreviations: BAF, bronchial artery flow; COPD, chronic obstructive pulmonary disease; PAF, pulmonary artery flow; PI, perfusion index; SD, standard deviation.
a Values are expressed as mean ± SD.
, bronchial artery flow (BAF), perfusion index (PI) parametric maps of a 70-year-old healthy man. A, PAF is in homogeneous distribution. B, BAF is very little. C, PI is also homogeneous. D-F, PAF, BAF, and PI parametric maps of a 69-year-old male patient with chronic obstructive pulmonary disease (COPD). D, Heterogeneously decreased PAF. E, Heterogeneously increased BAF. F, Heterogeneously reduced PI.")
A-C, Pulmonary artery flow (PAF), bronchial artery flow (BAF), perfusion index (PI) parametric maps of a 70-year-old healthy man. A, PAF is in homogeneous distribution. B, BAF is very little. C, PI is also homogeneous. D-F, PAF, BAF, and PI parametric maps of a 69-year-old male patient with chronic obstructive pulmonary disease (COPD). D, Heterogeneously decreased PAF. E, Heterogeneously increased BAF. F, Heterogeneously reduced PI.
4.2. Time to Peak
The TTP of the pulmonary parenchyma TDC, the pulmonary artery TDC, the aorta TDC and the left atrium TDC are shown in Table 3. The TTP of lung parenchyma in COPD patients was significantly prolonged than that in healthy subjects (P < 0.001). The TDCs of a healthy subject and a COPD patient are shown in Figure 3. No significant difference was found in TTP of the aorta TDC, the pulmonary artery TDC and the left atrium TDC between the two groups (P > 0.05).
| PA | LA | BA | Lung parenchyma | |
|---|---|---|---|---|
| Control group | 8.34 ± 1.00 | 13.59 ± 1.51 | 16.27 ± 2.37 | 11.33 ± 1.69 |
| COPD group | 8.46 ± 1.41 | 14.03 ± 2.46 | 17.07 ± 3.24 | 14.86 ± 1.28 |
| P value | 0.80 | 0.60 | 0.47 | < 0.001 |
Abbreviations: BA, bronchi artery; COPD, chronic obstructive pulmonary disease; LA, left atrium; PA, pulmonary artery; SD, standard deviation; TTP, time to peak.
a Values are expressed as mean ± SD.
 of a 54-year-old healthy male. The time to peak (TTP) of pulmonary parenchyma TDC (red) is 12.4 s. B, TDCs of a chronic obstructive pulmonary disease (COPD) patient. The TTP of pulmonary parenchyma TDC (red) is 16.4 s.")
A, Time-density curves (TDC) of a 54-year-old healthy male. The time to peak (TTP) of pulmonary parenchyma TDC (red) is 12.4 s. B, TDCs of a chronic obstructive pulmonary disease (COPD) patient. The TTP of pulmonary parenchyma TDC (red) is 16.4 s.
5. Discussion
In the present study, we demonstrated significant increase of BAF and decrease of PAF and PI in severe COPD patients, and confirmed the feasibility of low-dose CT lung perfusion scan to evaluate the pulmonary dual hemodynamics.
PFT, particularly spirometry, is the cornerstone for diagnosis and classification in patients with COPD (15). The diagnosis of severe COPD is made when FEV1/FVC < 70%, and FEV1 < 30% are predicted (12). The patients with respiratory failure or heart failure sometimes are too weak to perform PFT. Meanwhile, pulmonary bullae are not uncommon in severe COPD patients. Pulmonary function tests take the risk of bullae rupture for these patients. Thus, a non-invasive imaging modality is highly desirable for accurate evaluation of pulmonary dysfunction in severe COPD. In Guan’s study, pulmonary perfusion parameters were positively correlated with FEV1, FEV1% predicted, FVC and FEV1/FVC (5). Under this circumstance, CT lung perfusion scan is a preferable diagnostic tool in detecting pulmonary dysfunction.
However, the greatest limitation for CT perfusion scanning, particularly serial CT scanning, is the risk of ionizing radiation (7). To overcome this limitation, low-dose CT scanning is increasingly utilized (16). In studies performed by Alkadhi et al. (17) and Hosch et al. (18), CT perfusion scan using the adaptive iterative dose reduction (AIDR) reconstruction algorithm and the 100 KV tube voltage reduced the scan dosage to about 80% of conventional chest CT scan, and the image quality was good enough for the diagnosis. In our study, the 320-detector row CT using the 160 mm z-coverage could obtain the volumetric information in a single rotation. All dose saving technologies including AIDR reconstruction algorithm, the shortest tube rotation time, and the post-processing techniques are ready for use. Meanwhile, the slight lower voltage (80 KV) was utilized in our study. Thus, the radiation dose in our study was lower than that of Alkadhi et al. (17) and Hosch et al. (18) studies. Meanwhile, the image quality was sufficient to demonstrate the distinct changes of pulmonary dual hemodynamics in severe COPD patients.
Previously, CT perfusion scan was mainly used to assess pulmonary artery hemodynamics in COPD patients (8, 19). Nevertheless, lung is a dual blood supply organ, and bronchial artery hemodynamic abnormalities are common in COPD (20). To make it clear, we used the dual input model to evaluate the pulmonary and systemic circulation quantitatively. In the present study, the patients with severe COPD had a lower PAF than normal subjects. This is consistent with findings of Fan et al. (19), Ogasawara et al. (21) and Ley-Zaporozhan and van Beek (22). They utilized the MR, CT or SPECT to qualitatively assess lung perfusion, and all showed that PAF was decreased in COPD patients. This phenomenon can be explained by several factors. In COPD patients, ventilation is damaged due to small airway obstruction and pulmonary parenchyma destruction. The hypoxic vasoconstriction in lung parenchyma with reduced ventilation leads to decrease of PAF (23). Besides, pulmonary hypertension caused by alveolar expansion and capillary bed destruction also result in decrease of PAF (24).
In this study, the patients with severe COPD had a higher BAF. The bronchial microvasculature broadly interconnects with the pulmonary arterial circulation via bronchial and alveolar capillary beds (24). When the pulmonary blood flow decreases, the bronchial blood circulation respond with compensatory increase (24). This would result in an increase of BAF. PI is related to the proportion of the pulmonary and systematic circulation, which directly reflects the change of pulmonary dual hemodynamics. In the present study, the decreased PI indicated the increased proportion of systematic circulation. Bronchial artery dilatation arising from the increased systematic circulation would add the risk of life-threatening bleeding from the airways (25). Therefore, both BAF and PI could be used as biomarkers of risk event in COPD patients.
Time to peak (TTP) is defined as the time to reach the maximum value of contrast material concentration (26). Recently, TTP has been proved to be a surrogate parameter to increase the quantitative accuracy of CT perfusion imaging in animal models of bronchial occlusion (27). The TTP of lung parenchyma in COPD patients was significantly prolonged compared to healthy subjects, which was in accordance with the finding of Remy-Jardin et al. (28). The TTP prolongation may be explained by a significant increase in pulmonary blood flow resistance resulting from the thickening microvascular wall and destructive capillary beds.
This study still had several limitations. First, specific PFT data of each COPD patient was unavailable for us in this study. The correlation between PFT parameters and pulmonary dual hemodynamic indexes (PAF, BAF and PI) should be validated in follow up study. Second, the sample size of this research was relatively small. Further studies with a large cohort of patients with COPD in different stages is needed to confirm the correlation between CT pulmonary perfusion parameters and the severity of COPD. Third, our post-processing software only permitted the manual selection of ROI in a single image plane. A 3D ROI technique which can cover all destructive lung parenchyma should be developed to improve the accuracy of perfusion indexes evaluation.
In conclusion, low-dose CT lung perfusion scanning using a 320-row CT could be used to quantitatively evaluate the pulmonary dual hemodynamics in severe COPD patients.
The authors declare no conflict of interest.
