


1. Background
Cardiac magnetic resonance imaging (MRI) is the modality of choice in the follow-up of patients with congenital heart defects (CHD) (1-3). Follow-up examinations include assessment of left and right ventricular function with particular focus on the right side. Right ventricular ejection fraction is the most accurate and reproducible parameter to examine right ventricular function (2, 4) and its assessment with cardiac MRI has been mentioned as the most reliable method (5, 6). Moreover, the right ventricular function is an essential parameter for long-term prognosis in patients with CHD but also a predictive value for the outcome in patients with acquired heart diseases, ischemic cardiomyopathies, pulmonary hypertension, arrhythmogenic right ventricular dysplasia, valvular heart diseases, myocarditis and dilated cardiomyopathies as mentioned in previous studies (7-9). Analysing short axis stacks represents a standard procedure for cardiac MRI ventricular volume calculation (6).
When evaluating cardiac performance parameters with the cardiac MRI short axis method, there are some critical picture elements including papillary muscles, determination of the end-diastolic and end-systolic cardiac phase in respect of a probably existing right bundle branch block, and furthermore selection of the basal plane (10-13). The slice thicknesses routinely acquired are 3 to 6 mm. Therefore, if not chosen thoroughly, a not-correct basal plane selection can result in significant changes of ventricular performance parameters.
2. Objectives
This study aimed to evaluate the impact of basal plane selection concerning the resulting cardiac performance parameters. Therefore, additional evaluations of these parameters for each ventricle with a variation of the basal plane by ± one slice was carried out.
3. Patients and Methods
For this retrospective single-center study, a total of 108 patients with congenital heart defects were selected from the department’s database seen in the period between August 2009 and September 2011. To create a homogeneous study group, the following inclusion criteria were applied: (1) corrected tetralogy of Fallot; and (2) consistent functional results - meaning a threshold of ±5 % difference between the following parameters were chosen arbitrarily. Short axis volume measurement of the left ventricular stroke volume and gross forward volume in the aorta as measured by velocity-encoded gradient echo imaging, short axis volume measurement of the right ventricular stroke volume and gross forward volume in the pulmonary artery as measured by velocity-encoded gradient echo imaging, and net forward volume in the pulmonary artery and net forward volume in the aorta. These matches should ensure that the initial ventricular evaluations were accurate, thus excluding any other source of error (like procedural errors, shunts, etc.).
Due to these inclusion criteria, a total of 26 patients (11 females, 15 males; mean age: 20.7 years ± 7.8, mean weight: 57.3 kg ± 23.0, mean height: 163.4 cm ± 15.1, mean body surface area: 1.6 ± 0.3 kg/cm2) were included in the study. All patients underwent cardiac MRI for clinical diagnostic purposes.
A total of 82 patients were excluded from the study: 43 patients had other types of CHD (like double outlet right ventricle, transposition of the great thoracic arteries, Ebstein anomaly, and functional singular ventricle). Due to technical problems, velocity encoded gradient echo imaging measurements could not be carried out in two patients; 37 tetralogy of Fallot patients had a difference higher than ± 5 % between velocity-encoded gradient echo imaging measurements and short axis volume measurements (mean difference: 9.3 % ± 0.1).
Approval by the local ethics committee (EC-number: 25 - 456 ex 12/13) was obtained. The local ethics committee waived informed consent.
3.1. Image Acquisition
All cardiac MRI examinations were performed on a 1.5 Tesla device (Siemens Medical Systems, Erlangen, Germany), and a standard protocol consistent with current guidelines (14-17) was used. Steady-state free precession images were acquired in the short axis plane from the atrioventricular groove to the cardiac apex for cardiac volume measurements. Cine acquisitions were performed with electrocardiogram gating at end-inspiration. Furthermore, velocity encoded gradient echo imaging was done in the pulmonary artery and aorta to evaluate the gross forward and the backward volume for each vessel.
Typical parameters for steady-state free precession sequences were as follows: flip angle: 80 degrees; repetition time: 50 ms; echo time: 1 - 2 ms; 2 - 3 × 1 - 2 mm / pixel in-plane spatial resolution; and 6 mm slice thickness. For velocity encoded gradient echo imaging sequences: flip angle: 30 degrees; repetition time: 40 - 50 ms; echo time: 2 - 3 ms; 2 - 3 × 1 - 2 mm / pixel in-plane spatial resolution; and slice thickness: 6 mm.
3.2. Imaging Post-Processing
MRI studies were analyzed offline by two observers (R.M. and S.T.) using the Argus Software Numaris 4 (Siemens Medical Systems, Erlangen, Germany).
Selection of end-diastolic and end-systolic phase was performed manually by visual determination of the cardiac phase with the largest/smallest ventricular cavity. Therefore, a delayed contraction of the right ventricle due to the right branch bundle block was considered (11, 12). For the end-diastolic and end-systolic phases, all ventricular contours were drawn manually on the short axis cine stack from the aortic/pulmonary valve to the left ventricular/right ventricular apex, with trabeculation assigned to the blood pool (18-20). Afterward, end-diastolic volume and end-systolic volume, as well as stroke volume = (end-diastolic volume–end-systolic volume) was calculated automatically by the software for both ventricles. Ejection fraction was derived according to the following formula: Ejection fraction = (end-diastolic volume-end-systolic volume) × 100 / end-diastolic volume. All calculated volumes were normalized to the body surface area (body surface area): left ventricular / right ventricular end-diastolic volume / body surface area, left ventricular / right ventricular end-systolic volume / body surface area and left ventricular / right ventricular stroke volume / body surface area.
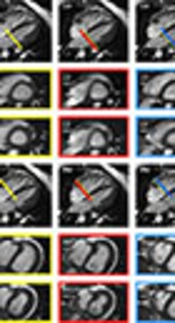
The volume measurements and functional parameters of the original analysis were used as reference values, representing group I. Subsequently, re-evaluations were performed with systematic variation of the basal plane by ± one slice in both ventricles as illustrated schematically in Figure 1. This was done in the end-diastolic and end-systolic phase, corresponding to four different groups each ventricle (groupII left ventricular (LV)) = +1 slice end-diastolic, group IIILV = -1 slice end-diastolic, group IVLV = +1 slice end-systolic, group VLV = -1 slice end-systolic, group IIRV = +1 slice end-diastolic, group IIIRV = -1 slice end-diastolic, group IVright ventricular (RV) = +1 slice end-systolic, group VRV = -1 slice end-systolic. After each variation end-diastolic volume, end-systolic volume, stroke volume (absolute and normalized to body surface area) and ejection fraction were re-calculated and the differences (absolute and relative) for end-diastolic volume, end-systolic volume, stroke volume and ejection fraction were computed.
 and right ventricle (bottom row) with the corresponding short axis views. Images were acquired with steady-state free precession (SSFP) sequence. The thickness of the bars correlates with a slice thickness of 5 mm. The yellow bars and framings indicate the selection of the basal plane for the original measurements, serving as reference values. The blue bars and framings signalize the variation of the basal plane minus one slice in end-diastolic (ED) or end-systolic (ES) phase. Furthermore, the red bars and framings mark the variation of the basal plane plus one slice in ED or ES phase. (LV, left ventricular; RV, right ventricular; EDV, end-diastolic volume; ESV, end-systolic volume).")
Scheme of the basal plane variation. Scheme of the basal plane variation in the four-chamber view for the left ventricle (top row) and right ventricle (bottom row) with the corresponding short axis views. Images were acquired with steady-state free precession (SSFP) sequence. The thickness of the bars correlates with a slice thickness of 5 mm. The yellow bars and framings indicate the selection of the basal plane for the original measurements, serving as reference values. The blue bars and framings signalize the variation of the basal plane minus one slice in end-diastolic (ED) or end-systolic (ES) phase. Furthermore, the red bars and framings mark the variation of the basal plane plus one slice in ED or ES phase. (LV, left ventricular; RV, right ventricular; EDV, end-diastolic volume; ESV, end-systolic volume).
3.3. Statistical Analysis
For all groups, right ventricular and left ventricular end-diastolic volume, end-systolic volume and stroke volume values (including values normalized to body surface area) were calculated. Due to the proven normal distribution of the ventricular volume values by Shapiro-Wilk-test (P > 0.05), the values were compared using the Student’s t-test for paired values. Relative differences in percent for end-diastolic volume, end-systolic volume, stroke volume and ejection fraction were computed according to the following formulas (for example group IVLV):
Left ventricular end-diastolic volume difference in % = (left ventricular end-diastolic volume group I-left ventricular end-diastolic volume group IVLV) × 100 / left ventricular end-diastolic volume group I.
Left ventricular end-systolic volume difference in % = (left ventricular end-systolic volume group I-left ventricular end-systolic volume group IVLV) × 100 / left ventricular end-systolic volume group I.
Left ventricular stroke volume difference in % = (left ventricular stroke volume group I-left ventricular stroke volume group IVLV) × 100 / left ventricular stroke volume group I.
Left ventricular ejection fraction difference in % = (left ventricular ejection fraction group I-left ventricular ejection fraction group IVLV) × 100 / left ventricular ejection fraction group I.
Furthermore, all groups were divided separately into those with normal ventricular function (right ventricular ejection fraction ≥ 50%, left ventricular ejection fraction ≥ 60%) and reduced ventricular function (right ventricular ejection fraction < 50%, left ventricular ejection fraction < 60%) (18, 21). Differences in frequencies were analyzed applying the McNemar’s test.
To assess the interrater correlation between both observers, the intra-class correlation coefficient ICC (3, 1), absolute-agreement and two-way mixed effects were calculated across all measured parameters.
The statistical software SPSS 17.0 (SPSS Inc., Chicago, IL, USA) and WinSTAT® (Robert Fitch, Bad Krozingen, Germany) were used.
Data are presented as mean ± standard deviation unless otherwise indicated. P < 0.05 was considered statistically significant.
4. Results
Compared to the reference values (group I), each basal plane variation - both in end-diastolic and end-systolic phase - caused significant changes (P < 0.005) of end-diastolic volume, end-systolic volume and stroke volume absolute and normalized to body surface area. The difference was up to 15.2% ± 5.8 for the left ventricle and up to 17.4% ± 6.1 for the right ventricle. Furthermore, the calculated stroke volume changed up to 19.2% ± 6.3 for the left ventricle and 22.7% ± 7.2 for the right ventricle. Based on these figures, the ejection fraction of both ventricles varied significantly too (P < 0.005). The difference was up to 19.1% ± 8.2. All results including relative differences and percentages are shown in Table 1 (end-diastolic volume, and end-systolic volume), Table 2 (stroke volume) and Table 3 (ejection fraction).
| LV | EDV, mL b | EDV / BSA, mL/m2b | Difference percent, % b | P value |
|---|---|---|---|---|
| Group I, mL c | 122.2 ± 37.9 | 74.2 ± 13.9 | 0 | |
| Group IILV, mL d | 132.4 ± 40.3 | 80.5 ± 15.3 | +8.5 ± 3.1 | < 0.005 |
| Group IIILV, mL e | 109.0 ± 35.0 | 66.0 ± 12.5 | -11.0 ± 3.0 | < 0.005 |
| LV | ESV b | ESV / BSA, mL/m2b | Difference percent, % b | P value |
| Group I, mL c | 52.7 ± 23.8 | 31.6± 11.1 | 0 | |
| Group IVLV, mL f | 59.9 ± 25.3 | 36.0 ± 11.8 | +15.2 ± 5.8 | < 0.005 |
| Group VLV, mL g | 45.5 ± 21.9 | 27.0 ± 10.1 | -15.0 ± 4.7 | < 0.005 |
| RV | EDV b | EDV / BSA, mL/m2b | Difference percent, % b | P value |
| Group I, mL c | 203.5 ± 71.1 | 125.7 ± 37.8 | 0 | |
| Group IIRV, mL d | 220.3 ± 75.2 | 135.8 ± 38.8 | +8.5 ± 3.5 | < 0.005 |
| Group IIIRV, mL e | 182.7 ± 67.4 | 112.9 ± 36.4 | -10.6 ± 3.2 | < 0.005 |
| RV | ESV b | ESV / BSA, mL/m2b | Difference percent, % b | P value |
| Group I, mL c | 110.5 ± 51.9 | 67.5 ± 28.0 | 0 | |
| Group IVRV, mL f | 125.5 ± 54.1 | 76.8 ± 28.7 | +16.5 ± 10.4 | < 0.005 |
| Group VRV, mL g | 93.4 ± 49.4 | 56.8 ± 26.7 | -17.4 ± 6.1 | < 0.005 |
Abbreviations: BSA, body surface area; EDV, end-diastolic volume; ESV, end-systolic volume; LV, left ventricular; RV, right ventricular; SD, standard deviation
aAny variation of the basal plane caused a statistically significant change of end-diastolic or end-systolic volumes.
bValues are expressed as means ± SD.
cOriginal measurements representing reference values
dMeasurements with one slice more at the heart base in end-diastolic phase
eMeasurements with one slice less at the heart base in end-diastolic phase
fMeasurements with one slice more at the heart base in end-systolic phase
gMeasurements with one slice less at the heart base in end-systolic phase
| LV | SV, mL b | SV / BSA, mL/m2b | Difference, % b | P value |
|---|---|---|---|---|
| Group I, mL c | 69.5 ± 18.2 | 42.6 ± 6.2 | 0 | |
| Group IILV, mL d | 79.7 ± 20.1 | 48.9 ± 7.2 | +14.9 ± 6.4 | < 0.005 |
| Group IIILV, mL e | 56.3 ± 16.6 | 34.5 ± 6.2 | -19.2 ± 6.3 | < 0.005 |
| Group IVLV, mL f | 62.3 ± 17.0 | 38.2 ± 6.0 | -10.5 ± 3.0 | < 0.005 |
| Group VLV, mL g | 76.7 ± 19.2 | 47.1 ± 6.7 | +10.8 ± 4.5 | < 0.005 |
| RV | SV, mL b | RV / BSA, mL/m2b | Difference, % b | P value |
| Group I, mL c | 93.0 ± 23.4 | 58.2 ± 13.8 | 0 | |
| Group IIRV, mL d | 109.8 ± 28.4 | 68.3 ± 14.8 | +18.1 ± 7.9 | < 0.005 |
| Group IIIRV, mL e | 72.2 ± 20.5 | 45.4 ± 12.9 | -22.7 ± 7.2 | < 0.005 |
| Group IVRV, mL f | 78.0 ± 22.3 | 48.9 ± 13.7 | -16.8 ± 7.6 | < 0.005 |
| Group VRV, mL g | 110.1 ± 26.1 | 68.9 ± 15.2 | +19.1 ± 8.2 | < 0.005 |
Abbreviations: BSA, body surface area; LV, left ventricular; SV, stroke volume; RV, right ventricular; SD, standard deviation
aAny variation of the basal plane caused a statistically significant change of left (LV) and right ventricular (RV) stroke volume.
bValues are expressed as means ± SD.
cOriginal measurements representing reference values
dMeasurements with one slice more at the heart base in end-diastolic phase
eMeasurements with one slice less at the heart base in end-diastolic phase
fMeasurements with one slice more at the heart base in end-systolic phase
gMeasurements with one slice less at the heart base in end-systolic phase
| LV | EF, %b | Difference, %b | P Value |
|---|---|---|---|
| Group Ic | 58.5 ± 8.5 | 0 | |
| Group IILVd | 61.7 ± 7.9 | +5.85 ± 3.1 | < 0.005 |
| Group IIILVe | 53.3 ± 9.9 | -9.40 ± 4.8 | < 0.005 |
| Group IVLVf | 52.5 ± 8.5 | -10.45 ± 3.0 | < 0.005 |
| Group VLVg | 64.5 ± 8.1 | +10.76 ± 4.5 | < 0.005 |
| RV | EF, %b | Difference, %b | P Value |
| Group Ic | 47.8 ± 9.4 | 0 | < 0.005 |
| Group IIRVd | 51.8 ± 9.1 | +8.76 ± 4.2 | < 0.005 |
| Group IIIRVe | 41.6 ± 10.4 | -13.66 ± 5.7 | < 0.005 |
| Group IVRVf | 39.8 ± 8.9 | -16.80 ± 7.6 | < 0.005 |
| Group VRVg | 56.6 ± 9.5 | +19.14 ± 8.2 | < 0.005 |
Abbreviations: EF, ejection fraction; LV, left ventricular; RV, right ventricular; SD, standard deviation
aAny variation of the basal plane caused a statistically significant change of left (LV) and right ventricular (RV) ejection fraction (EF).
bValues are expressed as means ± SD.
cOriginal measurements representing reference values
dMeasurements with one slice more at the heart base in end-diastolic phase
eMeasurements with one slice less at the heart base in end-diastolic phase
fMeasurements with one slice more at the heart base in end-systolic phase
gMeasurements with one slice less at the heart base in end-systolic phase
Table 4 and Figure 2 depict that every variation of the basal plane led to a significant shift of right ventricular and left global ventricular function from normal to reduced or vice versa (P < 0.05).
| LV | Normal EF b,c | Reduced EF b,d | RV | Normal EF b,e | Reduced EF b,f |
|---|---|---|---|---|---|
| Group I g | 11 (42.3) | 15 (57.7) | Group I g | 11 (42.3) | 15 (47.7) |
| Group IILVh | 17 (65.4) | 9 (34.6) | Group IIRVh | 18 (69.2) | 8 (30.8) |
| Group IIILVi | 6 (23.1) | 20 (76.9) | Group IIIRVi | 5 (19.2) | 21 (76.9) |
| Group IVLVj | 5 (19.2) | 21 (80.8) | Group IVRVj | 5 (19.2) | 21 (76.9) |
| Group VLVk | 19 (73.1) | 7 (26.9) | Group VRVk | 22 (84.6) | 4 (15.4) |
Abbreviations: EF, ejection fraction; LV, left ventricular; RV,right ventricular SD, standard deviation
aData are numbers of patients and numbers in parentheses are relative frequencies. Any variation of the basal plane caused a statistically significant change of the left (LV) and right ventricular (RV) function categorization based on the ejection fraction (EF) (P < 0.05).
bValues are expressed as No.(%).
cLV-EF ≥ 60 %.
dLV-EF < 60 %.
eRV-EF ≥ 50 %.
fRV-EF < 50 %.
gOriginal measurements representing reference values
hMeasurements with one slice more at the heart base in end-diastolic phase
iMeasurements with one slice less at the heart base in end-diastolic phase
jMeasurements with one slice more at the heart base in end-systolic phase
kMeasurements with one slice less at the heart base in end-systolic phase
 with group II (measurement with one slice more at the heart base in end-diastolic phase), group III (measurement with one slice less at the heart base in end-diastolic phase), group IV (measurement with one slice more at the heart base in end-systolic phase) and group V (measurement with one slice less at the heart base in end-systolic phase) according to two categories indicated by the left ventricular (LV) and right ventricular (RV) ejection fraction (EF): LV EF ≥ 60% = normal LV function (light grey), LV EF < 60% = reduced LV function (black); RV EF ≥ 50 % = normal RV function (light grey), RV EF < 50 % = reduced RV function (black).")
Comparison of the ventricular function assessment. Comparison of group I (original assessment of ventricular function, serving as reference values) with group II (measurement with one slice more at the heart base in end-diastolic phase), group III (measurement with one slice less at the heart base in end-diastolic phase), group IV (measurement with one slice more at the heart base in end-systolic phase) and group V (measurement with one slice less at the heart base in end-systolic phase) according to two categories indicated by the left ventricular (LV) and right ventricular (RV) ejection fraction (EF): LV EF ≥ 60% = normal LV function (light grey), LV EF < 60% = reduced LV function (black); RV EF ≥ 50 % = normal RV function (light grey), RV EF < 50 % = reduced RV function (black).
We calculated the intraclass correlation coefficient ICC (3, 1), absolute-agreement and two-way mixed effects, to assess the interrater correlation between both observers, resulting in 0.890 (0.830 - 0.928, 95% confidence interval). These findings were in accordance to the literature (2, 22).
5. Discussion
In the present study, a systematical variation of the basal plane ± one slice was done in each ventricle to demonstrate its impact on the evaluation of cardiac performance parameters with the short axis plane method. The results showed that every variation of the basal plane caused a significant change of cardiac performance parameters (P < 0.005). The difference was up to 17.4% ± 6.1 for ventricular volumes, up to 22.7% ± 7.2 for stroke volume and up to 19.1% ± 8.2 for the ejection fraction.
Cardiac MRI is considered as the modality of choice for the assessment of right ventricular volumes and right ventricular ejection fraction (5, 6, 23). In CHD patients, right ventricular function represents an independent marker for the long-time outcome (24-26). Alterations in right ventricular function have a potential prognostic and clinical impact especially in the management of patients (27). In patients with acquired heart diseases, the cardiac MRI studies are mostly focused on the left heart. Nevertheless, right ventricular function represents also a predictive value for the outcome in patients with acquired heart diseases, ischaemic cardiomyopathies, pulmonary hypertension, arrhythmogenic right ventricular dysplasia, valvular heart diseases, myocarditis and dilated cardiomyopathies (8, 9, 28). Furthermore, underscoring of ventricular performance parameters like right ventricular end-diastolic volume index (RVEDVI), right ventricular ejection fraction (RVEF) and left ventricular ejection fraction (LVEF) can have severe consequences on patient management, such as on timing of surgical intervention or feasibility of pregnancy as known from the literature (29-31).
Therefore, an accurate estimation of right ventricular volumes and ejection fraction in addition to a proper evaluation of the left ventricular function is of pivotal importance in the follow-up of patients with CHD (32, 33) and, increasingly, in patients with acquired heart diseases (8, 9, 34, 35). As recommended by Lotz et al., the selection of the basal plane is one of the critical picture elements in the evaluation of cardiac MRI (10). Childs et al. mentioned that partial volume effects lead to problems to define the most apical and basal plane (6). Furthermore, the distinction between the ventricle and atrium can be unclear due to the through-plane motion of the atrioventricular valve (29). Therefore, the intra- and interobserver variability of the functional assessment of both ventricles is affected by the selection of the basal slice. This error is more striking for the right ventricle than for the left one (28).
Analysing the categorized ventricular performance (normal: left ventricular - ejection fraction ≥ 60 %; right ventricular - ejection fraction ≥ 50 %, or reduced: left ventricular - ejection fraction < 60 %; right ventricular - ejection fraction < 50 %), there was a significant shift of the assessment between group I and all other groups (P < 0.05). For example, 42.3 % of patients in group I was graded with normal left ventricular function, as opposed to 19.2% in group IVLV. And as an example for the right ventricle, 42.3 % of patients in group I was classified with normal right ventricular function, as opposed to 84.6 % in group VRV.
Due to the methodical approach, it was sometimes evident that the varied basal plane was not the correct one. However, there were also critical cases in which the delineation of the basal plane was not clear. This partly tricky selection of the basal plane has also been described in previous studies (29, 36). If there are any discrepancies between the short axis volume measurements and the velocity encoded gradient echo imaging measurements, an incorrect selection of the basal plane should always be taken into account. However, other sources of error should also be considered, such as a non-acclaimed right bundle branch block, valve insufficiencies, unknown shunts or a possible failure of velocity-encoded gradient echo imaging for example due to turbulent blood flow.
Volumetric analysis of the ventricles can be performed using the axial plane method as an alternative. Recent studies recommend that volume measurements done by the axial plane method are more reliable than measurements with the short axis method (28, 29). Due to the applicable guidelines at the period in which this study’s cardiac MRI examinations were conducted (between August 2009 and September 2011), the volume measurements were done in a stack of short axis slices. In particular, at the beginning of this period, axial plane series were not carried out. Therefore, no corresponding comparison between the performance parameters acquired with a short axis and axial plane method could be executed (1, 37). However, it is apparent that the distinction between the atrium and ventricle in the axial plane method is substantially better than in the short axis method because both structures are visible in one slice (29).
To achieve a homogeneous study population, just patients with corrected tetralogy of Fallot have been included. Thus, the study group was relatively small and included only one group of patients. Of course, results cannot be directly exchanged for other patient groups or to a healthy population. However, the method is in principle the same, and similar results can be assumed.
Basal plane selection is part of image post-processing and does not affect cardiac MRI image acquisition. Therefore, retrospective study design as a formal limitation is of minor importance. Even in a prospective design, acquired data have to be post-processed several times.
In conclusion, this study demonstrates that variation of the basal plane by just one slice in cardiac MRI short axis method leads to statistically significant changes in the resulting cardiac performance parameters. This possible error is more striking for the right ventricle than for the left one and should always be taken into consideration when evaluating and reporting cardiac MRI.
