


.png)
1. Background
Meningiomas are mainly benign (1), however, 20% of these tumors have aggressive clinical and histopathological behaviors (2). The World Health Organization (WHO) criteria has classified meningioma based on histology into three grades: Grade I (benign or low grade), grade II (atypical), and grade III (anaplastic or malignant) (3).
Clinical prognosis is affected by a histological grade of meningioma and the extent of surgical resection. Preoperative knowledge regarding the histological grade of meningioma leads to better tumor resection and even dura substitution in advanced tumors (4). The atypical/malignant tumors are associated with higher recurrence rates, which increase morbidity and mortality (5, 6).
Reliable distinction between benign and atypical/malignant meningioma, based on the imaging features of the tumor on conventional MR images, is not possible. Tumor features such as heterogeneous appearance and enhancement, peritumoral edema, and irregular cerebral surface suggest atypical/malignant tumor, however, they are not specific for higher grade tumors (6, 7).
Preoperative evaluation and treatment planning of different brain tumors can be made by diffusion-weighted imaging (DWI) and apparent diffusion coefficient (ADC) measurements reliably in a non-invasive manner (7). High cellular tumors demonstrate high signal intensity on DWI and low ADC values (8). Increased cellularity in high-grade tumors decreases the extracellular space, which consequently leads to restriction of water diffusion (9). Atypical and anaplastic meningiomas show lower ADC values compared to low-grade tumors (3). However, the results reported in the literature are controversial about the ability of ADC values in distinguishing low-grade vs. high-grade meningioma (3).
2. Objectives
In this study, we intended to study ADC and first-order histogram (FOH) feature extraction method in discrimination of histological types (benign vs. malignant) of meningioma.
3. Patients and Methods
3.1. Study Design, Patients, and Histopathological Analysis
MR images of all patients diagnosed with intracranial meningioma by histopathological examination between August 2015 and January 2016, at our neurologic surgery referral university hospital, were examined. After searching the pathology department database, 62 patients with a mean age of 44 years were included. The histopathological grade of the tumors was determined based on the WHO 2007 classification system for meningioma (10). Based on the histopathology reports, 25 patients had atypical/malignant tumors and 37 had benign meningioma. We excluded the patients with incomplete or low-quality pre-operative MRI and those with previous radiotherapy or radiosurgery.
We proposed a multi-parametric framework for meningioma classification. The proposed scheme consisted of four major stages: (1) Co-registration of ADC map to their corresponding anatomical MRI (post-contrast T1-weighted [T1C] images); (2) delineation of the tumor border by selecting regions of interest (ROIs) on T1C images, creating a mask of tumor, and overlaying the mask on the corresponding ADC-maps; (3) feature extraction and selection; and (4) statistical analysis. The overall approach is shown in Figure 1.
")
Schematic flow diagram of the overall classification framework. (ROI, regions of interest)
3.2. Magnetic Resonance (MR) Imaging and Diffusion-Weighted MR Imaging (DWI)
All patients underwent MR imaging on a 1.5 Tesla system (Siemens®, Avanto, Rel 16.0) using standard head coil. MR images were obtained according to the following tumor protocol in our hospital: Axial and sagittal T1 weighted spin echo (SE) (repetition time [TR]/ echo time [TE] = 400/12 ms), axial and coronal SE T2 weighted images (TR/TE = 3600/97 ms) and axial fluid attenuated inversion recovery images (TR/TE = 4000/117 ms). Diffusion-weighted magnetic resonance imaging echo-planar (DWI-EP) sequence was b values = 800 - 1000. Diffusion-weighted images were performed in the axial plane before the contrast administration, using single-shot multi-slice SE (T2 weighted) echo-planar sequence in 3 orthogonal directions and ADC maps were generated using b-values of 0 and 1000 s/mm2. The following features were obtained in all sequences: A matrix size of 384 ×384, section thickness 5 mm, an inter-slice gap of 1 mm, and field of view of 20 to 24 cm. Post-contrast axial and coronal T1 weighted sequence was performed after intravenous administration of 0.1 mmol gadopentetate dimeglumine per kilogram of body weight.
3.3. First Order Histogram
FOH feature extraction method assumes that each pixel is independent from the neighboring pixels. In this method, features are extracted based on gray‐level value of image pixels within the region of interest (ROI). In order to determine the ROI, the whole tumor margin was delineated manually on contrast-enhanced T1-weighted and anatomical spin echo images by a single radiologist blinded about the histopathology of the tumors. ROIs were not placed in peritumoral edema. Then, ADC maps were co-registered to the counterpart T1C images through rigid intra-subject registration with normalize mutual information (NMI) similarity measure and trilinear transformation method using FSL library of analysis tools (Figure 1) (10).
As seen in Figure 2, which is an example that depicts the histogram of pixel gray‐levels in the ROI of benign and high-grade tumors, the tumorous region in malignant meningioma is different from the benign tumor; therefore, this difference may help us extract some statistical features to discriminate malignant from benign tumors.
")
Histogram of a benign meningioma sketched based on pixel gray-level values in the tumor regions of interest (ROI)
3.4. ADC and NADC Measurements
The whole tumor mean ADC values were measured at the slice with the largest diameter of the tumor. In order to calculate normalized ADC (NADC) (as ratio of ADC to ADC of the normal white matter), uniform ROI was drawn in the matching normal-appearing white matter of contralateral hemisphere to obtain control ADC values. These features generally indicate the gray level values, contrast, and randomness in tumorous region. As Figure 3 depicts, these parameters, which represent gray level in general, contrast, and randomness are different in malignant and benign classes and it is expected that these features help to discriminate malignant and benign meningiomas.
")
Histogram of a malignant meningioma sketched based on pixel gray-level values in the tumor regions of interest (ROI)
3.5. FOH Features
Statistical features extracted included standard deviation, smoothness, third‐moment, uniformity, entropy, kurtosis, and the 25th, 75th, and 95th percentiles of gray level values in tumorous regions. These features are explained in Table 1.
| Extracted feature | Description |
|---|---|
| Standard deviation | Generally indicates the contrast of ROI |
| Smoothness | Shows how gray level changes in ROI |
| Third moment | Degree of asymmetry of a distribution around its mean |
| Uniformity | Shows homogeneity of ROI |
| Entropy | Shows randomness in ROI |
| Kurtosis | Measures the relative peakedness or flatness of a distribution |
| Percentile | In a given ROI, this features indicates the value below the percentage of all given gray level fall |
Description of First Order Histogram Extracted Features
3.6. Statistical Analyses
In order to determine the normal distribution of the variables, a combination of statistical methods including Kolmogorov-Smirnov test, Shapiro-Wilk test, histogram charts, and Quantile-Quantile (Q-Q) plot diagrams were used. The variables with normal distribution were presented as mean (± standard deviation). The non-normal variables were described by median (interquartile range, IQR). To compare normal variables between malignant and benign meningioma groups, student t-test was applied. The Mann-Whitney U test was applied to compare variables with non-normal distribution between the two studied groups. In addition, ROC (receiver operating characteristic) analysis was performed to calculate the accuracy (area under curve), sensitivity, specificity, and positive likelihood ratio of the variables. In all analyses, the significance level was set at 0.05.
3.7. Ethics
Institutional review board (IRB) approval and patient informed consent were not required.
4. Results
4.1. Apparent Diffusion Coefficients
Mean (± Standard deviation [SD]) ADC values in benign and malignant subgroups were respectively 1.05 (± 0.23) and 0.99 (± 0.29) 10-3 mm2/s, P = 0.69. Similarly, no difference was detected regarding minimum, maximum, and median values of ADC between the two groups. Likewise, NADC ratios were not statistically significant between benign (0.5 ± 0.09) and malignant (0.5 ± 0.07) meningioma groups (P = 0.89); Tables 2 and 3.
| Variable | Benign | Malignant | P value | t | Mean difference (95% CI) |
|---|---|---|---|---|---|
| Maximum ADC, 10 - 3 mm2/s | 2.15 (0.48) | 2.11 (0.29) | 0.67 | 0.42 | 0.04 (-0.15 to 0.24) |
| Minimum ADC, 10 - 3 mm2/s | 0.46 (0.20) | 0.44 (0.22) | 0.63 | 0.47 | 0.02 (-0.08 to 0.13) |
| Normalized mean ADC | 0.50 (0.09) | 0.50 (0.07) | 0.89 | -0.13 | -0.003 (-0.04 to 0.04) |
| Entropy | 6.36 (0.43) | 6.44 (0.36) | 0.46 | -0.74 | - 0.07 (-0.29 to 0.13) |
| 25th percentile | 0.42 (0.10) | 0.43 (0.06) | 0.91 | -0.09 | - 0.002 (-0.04 to 0.04) |
| 75th percentile | 0.56 (0.11) | 0.56 (0.1) | 0.85 | -0.18 | -0.004 (-0.06 to 0.05) |
| 95th percentile | 0.72 (0.10) | 0.72 (0.08) | 0.87 | 0.15 | 0.003 (-0.04 to 0.05) |
Comparison of Variables with Normal Distribution Between Benign and Malignant Meningiomaa
| Variable | Benign (N = 37) | Malignant (N = 25) | P value |
|---|---|---|---|
| Mean ADC, 10-3 mm2/s | 1.05 (0.23) | 0.99 (0.29) | 0.69 |
| Median ADC, 10-3 mm2/s | 1.01 (0.27) | 0.93 (0.29) | 0.74 |
| Histogram standard deviation | 0.11 (0.05) | 0.11 (0.03) | 0.65 |
| Smoothness | 0.0000000057 (0.000000064) | 0.000000011 (0.000000094) | 0.18 |
| Third moment | 0.0013 (0.0023) | 0.0013 (0.0017) | 0.72 |
| Uniformity | 536.80 (918.33) | 304.18 (561.18) | 0.59 |
| Kurtosis | 5.77 (5.00) | 5.45 (4.13) | 0.75 |
Comparison of Variables with Non-Normal Distribution Between Benign and Malignant Meningiomaa
4.2. First Order Histogram (FOH) Features
There was no statistically significant difference regarding FOH feature extraction between benign and malignant meningioma. Tables 2 and 3 present comparison of variables with normal and non-normal distribution between the two groups.
4.3. ROC (Receiver Operating Characteristic) Analysis
Table 4 shows accuracy of the variables according to the ROC curve analyses. As depicted, none of the variables of ADC or FOH showed acceptable accuracy to discriminate benign from malignant meningiomas (Figures 4 and 5). Table 5 shows optimal cut-off points with respected sensitivity, specificity, and positive likelihood ratios of the studied variables to differentiate malignant from benign meningioma. None of the variables had acceptable sensitivity and specificity to differentiate benign from malignant meningioma (Figures 6 and 7).
| Variable | Area (accuracy), % | P value | 95% CI for accuracy, % |
|---|---|---|---|
| Mean ADC | 47 | 0.69 | 32 to 61 |
| Maximum ADC | 50 | 0.94 | 36 to 64 |
| Minimum ADC | 47 | 0.7 | 32 to 62 |
| Median ADC | 47 | 0.74 | 32 to 62 |
| Mean normalized ACD | 50 | 0.99 | 35 to 64 |
| Histogram standard deviation | 53 | 0.65 | 39 to 67 |
| Smoothness | 60 | 0.18 | 46 to 74 |
| Third moment | 47 | 0.72 | 32 to 61 |
| Uniformity | 45 | 0.59 | 31 to 60 |
| Entropy | 55 | 0.48 | 40 to 69 |
| Kurtosis | 47 | 0.75 | 32 to 62 |
| 25th percentile | 51 | 0.83 | 37 to 66 |
| 75th percentile | 48 | 0.81 | 33 to 62 |
| 95th percentile | 47 | 0.71 | 32 to 62 |
Area Under Curve, Significance and Confidence Intervals of the Studied Variables by ROC Analysis to Differentiate Malignant Versus Benign Meningioma
| Variable | Optimal cut-off point (Youden index) | Sensitivity, % | Specificity, % | Positive likelihood ratio |
|---|---|---|---|---|
| Mean ADC | 0.98 | 60 | 41 | 1.01 |
| Max ADC | 1.93 | 72 | 38 | 1.16 |
| Min ADC | 0.38 | 68 | 38 | 1.09 |
| Median ADC | 0.92 | 56 | 38 | 0.9 |
| Normalized mean ADC | 0.47 | 64 | 38 | 1.03 |
| His standard deviation | 0.11 | 60 | 55 | 1.33 |
| His smoothness | 0.0000000057 | 72 | 52 | 1.5 |
| His third moment | 0.0011 | 68 | 44 | 1.21 |
| His uniformity | 181.74 | 88 | 27 | 1.2 |
| His entropy | 6.12 | 80 | 41 | 1.35 |
| His kurtosis | 4.91 | 60 | 38 | 0.96 |
| His 25th percentile | 0.38 | 72 | 38 | 1.16 |
| His 75th percentile | 0.48 | 80 | 27 | 1.09 |
| His 95th percentile | 0.68 | 64 | 30 | 0.97 |
Optimal Cut-Off Points and Related Sensitivity, Specificity, and Positive Likelihood Ratios of the Studied Variables to Differentiate Malignant from Benign Meningioma
 curve of mean apparent diffusion coefficient (ADC) values to differentiate benign from malignant meningioma")
Receiver operating characteristic (ROC) curve of mean apparent diffusion coefficient (ADC) values to differentiate benign from malignant meningioma
 curve of normalized mean apparent diffusion
coefficient (ADC) values to differentiate benign from malignant meningioma")
Receiver operating characteristic (ROC) curve of normalized mean apparent diffusion coefficient (ADC) values to differentiate benign from malignant meningioma
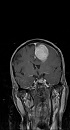
 of a benign meningioma with gadolinium injection. (ADC, apparent diffusion coefficient; DWI, diffusion-weighted imaging; FLAIR, fluid attenuation inversion recovery; GD, gadolinium)")
MRI (T1W) of a benign meningioma with gadolinium injection. (ADC, apparent diffusion coefficient; DWI, diffusion-weighted imaging; FLAIR, fluid attenuation inversion recovery; GD, gadolinium)
 of a malignant meningioma with gadolinium injection. (ADC, apparent diffusion coefficient; DWI, diffusion-weighted imaging; FLAIR, fluid attenuation inversion recovery; GD, gadolinium)")
MRI (T1W) of a malignant meningioma with gadolinium injection. (ADC, apparent diffusion coefficient; DWI, diffusion-weighted imaging; FLAIR, fluid attenuation inversion recovery; GD, gadolinium)
5. Discussion
Here, we intended to determine the diagnostic accuracy of ADC, NADC, and FOH extraction features in differentiating benign from malignant meningioma in adult patients. Our findings showed that neither ADC value nor NADC values were able to differentiate benign vs. malignant meningioma with a reliable sensitivity and specificity. MRI (conventional or advanced sequences) has gained attention in predicting not only the benign vs. malignant nature of intracranial tumors but also in determining the grade of such tumors (11). ADC, measured using diffusion-weighted imaging sequence, has been studied previously in predicting the histological nature of brain tumors (9, 12, 13). ADC, which is calculated automatically by software shows the magnitude of water molecules diffusion. In tumors with high proliferation of tumoral cells, the diffusivity of water molecules reduces. Therefore, owing to his effect, an inverse correlation has been reported between ADC value and tumor cellularity (14). This observation has gained more attention in intracranial tumors. However, controversy is still present in the literature, which to what extent ADC values can be relied upon to differentiate benign and malignant brain tumors.
Here, we decided to study ADC values in meningioma, which along with gliomas are deemed to be the most common histologically diagnosed primary intracranial tumors. In addition to ADC values, another important item measured in the studies is the normalized value of ADC, which is a ratio of the tumor ADC to normal white matter ADC. The NADC ratio is usually calculated to compensate for possible variations in ADC values yielded by different diffusion weighted imaging sequences. Generally, NADC values lower than 1.0 represent restricted water diffusion (9). Some studies reported that these two values are useful in reliable prediction of meningioma grade (7, 9, 15-17), however, others did not report such finding (6, 18, 19). For instance, a value of 0.80 × 10⁻³ mm2/s for ADC was able to differentiate atypical/malignant meningioma from benign meningioma in a study recruiting 25 atypical/malignant and 23 benign meningiomas (9). According to our findings, even though mean ADC value in malignant subgroup (0.99) was lower than that of seen in the benign group (1.05), this difference did not reach a statistical significance. Here, mean NADC in both groups were lower than 1.0, which reflects high cellularity. However, from the statistical view, no difference was observed between benign and malignant meningiomas. Another similar study involving 135 benign and 42 patients with higher grade meningiomas (37 atypical and 5 malignant), in agreement with our results, reported a mean ADC value of 0.99 in benign meningioma and 0.84 in malignant meningioma, with no significant difference (6). Presence of necrosis in the tumors and different places of ROI measurement are some of the probable reasons responsible for this controversy mentioned in the literature (4, 6). Besides meningioma, ADC has not been found useful in differentiating brain lymphoma from metastases (12).
An advantage of the current study compared to previous reports is that we also investigated concurrently the diagnostic accuracy of FOH features. Compared to ADC, these histogram features have not been studied sufficiently in meningioma. Histograms, which show pixels in an image with similar intensity at a defined intensity level, provide statistical information regarding the heterogeneity of a tumor (20). Similar to ADC and NADC, none of the statistical indices showed significant difference between benign and malignant meningiomas. The histogram has been studied in a previous study and the 98th percentile was found to be the most significant feature in distinguishing higher grade gliomas from lower grade ones (21). Uniformity, which was lower in malignant meningioma, is a quantitative feature, which measures the degree of homogeneity of ROI. Heterogeneous enhancement after gadolinium administration is one of the traits of high-grade meningiomas, which is attributed to non-uniform distribution of cells or ischemic necrosis (2, 4). On the other hand, benign tumors are more homogenous compared to malignant types. Our results are compatible with these findings.
Standard deviation was a valuable feature found not to differentiate malignant from benign meningioma. The ROI contrast, which measured by standard deviation quantitatively, was significantly higher in malignant meningiomas than in benign types. As seen in Figure 2, the shape of malignant meningioma histogram was different and wider than benign meningiomas, which reflect the much wider standard deviation in gray levels of malignant tumors. The 75th and 95th percentile of gray level values were the other features, which significantly differentiated meningioma types, especially the 95th percentile of gray level values in this method.
In conclusion, based on the analyses, none of the FOH statistics were significantly different between malignant and benign meningioma group. As cell heterogeneity is a characteristic of malignant cells, efforts have been done to measure this heterogeneity using FOH statistics such as smoothness, kurtosis, and entropy. However, our results showed that FOH was not reliable in differentiating benign from malignant meningioma.
