


1. Background
A pleural effusion mentions collecting of transudative or exudative pleural liquid in the pleural cavity. Transudative pleural effusions (TEs) are mostly due to systemic diseases, whereas exudative pleural effusions (EEs) result from local conditions (1). Recognizing the origins of pleural effusions by pleural liquid analysis is necessity to ensure optimum treatment (1). The diagnosis is built on the basis of biochemical, pathological and clinical findings (2). A biochemical analysis of the liquid acquired by a thoracentesis is mostly the first procedure in TEs from EEs (2). The main contraindication for a thoracentesis is hemorrhagic diathesis. The most common complication of a thoracentesis is a pneumothorax (3). Other frequent complications are chest pain, cough, vasovagal reflux qualified by reduced blood pressure and bradycardia, infections of the pleural blank, hemothoraces due to splenic or hepatic lacerations, lacerations of the intercostal artery, infections of soft tissue, and seeding of tumor cells because of the needle tract (3). Light’s criteria, which is are based on an analysis of lactate dehydrogenase and protein levels in serum and pleural liquid, are the gold standard for differentiating TEs and EEs (4). Concentrations of biochemical components in pleural fluids increase progressively in patients with congestive heart failure receiving diuretic therapy (4). In such patients, misinterpretation of TEs as EEs (29%) in Light’s criteria can be more certainly repaired in the serum-pleural fluid protein gradient (> 3.1 g/dL) than in the serum-pleural fluid albumin gradient (> 1.2 g/dL). In patients with liver cirrhosis misinterpreted as EEs (18%) using Light’s criteria, the diagnostic exactness gained more in pleural fluid/serum albumin ratios (< 0.6) than protein or albumin gradient (5). Additional tests, such as gram staining, culture, and pleural fluid cytology, are essential to assess local factors in EEs (6). In cases of negative cytology, a pleural biopsy may be performed (6, 7). Noninvasive imaging methods can aid the diagnosis in such cases and overcome the need for pleural biopsies and their associated risks. A number of different imaging modalities are available for the differential diagnosis of EEs and TEs. These include conventional magnetic resonance imaging (MRI) build on precontrast signal intensity values in T1-weighted (T1W) and T2- weighted (T2W) images, as well as post-gadolinium T1W images with fat saturation and the measurements of Hounsfield unit in computed tomography (CT). However, the results of these imaging modalities are not reliable (8-11).
Apparent diffusion coefficient (ADC) maps and diffusion-weighted MRI (DW-MRI) can provide indirect information on tissue cellularity based on relative diffusivity of water molecules into the tissues and a quantitative assessment of signal loss (12, 13). The latter depends on restriction of water molecule diffusion through cell membranes and macromolecules (12, 13). The aim of this research was to assess the ability of DW-MRI and ADC maps to differentiate TEs from EEs.
2. Objectives
The aim of this study was to assess the ability of DW-MRI and ADC maps to differentiate TEs from EEs.
3. Patients and Methods
3.1. Study Population
This prospective observational, single-center study consisted of 100 consecutive patients who were referred for MRI at Konya Training and Research Hospital between March 2015 and June 2016 and underwent a chest X-ray, ultrasonography (US), or CT of pleural fluid. Patients with pleural effusions with an anterioposterior diameter < 1 cm were excluded because reliable data could not be obtained due to partial volume effects, inhomogeneities, and motion artifacts (n = 4). Patients with hemorrhagic fluids were also excluded because the fluids would interfere with ADC values (n = 2). In addition, claustrophobic and dyspneic patients were excluded (n = 1). A total of 93 patients with pleural effusions were included in the study protocol (Figure 1). Immediately before thoracentesis, MRI was performed for research purpose prior to aspiration and fluid analyses in the patients who might have a hemorrhagic risk potentially due to a thoracentesis. The patients’ treatment process was not delayed. In patients with bilateral effusions, only the side of the liquid sampling was measured on DW-MRI. All the patients underwent a recognitory thoracentesis. Pleural liquids acquired with thoracentesis were assorted as TEs or EEs based on Light’s criteria and clinical and pathological findings.

Flow chart of the study
Informed composed consent was acquired from all the patients. The research was permitted by the institutional review board (no. 96 - 1).
3.2. MRI Protocol
All MRI studies were executed with a 1.5-T MR imager (Magnetom Area; Siemens AG Medical Solutions, Forchheim, Germany) using an 18-element phased-array body coil. Supine position was used in all patients. First anatomic imaging comprised of transverse, sagittal, and coronal T2W single-shot acquisition (half-Fourier acquisition single-shot turbo spin-echo [HASTE]); repetition time [TR]/echo time [TE]: 200/91 ms; section thickness: 8.0 mm; interslice gap: 1.6 mm; number of signals averaged: 1; field of view: 400 - 500 mm2; matrix size: 256 × 256; integrated parallel acquisition technique factor. DW-MRI was then performed using a multislice, single-shot (SS), respiratory-triggered spin echo (SE), echo planar imaging (EPI) sequence. A set of multiple axial scans of the chest was acquired. The imaging parameters were: TR/TE/number of excitations (NEX), 4000/98/1 MRI, including DW-MRI, consisting of a multisection acquisition with a slice thickness of 6 mm, an intersection gap of 1.8 mm, and an acquisition matrix of 120 × 192. The field of view changed from 380 to 500 mm2. The diffusion gradients were used in three rectangular directions (x, y, and z). The images in DW-MRI were obtained with a diffuse b-factor of 0, 500, and 1000 s/mm2. The DW-MRI scanning time was 3-4 min. The ADC map was computed by mechanically choosing a union of three directions.
3.3. Image Analysis
Quantitative analyses were carried out on a syngo via workstation (Siemens Workstation syngo via View Forum release 3.4-inch system, Germany). The images obtained via MRI were interpreted by a radiologist specialist (Z.K.) who was blinded to the clinical findings and according to the clinical criteria established by Light. An isotropic map was computed by mechanically choosing a union of three directions. The pixel value of these maps represented the ADC value articulated in square millimeters per second. In each patient, diffusion was evaluated in a region of interest (ROI) in three unlike regions. Mean ADC values for pleural liquid were computed by averaging the measurements from the three regions. The ROI was placed in the central of effusion to ensure that the ROI was as large as possible. To escape possible magnetic susceptibility artifacts, ADC values were computed far from lung-fluid interfaces and diaphragmatic areas. To test intraobserver variability, a total of 93 diffusion MRI were reanalyzed 8 - 12 weeks after the first assessment. İntraobserver variability was found as 4.8%.
3.4. Statistical Analysis
Statistical analyses were executed using SPSS version 20.0 software (SPSS, Chicago, IL, USA), and the data were showed as the mean ± standard deviation. The normality of the data distribution was analyzed consuming the Kolmogorov-Smirnov test. An independent Student’s t test was conducted to test for differences between two groups for normally distributed variables. Nonparametrically distributed variable were referred consuming the Mann-Whitney U test. Differences between the categorical variables were determined consuming the χ2 test. Two-tailed P values of less than 0.05 were accepted as statistically significant. A receiver operating characteristics curve analysis was used to evaluate the diagnostic usefulness of ADC values in differentiating EEs and TEs. When a substantial cut-off value was detected, the specificity, sensitivity, negative predictive value, positive predictive value, and diagnostic accuracy were showed. When determining the area under the curve, a 5% type I error level was used to assess the statistically substantial predictive value of the test variables.
4. Results
The mean age of the 93 patients (41 females, 52 males) was 65.8 years (range: 34 - 69, 95%CI = 40 - 62). Thirty-nine patients had a bilateral pleural effusion, 30 patients had a right pleural effusion, and 24 had a left pleural effusion. The maximum thickness of fluid collections ranged between 21 and 105 mm (mean thickness, 36.3 mm) and 25 - 131 mm (mean thickness, 49.7 mm) for EEs and TEs, respectively. Table 1 lists the causes of pleural effusions in the study group. Primary malignancies were detected in 16 patients, as follows: lung cancer (n = 8), ovarian tumors (n = 1), mesotheliomas (n = 2), breast cancer (n = 1), gastric cancer (n = 1), synovial sarcomas (n = 1), and liver tumors (n = 2) (Figures 2A-C and 3A-C). The ADCs of TEs were significantly higher than those of EEs. The difference between the mean ADC values of TEs and EEs was significant (P < 0.01) (Table 2). Figure 4 presents the average and grand average ADC values. The optimum cut-off point for ADC values was 3.51 × 10⁻³ mm2/s, with a specificity of 78% and sensitivity of 90.4% (Figure 5). The negative predictive value, positive predictive value, and diagnostic accuracy of ADC values were 83.9, 86.5, and 84.9%, respectively. Eleven patients with TEs who were receiving diuretic therapy were classified as having EEs according to Light’s criteria, whereas the pleural effusions were classified as TEs according to ADC values. These ADC values agreed with EEs and TEs according to pathological findings. As a result, ADC values were the gold standard in the patients who were receiving diuretic therapy in our study especially.
| Etiology | Transudate (27 females, 25 males) | Exudate (14 females, 27 males) |
|---|---|---|
| Pneumonia | - | 12 |
| Tuberculosis | - | 3 |
| Malignancy | - | 16 |
| Chylothorax | - | 1 |
| Empyema | - | 3 |
| Pulmonary embolism | 1 | 3 |
| Rheumatoid arthritis | - | 1 |
| Acute pancreatitis | - | 1 |
| Intra-abdominal abscess | - | 1 |
| Congestive heart failure | 38 | - |
| Chronic renal insufficiency | 10 | - |
| Previous abdominal surgery | 3 | - |
| Total | 52 | 41 |
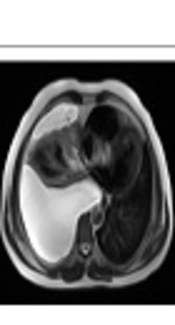
; B, Diffusion weighted imaging (DWI) imaging of right TEs; C, Apparent diffusion coefficient (ADC) imaging of right TEs.")
A 51-year-old man with congestive heart failure on diuretic medication. A, T2 weighted imaging of right transudative effusions (TE); B, Diffusion weighted imaging (DWI) imaging of right TEs; C, Apparent diffusion coefficient (ADC) imaging of right TEs.
; B, Diffusion weighted imaging (DWI) imaging of left EEs; C, Apparent diffusion coefficient (ADC) imaging of left EEs.")
A 67-year-old man with malignant mesothelioma. A, T2 weighted imaging of left exudative effusions (EE); B, Diffusion weighted imaging (DWI) imaging of left EEs; C, Apparent diffusion coefficient (ADC) imaging of left EEs.
| TEs (n = 52) | EEs (n = 41) | P value | Za | |
|---|---|---|---|---|
| ADC (× 10-3 mm2/s) | < 0.01 | -6.883 | ||
| Mean ± SD | 3.71 ± 0.36 | 3.22 ± 0.47 | ||
| 95% CI | 3.64 - 3.78 | 3.12 - 3.31 |
Abbreviations: ADC, apparent diffusion coefficient; CI, confidence interval; EEs, exudative effusions; SD, standard deviation; TEs, transudative effusions
aZ: the number of standard deviations from the mean a data point.
 values of transudative effusions (TEs) and exudative effusions (EEs) are seen.")
The average and grand average apparent diffusion coefficient (ADC) values of transudative effusions (TEs) and exudative effusions (EEs) are seen.
 values is seen (AUC, area under the curve; ROC, receiver operating characteristics; CI, confidence interval).")
The optimum cut-off point for apparent diffusion coefficient (ADC) values is seen (AUC, area under the curve; ROC, receiver operating characteristics; CI, confidence interval).
5. Discussion
Pleural effusions can develop under very different pathological conditions (14). It is important to characterize the pleural effusion and identify its etiology (14). Light’s criteria are applied as the first step in differentiating TEs from EEs (2). Different radiological methods, such as US, CT, and MRI, are available for use in the diagnosis of pleural effusions. US, a readily available and simple to use radiological modality, can be used to detect the localization, presence of septation, and differentiation from masses (15). However, in most cases, it is insufficient to characterize a pleural effusion by calculating CT attenuation values, measuring signal intensities in MRI, and using contrasting contrast agent (8, 9).
DW-MRI has emerged as a new method for the characterization of pleural fluid at a molecular level (16). To the best of our knowledge, there are only two studies in the literature on the application of DW-MRI to pleural fluid analysis (16, 17). One study consisted of 52 patients (16), and the other included 58 patients (17). Both studies reported that ADC values in EEs were significantly lower than those in TEs, with Baysal et al. reporting values of 3.18 × 10⁻³ ± 1.82 and 3.42 × 10⁻³ ± 0.76, respectively, and Inan et al. reporting values of 3.3 × 10⁻³ ± 0.7 and 3.7 × 10⁻³ ± 0.3, respectively. In the present series, the mean ADC of TEs was also significantly higher than that of EEs (3.71 × 10⁻³ ± 0.36 mm2/s and 3.22 × 10⁻³ ± 0.47 mm2/s, respectively). In the study by Baysal et al. (16), the cut-off value for ADC was 3.38 × 10⁻³ mm2/s, and the specificity, sensitivity, negative predictive value, positive predictive value, and diagnostic accuracy rate were 85%, 90.6%, 85%, 90.6%, and 88.5% respectively. Inan et al. (17) reported a cut-off value for ADCs of 3.6 × 10⁻³ mm2/s and specificity, sensitivity, negative predictive value, positive predictive value, and diagnostic accuracy rate of 63%, 71%, 68%, 66%, and 67% respectively. In the present study, the cut-off value for ADCs was 3.51 × 10⁻³ mm2/s. The sensitivity (90.4%) was similar to that reported by Baysal et al. (16) but markedly higher than that found by Inan et al. (17). The specificity (78%) was lower than that reported by Baysal et al. (16) but markedly higher than that reported by Inan et al. (17). The negative predictive value (86.5%), positive predictive value (83.9%), and diagnostic accuracy rates (84.9%) were similar to those found by Baysal et al. (16) but higher than those recorded by Inan et al. (17).
Differences in the content of pleural fluid affects ADC values. Fluid in parapneumonic effusions, malignant effusions, and tuberculosis pleuritis is characterized by proteinosis. Inflammatory cells, malignant cells, lymphocytes, and chylothoraces contain cholesterol crystals. ADC values are generally lower in effusions containing these types of cells, as well as in cells containing lecithin-globulin complexes (6). Conversely, as a result of low viscosity, ADC values are high in TEs (6). Light’s criteria are the gold standard method for distinguishing between TEs and EEs. Although the sensitivity of Light’s criteria is sufficient, the specificity is relatively low, particularly in patients with congestive heart failure and TEs (18). The protein content of pleural fluid increases as a result of diuresis in congestive heart failure treated with diuretics (18). Thus, effusions may be misclassified as EEs (18). According to the literature, 15% - 30% of TEs may be misclassified as EEs consuming Light’s criteria, largely in patients obtaining diuretic therapy (16). Thus, advanced diagnostic methods may be used unnecessarily in some cases of pleural effusions classified as TEs. In the studies conducted by Baysal et al. and Inan et al. (16, 17), TEs in congestive heart failure patients receiving a diuretic were described as false EEs over ADC. The authors attributed this finding to an increase in protein concentrations associated with diuretic treatment. In contrast to the literature (16, 17), in the present study, of 13 patients receiving diuretic therapy, two effusions were classified as TEs, and 11 were classified as EEs according to Light’s criteria, whereas two effusions were classified as EEs, and 11 were classified as TEs based on ADC values. Nine of 11 TEs were classified as EEs according to Light’s criteria, while they were classified as TEs according to ADC values.
A possible explanation for this finding may be that Light’s criteria could be distorted before ADC values. The findings suggest that ADCs may have important diagnostic value in the presence of short-term diuretic use. However, studies with larger numbers of patients are needed to shed light on this issue.
The use of DW-MRI of the thorax has various limitations, such as physiological movement artifacts induced by cardiac and respiratory activities (19). The effects of these activities can be decreased by using pulse-triggered and breath-hold sequences (20). The best-quality images can be achieved through breath hold single shot spin echo planar imaging (SS-SE-EPI) sequences because of rapid acquisition abilities and high signal-to-noise ratio (19-21). Parallel images are vital to reduce distortion of SS-SE-EPI DW-MRI sequences (20). The superior results of the present study as compared with those of earlier studies (16, 17) may be attributed to the use of single shot, respiratory-triggered spin-echo sequences. The aforementioned was not used in the other studies (16, 17). As reported earlier, EPI sequences can lead to anatomic distortions due to their susceptibility effects (19). In a study of 12 patients, Murtz et al. (19) used an SS-SE- EPI sequence with electrocardiography triggering to minimize the effects of cardiac pulsations. They discovered that DW-MRI, which was carried out without pulse triggering, led to a decrease in the exactness of ADC calculations in abdominal organs. Thus, the accuracy of ADC values in plural fluid can be improved by using the pulse-triggering technique. A limitation of the present study was that we did not use pulse-triggered DW-MRI.
We conclude that the ADC value is a noninvasive, reliable, and reproducible imaging parameter, which may be useful in the evaluation and characterization of pleural effusions. As DW-MRI is quick and simple to perform, it can easily be incorporated into cardiac and thoracic examinations. DW-MRI may aid the radiologist in characterizing pleural effusions. The findings of the present study should be confirmed in further studies involving larger series.
