


1. Background
Since its introduction in clinical practice in the mid-1990s, radiofrequency ablation (RFA) has been effectively used in the management of patients with hepatocellular carcinoma (HCC) and liver metastasis (1-6). However, insufficient ablation may eventually result in increased local tumor progression (LTP) (7, 8). Among many predictors for LTP, the amount of the ablative margin (AM) has been reported to be the most significant factor associated with LTP (8-12). To ensure success of the procedure, it is generally required that in addition to ablating the tumor, the normal hepatic parenchyma surrounding the index tumor is included in the ablation zone to a depth of at least 3 - 5 mm (9, 10). Since the LTP tends to occur increasingly in proportion to the tumor diameter, the ultimate goal of the procedure should be to obtain a sufficient size of the ablated zone, especially in HCCs > 2 - 3 cm (13-15). Combined treatment with conventional transcatheter arterial chemoembolization (TACE) and RFA has been reported to be a useful method to expand the RFA zone (13, 16).
Among various imaging modalities, contrast-enhanced CT is routinely used to determine technical success of combined therapy, which involves side-by-side review of post-procedural CT and pre-procedural initial CT, as with RFA alone (9, 17-19). However, in the case of combined therapy, potential accumulation of iodized oil (lipiodol) in the liver parenchyma around the index tumor may directly interfere with imaging evaluation of the treatment efficacy immediately after the procedure (20). During the last decade, several new strategies using MRI to assess treatment response to RFA alone or combined TACE and RFA therapy have been proposed (17, 21-25). magnetic resonance imaging (MRI) has the potential to precisely evaluate the ablation zone immediately after RFA combined with TACE because the effect of lipiodol retention on MRI signal intensity (SI) is minimal (26).
However, few studies have prospectively compared the ability of contrast-enhanced multidetector-row CT (MDCT) with MRI immediately after the procedure to visually differentiate between the AM and index tumor within the RFA zone only in patients who have undergone combined therapy with conventional TACE and RFA.
2. Objectives
The purpose of this study was to prospectively compare MDCT and MRI for evaluation of the AM and index tumor immediately after combined therapy of conventional TACE and ultrasound-guided RFA in patients with HCC.
3. Patients and Methods
3.1. Study Design and Patient Population
This study was a prospective investigation of MDCT and MRI findings of patients who underwent combined therapy of conventional TACE and RFA for HCC at our clinic over the course of 15 months. The study protocol was approved by our institutional review board, and all patients gave written informed consent.
The inclusion criteria were: (1) presence of ≤ 3 HCCs with largest dimension of 2 - 5 cm [13], (2) Child-Pugh class A or B, (3) no tumoral invasion of the portal and hepatic veins, (4) no evidence of metastasis outside the liver, (5) prothrombin time ratio ≥ 50%, (6) platelet count ≥ 50000 cells/mm3, and (7) HCCs accessible with the guidance of percutaneous ultrasonography (9, 13). During the 15-month study period, 59 consecutive patients underwent combined treatment with TACE and percutaneous ultrasound-guided RFA at our clinic. Of the 59 patients, 26 were not included in this study because of failure to provide written informed consent (n = 22), inability to undergo MRI due to poor respiratory cooperation (n = 3), or claustrophobia (n = 1) (Figure 1). Therefore, 33 consecutive patients (27 men and 6 women; age range, 45 - 80 years; mean age, 62.6 ± 9.3 years) with 45 HCCs in whom both contrast-enhanced MDCT and MRI were performed immediately after RFA combined with TACE were finally enrolled (Table 1). With respect to the number of HCCs, 21 patients had a single HCC lesion, whereas 12 patients had two HCCs. The mean size of the HCCs was 2.88 ± 0.64 cm. Diagnosis of the 45 HCCs was confirmed by percutaneous biopsy (n = 7) or typical imaging findings (arterial phase hyper-enhancement accompanied by delayed washout) (n = 38) (27-30).
")
Flow diagram showing selection process for patients enrolled in this study. (RFA, radiofrequency ablation; TACE, transcatheter arterial chemoembolization)
| Characteristics | No. of cases |
|---|---|
| Patients (n = 33) | |
| Age, y | |
| Mean ± SD | 63.3 ± 9.5 |
| Range | 45 - 80 |
| Gender | |
| Male | 26 |
| Female | 7 |
| Etiology of cirrhosis | |
| Hepatitis B virus | 23 |
| Hepatitis C virus | 6 |
| Alcohol | 4 |
| Child-pugh class | |
| Class A | 33 |
| Number of HCC per patient | |
| Single | 21 |
| Two | 12 |
| HCCs (n = 45) | |
| Diameter, cm | |
| Mean ± SD | 2.88 ± 0.64 |
| Range | 2 - 5 |
| Confirmation method | |
| Histology | 7 |
| CT and MR imaging findings | 38 |
| Capsule | |
| Present/absent | 36/9 |
| Location | |
| Segment 2 | 4 |
| Segment 3 | 3 |
| Segment 4 | 4 |
| Segment 5 | 6 |
| Segment 6 | 9 |
| Segment 7 | 5 |
| Segment 8 | 14 |
| Signal intensity on MRI | |
| In-phase T1WI (low/iso/high) | 35/6/4 |
| Opposed-phase T1WI (low/iso/high) | 31/9/5 |
| T2WI (low/iso/high) | 2/5/38 |
Abbreviations: HCC, hepatocellular carcinoma; MRI, magnetic resonance imaging; SD, standard deviation; T1WI, T1 weighted image; T2WI, T2 weighted image
3.2. Transcatheter Arterial Chemoembolization
One interventional radiologist performed TACE using the digital subtraction method (Advantx LCA/LP+; GE Healthcare or Allura Xper FD20; Philips Medical Systems). After localizing the hepatic arterial branches that supply blood flow to the HCCs through common hepatic artery angiography, TACE was conducted after advancing the catheter tip as close to the tumor as possible. For chemoembolization, emulsions of doxorubicin hydrochloride (10 mg) (Adriamycin; Ildong Co. Ltd., Seoul, Korea) and iodized oil (Lipiodol; Guerbet Laboratories, Anulnay-sous-Bois, France) were slowly administered under fluoroscopic guidance until iodized oil appeared in the portal vein branches. The amount of iodized oil was adjusted per size of the index tumor, with a maximum dose of 10 cc. At the end of the procedure, the feeding artery was embolized using Gelfoam powder (Cutanplast; Mascia Brunelli, Milan, Italy) to enhance the effect of chemoembolization.
3.3. Radiofrequency Ablation
RFA was performed 1 day after TACE in all patients. All RFA procedures were conducted under percutaneous ultrasound guidance through a 5 - 1 MHz convex probe. During the procedure, the patients’ hemodynamic status was continuously monitored. Depending on the tumor location, the intercostal or subcostal approach was used for inserting the electrodes under sonographic guidance. The most appropriate approach was chosen such that large vessels near the index tumor were avoided. The artificial ascites technique was performed in 26 (78.8%) of the 33 patients (31). The procedure was performed using a monopolar 200-W radiofrequency generator (VIVA RF Generator; STARmed Co. Ltd. Koyang, Gyeonggi Province, Korea) with the consecutive activation mode and internally cooled electrodes (Well point; STARmed Co. Ltd., Koyang, Gyeonggi Province, Korea). RFA was considered complete when the location of the index tumor was completely covered by a transient hyperechoic cloud on the ultrasound images.
3.4. MDCT and MRI
After completing RFA, MDCT and MRI were performed within 3 and 7 hours, respectively. CT studies were performed using one of two 64-section CT machines (Sensation Cardiac 64, Siemens Medical System or Discovery CT750 HD, GE Healthcare). We randomly assigned one of two CT machines to patients, because the precision and imaging power of two CT machines in the post-procedural evaluation of the liver were considered similar on the basis of preliminary imaging study as well as daily clinical practice. After obtaining unenhanced CT from the hepatic dome to the right hepatic angle, triple-phase (including the arterial, portal venous, and delayed phases) contrast-enhanced CT was performed after intravenous injection of iodinated contrast material, 100 - 150 mL at 3.5 mL/sec through the antecubital vein. Arterial-phase scanning was performed 18 sec after the trigger threshold (100 Hounsfield unit [HU] on the abdominal aorta) was reached. The scan delay for the portal venous and delayed-phase scanning was set at 70-80 and 150 - 180 sec, respectively, after injection of the contrast media.
Scanning parameters for the contrast-enhanced imaging were as follows: beam pitch: 0.8/0.984; nominal section thickness: 3/3.75 mm; table speed: 30.72/40 mm per rotation; gantry rotation time: 0.5/0.5 sec; reconstruction interval: 3/3.75 mm; tube current: 120~350 mA (depending on the body habitus of the patient) and tube voltage: 120/120 kV. Coronal reformatted CT images with 2-mm section-thickness and 2-mm interval were generated for all patients using dedicated software (Advantage Workstation 4.2, GE Healthcare; Navigator, Siemens Medical System).
MRI was performed in all patients using a 3-T MR machine (Magnetom TrioTim; Siemens Medical System, Forchheim, Germany). After obtaining pre-contrast T1- and T2-weighted MR images (axial, coronal, and sagittal planes), patients subsequently underwent contrast-enhanced MRI after intravenous injection of a standard volume (0.1 mmol/kg) of nonspecific extracellular contrast material (gadoterate meglumine, Dotarem, Guerbet) at flow-rate 1.5 mL/sec. After injection of contrast media, scan delay for the arterial, portal, and delayed phases was set at 30, 60, and 100 seconds, respectively. Coronal and sagittal images were additionally obtained at 140 and 180 seconds, respectively. Table 2 shows the imaging parameters of each MRI scan protocol.
| Imaging parameters | 3T (Magnetom TrioTim) |
|---|---|
| T1-weighted imaging (VIBE) | |
| TR/TE, ms (in-phase/opposed phase) | 3.8/2.2/1.3 |
| Section thickness, mm | 3 |
| Flip angle, deg | 9 |
| FOV | 360 × 360 |
| Matrix number | 320 × 240 |
| T2-weighted imaging (HASTE) | |
| TR/TE, ms | 2000/169 |
| Section thickness, mm | 5 |
| Interslice gap, mm | 0.5 |
| Flip angle, deg | 150 |
| FOV | 360 × 360 |
| Matrix number | 320 × 256 |
| Contrast-enhanced imaging (VIBE) | |
| TR/TE, ms | 3.4/1.23 |
| Section thickness, mm | 3 |
| Flip angle, deg | 13 |
| FOV | 360 × 300 |
| Matrix number | 320 × 195 |
Abbreviations: deg, degree (º); HASTE, half-fourier acquisition single-shot turbo-spin echo; FOV, field of view; TR, repetition time; TE, echo time; VIBE, volumetric interpolated breath-hold examination
3.5. Treatment Course and Follow-Up
In cases with immediate post-procedural images showing tumor enhancement and washout around the RFA zone, additional ablation was done to achieve complete ablation of the remnant tumor. Complete coverage of the index HCC by the ablation zone with absence of residual tumor around the RFA zone was regarded as technical success; and absence of nodular arterial enhancement around the RFA zone at 1-month follow-up CT was considered as confirmed technical efficacy (32). In cases with confirmed radiological technical efficacy, imaging surveillance was performed using CT or MRI every 3 months. Patients in whom LTP (newly developed tumor enhancement and washout in or along the RFA zone) and/or new HCCs in the liver were detected were treated with RFA, TACE, or systemic chemotherapy based on the patients’ clinical scenario.
3.6. Image Analysis
Two radiologists independently reviewed both CT and MR images in two separate sessions, in order. The interval between two reading sessions was set at 6 weeks to minimize recall bias. Inter-observer disagreement with regard to image interpretation was resolved on the basis of a third radiologist’s decision. When necessary, the reviewers changed window width and level on the picture archiving and communication system workstation (Marotech 5.4, Seoul, Korea) to determine whether it was possible to detect and localize the index tumor within the ablation zone. Ease of visual discrimination between the AM and index tumor within the RFA zone was categorized as easy (positive target sign) if the index tumor was clearly identified with similar size and shape to those at preprocedural imaging or as difficult (negative target sign) if these criteria were not fulfilled. In cases with positive target sign, the ablation zones were further evaluated with respect to the AM status, which consisted of AM-plus (completely surrounding tumor), AM-zero (partly discontinuous, without bulging tumor portion), and AM-minus (partly discontinuous, with bulging tumor portion) (23).
In MDCT to determine the presence of target sign and AM status, among multiphasic images, portal venous phase images were primarily reviewed. However, in cases with AM status of either AM-zero or AM-minus, arterial and delayed phase images were additionally used to assess the presence or absence of arterial enhancing residual tumor portion accompanied by delayed washout around the ablated zones, respectively. In MR imaging, RFA zones were reviewed primarily using pre-contrast T1-weighted (T1W) chemical shift imaging as well as T2-weighted imaging (T2WI). In cases with AM status other than AM-plus on pre-contrast images, post-contrast MR images were evaluated together with pre-contrast images. In addition, the incidence of the target sign in the MR sequences was correlated with the SI of index tumor at pre-RFA MRI.
3.7. Statistical Analysis
All data were analyzed using Medcalc Version 18.9.1 computer software (Mariakerke, Belgium). Cumulative LTP was calculated using the Kaplan-Meier method. Univariate and multivariate Cox proportional hazards regression were used to evaluate the independent effects of various clinical and imaging features on the LTP. The McNemar test was used to compare the incidence of the target sign between CT and MRI data. Cochran’s Q test was used to determine differences in the presence of positive target sign among the MRI sequences. The log-rank test was used to compare the rates of LTP according to the AM status. The degree of agreement between MDCT and MRI for the incidence of the target sign and classifying the AM status was expressed using kappa coefficients. Statistical significances were considered present when p values were < 0.05.
4. Results
No additional RFA was required in any case on the basis of the findings from immediate post-procedural images. At 1-month follow-up CT, technical efficacy rate was 100% (45 of 45 lesions). During the follow-up period (range, 12.8 to 32.5 months; mean ± standard deviation, 22 months ± 4.7), LTP occurred in five (11.1%) of the 45 RFA zones. Cumulative LTP rates were 0% and 9.1% at 1 and 2 years, respectively.
Regarding the effects of various clinical and imaging features, including the etiology of cirrhosis, Child-Pugh class, size and location of HCCs, presence or absence of capsule, and AM status on MDCT and MRI on the occurrence of LTP, multivariate analysis revealed that the AM status on both MDCT (P = 0.015) and MRI (P = 0.023) were statistically significant factors.
Overall, three cases were referred to third radiologist for final diagnosis. One case was interpreted as having positive and negative target sign on CT images by both reviewers, respectively. This case was finally determined as having negative target sign by third radiologist. However, on MR images, both reviewers equally classified this case into a case with positive target sign and AM-plus status. One case was classified into AM-plus and AM-zero on CT images by both reviewers, respectively. This case was finally categorized as AM-zero by third radiologist. On MR images, this case was equally interpreted as a case showing AM-plus status by both reviewers. One case was classified into AM-plus and AM-zero on MR images by both reviewers, respectively. This case was finally categorized as AM-zero by third radiologist. Both reviewers equally classified this case as AM-zero on CT images.
4.1. Comparison Between MDCT and MRI Regarding Presence of Target Sign
MDCT and MRI revealed positive target sign in 36 (80%) and 40 (88.9%) of the 45 RFA zones and negative target sign in nine (20%) and five (11.1%) cases, respectively (P = 0.387) (slight agreement; k = 0.0, 95% confidence interval = -0.275 ~ 0.275) (Figures 2-4). In the 36 RFA zones with a positive target sign on CT images, the index tumor appeared as a compact (n = 28) or defective (n = 8) lipiodol-retaining lesion surrounded by the peripheral low-attenuating portion of the RFA zone (Figure 2). The size and shape of all lipiodol-retaining lesions were matched with the HCCs visualized on pre-treatment CT images based on the longest and shortest dimension of the lesions, and visual perception in shape of the lesions. In nine RFA zones, it was difficult to visually separate the index tumor from the AM due to amorphic and dense accumulation of hyper-attenuating iodized oil around the index tumor (n = 7) or insufficient lipiodol retention within the tumor (n = 2).
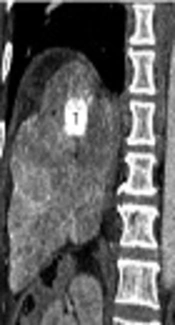
 in the superior segment of the right hepatic lobe. A, Pre-procedural coronal T2-weighted MR image shows a 2.6-cm HCC (T) in the right hepatic dome. B, Post-procedural coronal reformatted CT image demonstrates an index tumor (T) with compact lipiodol uptake in the right hepatic dome that is visually separated from the ablative margin (AM) (*) within the ablation zone. The AM status of was classified as AM-plus. C, Post-procedural coronal contrast-enhanced T1-weighted MR image reveals the index tumor (T) within the ablation zone, which is evident as a low signal intensity (SI) lesion. The AM (*) is visible as an area with high SI and is visually separated from the index tumor. The AM status was classified as AM-plus.")
A 62-year-old woman with a 2.6-cm hepatocellular carcinoma (HCC) in the superior segment of the right hepatic lobe. A, Pre-procedural coronal T2-weighted MR image shows a 2.6-cm HCC (T) in the right hepatic dome. B, Post-procedural coronal reformatted CT image demonstrates an index tumor (T) with compact lipiodol uptake in the right hepatic dome that is visually separated from the ablative margin (AM) (*) within the ablation zone. The AM status of was classified as AM-plus. C, Post-procedural coronal contrast-enhanced T1-weighted MR image reveals the index tumor (T) within the ablation zone, which is evident as a low signal intensity (SI) lesion. The AM (*) is visible as an area with high SI and is visually separated from the index tumor. The AM status was classified as AM-plus.
 in the right hepatic dome. A, Pre-procedural axial T1-weighted MR image shows a 2.4-cm HCC (T) in the right hepatic dome. B, Post-procedural axial CT image shows the index tumor (T) with compact lipiodol uptake in the right hepatic dome. It is difficult to visually discriminate the index tumor from the ablative margin (AM) due to amorphic and dense deposition of hyper-attenuating iodized oil around the index tumor. C, Post-procedural axial in-phase T1-weighted MR image reveals the index tumor (T) within the ablation zone, which is visible as a low signal intensity (SI)lesion. The AM (*) is visible as an area with high SI and is visually separated from the index tumor. The AM status was classified as AM-plus.")
A 49-year-old man with a 2.4-cm hepatocellular carcinoma (HCC) in the right hepatic dome. A, Pre-procedural axial T1-weighted MR image shows a 2.4-cm HCC (T) in the right hepatic dome. B, Post-procedural axial CT image shows the index tumor (T) with compact lipiodol uptake in the right hepatic dome. It is difficult to visually discriminate the index tumor from the ablative margin (AM) due to amorphic and dense deposition of hyper-attenuating iodized oil around the index tumor. C, Post-procedural axial in-phase T1-weighted MR image reveals the index tumor (T) within the ablation zone, which is visible as a low signal intensity (SI)lesion. The AM (*) is visible as an area with high SI and is visually separated from the index tumor. The AM status was classified as AM-plus.
 in the inferior segment of the right hepatic lobe. A, Pre-procedural coronal T2-weighted MR image shows a 2.7-cm HCC (T) in the inferior segment of the right hepatic lobe. B, Post-procedural coronal reformatted CT image shows the index tumor (T) with defective lipiodol uptake in the right hepatic lobe, which is visually separated from the ablative margin (AM) (*) within the ablation zone. The AM status was classified as AM-plus. C, Post-procedural coronal in-phase T1-weighted MR image shows an ablation zone with high signal intensity (SI) (*). However, the index tumor is not perceptible within the ablation zone.")
A 71-year-old man with a 2.7-cm hepatocellular carcinoma (HCC) in the inferior segment of the right hepatic lobe. A, Pre-procedural coronal T2-weighted MR image shows a 2.7-cm HCC (T) in the inferior segment of the right hepatic lobe. B, Post-procedural coronal reformatted CT image shows the index tumor (T) with defective lipiodol uptake in the right hepatic lobe, which is visually separated from the ablative margin (AM) (*) within the ablation zone. The AM status was classified as AM-plus. C, Post-procedural coronal in-phase T1-weighted MR image shows an ablation zone with high signal intensity (SI) (*). However, the index tumor is not perceptible within the ablation zone.
Among 40 cases with positive target sign on MR images, the incidence of positive target sign was significantly higher through in-phase (n = 38, 84.4%) and opposed-phase T1WI (n = 38, 84.4%) than T2WI (n = 10, 22.2%) (P < 0.001). All 10 ablation zones with positive target sign on T2WI exhibited positive target sign on both in- and opposed-phase T1WI. All AMs appeared as areas of high and low SI on post-procedural T1- and T2WI, respectively. However, the SI of the index tumors was variable. When the target sign was correlated with the SI of HCC on pre-procedural MRI, positive target sign was noted in 33 (94.3%) of 35 HCCs and 30 (96.8%) of 31 HCCs with low SI on pre-treatment in-phase and opposed-phase imaging, respectively (Table 3). However, positive target sign was only noted in five (50%) of 10 cases and eight (57.1%) of 14 cases with iso- or high SI on pre-treatment in-phase and opposed-phase T1WI, respectively (Table 3).
| Signal intensity of HCC in pre-procedural MRI | Target sign | |||||
|---|---|---|---|---|---|---|
| In-phase T1WI | Opposed-phase T1WI | T2WI | ||||
| + (n = 38) | − (n = 7) | + (n = 38) | - (n = 7) | + (n = 10) | - (n = 35) | |
| Low SI | 33 | 2 | 30 | 1 | 0 | 2 |
| Isointense | 3 | 3 | 5 | 4 | 1 | 4 |
| High SI | 2 | 2 | 3 | 2 | 9 | 29 |
Abbreviations: HCC, hepatocellular carcinoma; MRI, magnetic resonance imaging; SI, signal intensity; T1WI, T1 weighted image; T2WI, T2 weighted image
4.2. Comparison of the AM Status Between MDCT and MRI
Among the 36 RFA zones that showed positive target sign on MDCT, the AM status was classified as AM-plus (n = 27, 75%) and AM-zero (n = 9, 25%), whereas the 40 ablation zones in which the AM status could be evaluated on MRI scans were categorized as AM-plus (n = 31, 77.5%) and AM-zero (n = 9, 22.5%). The ablation zones with negative target sign were categorized as indeterminate with respect the AM status (Table 4). Of 32 RFA zones that showed positive target sign at both MDCT and MRI, 23 (71.9%) and five (15.6%) were identically categorized as AM-plus and AM-zero, respectively, on both CT and MR images (strong agreement; k = 0.634, 95% confidence interval = 0.307-0.961).
| MRI | |||
|---|---|---|---|
| AM plus (n = 31) | AM zero (n = 9) | Indeterminatea (n = 5) | |
| MDCT | |||
| AM plus (n = 27) | 23 | 2 | 2 |
| AM zero (n = 9) | 2 | 5 | 2 |
| *Indeterminate (n = 9) | 6 | 2 | 1 |
Abbreviations: AM, ablative margin; MDCT, multiple detector computed tomography; MRI, magnetic resonance imaging
a Indeterminate refers to the cases with negative target sign.
The incidence of LTP was closely correlated with the CT- and MR-based classification of AM status on multivariate analysis. LTP occurred in 3.7% and 3.2% of the RFA zones with AM-plus status on CT and MRI, respectively. However, among nine cases with AM-zero status on CT and MRI, LTP was observed in four (44.4%) ablation zones during the follow-up period.
5. Discussion
As in RFA alone, immediately after completion of combined therapy with TACE and RFA, imaging evaluation should be performed to determine the need for additional treatment. Evaluation usually involves assessment of the extent of AM surrounding the index tumor within the RFA zone on CT images. However, it is not always straightforward to determine whether the extent of AM is sufficient or not on the basis of visual comparison of pre- and post-RFA axial CT images. Instead, several alternative strategies have been proposed to overcome the possibility of inherently inaccurate, axial CT-based evaluation of the technical success of RFA (9, 12, 18, 33). These techniques are aimed at pinpointing the exact location of an index tumor within the ablation zone by image fusion of pre- and post-RFA imaging data, thereby enabling an intuitive interpretation of the relationship between the AM and index tumor in a single fused image. However, these image fusion techniques have several drawbacks, such as registration error, prolonged processing time, and poor image quality (18, 33).
In addition to several issues related to post-procedural imaging studies in cases with RFA alone, effect of iodized oil should be considered when evaluating treatment success in cases with combined therapy. When infused via the feeding artery in the liver, lipiodol is preferentially distributed in the index tumor and persists for more than several months owing to a siphoning effect originating from tumor neovascularization and the absence of phagocytosis by Kupffer cells within the tumor (34). Further, lipiodol delivered into the surrounding normal hepatic tissue is stacked up in the portal venules and is cleared within a week (34). Therefore, when iodized oil is used as an embolizing agent, CT-based evaluation is not usually recommended within a month post-procedure because of considerable artifacts generated from lipiodol accumulation in the hepatic parenchyma surrounding the index tumor (20). However, in CT examination of cases with lipiodol retention exclusively in the index tumor, precise localization of the tumor border is possible based on the pattern of lipiodol accumulation (35). Previous studies showed that CT performed at 1-week post-arterial infusion of lipiodol was effective to precisely localize index tumors within the ablation zone (23, 36). Thus, CT images with iodized oil marking on index tumors can be used as reference images to assess the ability of MRI to provide visual discrimination between the index tumor and AM (23).
Meanwhile, in CT images obtained immediately after TACE, the accentuated visibility of the index tumor is compromised because of distribution of lipiodol in both the tumors and the surrounding liver. Moreover, the pattern of accumulation of iodized oil in and around the index tumor changes (disrupted or scattered) in patients undergoing RFA after TACE due to elevated pressure within the ablation zone (37). Thus, the pattern of lipiodol accumulation within the index tumor and adjacent liver may be more unpredictable immediately after combined therapy. In our study, visual discrimination between the index tumor and AM was difficult in 20% of cases due to amorphic and dense accumulation of lipiodol around the index tumor or insufficient lipiodol deposition within the tumor.
During the last decade, several reports have indicated the useful role of MRI in evaluation of the technical success of RFA immediately after the procedure (17, 21-25, 38). The authors noted that the index tumor was visualized within the ablation zone on pre-contrast and ferucarbotran- or gadoxetic acid-enhanced T1WI. According to previous studies, the target sign was visually identified on the MRIs of 64% to 96.4% cases (22, 24, 39). Because iodized oil does not significantly affect the SI of the HCC and surrounding liver and MRI is not subject to artifacts generated by highly accumulated lipiodol (20, 23), the usefulness of MRI in evaluating technical success could be further emphasized in cases of combined therapy with TACE and RFA. Although lipiodol accumulation does not influence the SI on T2WI, De Santis et al. (26) reported that lipiodol retention shortened the T1-relaxation within two to three months after TACE, which may lead to a slight increase in SI at T1WI. However, this effect may be cancelled out when evaluating the presence of target sign within the ablation zone immediately after the procedure because the SI of the ablation zone has tendency to increase with time at T1WI (39).
In our study, MRI showed a positive target sign in 88.9% of lesions, which is comparable to results reported in previous studies evaluating visual separation of the AM and index tumor on the same image after RFA alone (22, 24, 38). An earlier study in which technical success was evaluated using MRI showed that the proportion of cases with positive target sign was similar between the two groups (75% in RFA alone and 81.2% in combined therapy with TACE and RFA) (17). Thus, it is likely that iodized oil retention would not affect the results of the evaluation of treatment efficacy with MRI.
According to a previous study by Koda et al. (22), isointense tumors on pre-RFA T1WI showed a trend of imperceptibility within the ablation zone. In our study, isointense tumors on pre-procedural MRI showed a positive target sign only in 50%, 55.5%, and 20% of in-phase T1WI, opposed-phase T1WI, and T2WI, respectively. In addition, in our study, a positive target sign was observed less frequently in index tumors that showed high and low SI at pre-RFA T1 and T2WI, respectively. Thus, in this situation, technical success needs to be determined according to the presence or absence of a viable tumor portion around the RFA zone on contrast-enhanced T1WI.
As opposed to an assumption that MDCT would be inferior to MRI for evaluating treatment efficacy due to lipiodol-induced artifacts, our findings indicated absence of significant difference between MDCT and MRI in visual discrimination between the AM and index tumor within the ablation zones immediately after combined treatment with TACE and RFA. This result may be partly explained by the relatively small number of cases (15.5%) wherein exact localization of lipiodol-retaining tumors within the RFA zone was not possible due to hindrance of irregular distribution of lipiodol around the index tumors.
Our results suggested that imaging evaluation immediately after combined therapy should be performed as follows: First, contrast-enhanced CT is performed to evaluate AM and treatment efficacy; in cases with difficult visual separation of the index tumor with lipiodol marking within the ablation zone, unenhanced T1WI is acquired; and in cases with non-detection of index tumor within the RFA zone on T1WI, technical success should be assessed using contrast-enhanced T1WI.
This study has several limitations. First, histological confirmation of the AM and index tumors was not obtained in all patients. Second, overall survival rate was not compared according to AM status. However, in view of the study’s purpose, this may not be a significant drawback in terms of the results obtained. Third, diffusion-weighted MR imaging and subtraction technique between pre- and post-contrast enhanced MR images were not used for evaluating the RFA zones. Fourth, we did not evaluate progressive changes in the pattern of lipiodol accumulation and the SI of the index tumor and AM within the ablation zone at increasing post-procedure time points. Therefore, the results of this study might not be directly applicable to imaging findings at > 7-hour after combined therapy with TACE and RFA.
In conclusion, MDCT and MRI had equivalent ability to differentiate between the AM and index tumor within the ablation zones immediately after RFA combined with TACE. Thus, the two imaging modalities may be complementary assessment tools of treatment efficacy after the procedure.
