


1. Background
Since the advent of fetal magnetic resonance imaging (MRI), this method has been established as a problem-solving tool for placental ultrasound in order to assess possible fetal anomalies (1-5). As an adjunct to conventional MRI, diffusion weighted imaging (DWI) has been increasingly used in imaging of the fetal brain and recently also the fetal kidney (6-8). Conventional MR as well as DWI has however been only recently and sparingly used in the evaluation of the placenta (9). Utilization of MR in the placenta has been mainly restricted to evaluation of placental masses and to assessment of suspected myometrial invasion in cases of placenta accreta (10-12). Normal placental maturation has been a topic rarely described in MRI (13, 14).
More recently, however, there have been attempts to link fetal growth retardation to placental morphology as well as placental apparent diffusion coefficient (ADC) values (15, 16). Any attempt for diagnosis of placental insufficiency using DWI images or ADC values should be derived from values of placental ADC in the normal population (17-20).
In their study of placental DWI in fetal growth retardation and placental insufficiency, Bonel et al. used the ADC value threshold of their own high risk population due to the lack of normal values in the literature (16). Manganaro et al. evaluated ADC values in relation to gestational age (GA). Although they found an inverse relationship between ADC values obtained from b values of 0, 200 and 700 with gestational age, they concluded that ADC maps could not be considered a marker for placental insufficiency since the values were affected by perfusion rather than diffusion effects (21).
2. Objectives
To the best of our knowledge this has been the only attempt to establish a normal ADC value for placenta in correlation with fetal age. Also, as far as we know, ADC values of the placenta have not yet been correlated with Grannum classification. The purpose of this study was to investigate possible correlation of ADC values of normal placentas with different gestational ages and various Grannum grades.
3. Patients and Methods
3.1. Patient Selection
Our institutional ethics committee waived informed consent for the retrospective evaluation of MR images. Women referred for fetal MRI during September 2011 to 2012 were included in this study. All the women with singleton pregnancies referred for fetal MRI with no apparent fetal anomaly with offsprings who were also normal both in prenatal and postnatal follow up were included in the study. These included 19 fetuses with suspected borderline isolated ventriculomegaly, 11 fetuses with suspected vermian hypogenesis, two fetuses with suspected lung masses, three fetuses with increased alpha-fetoprotein (AFP) but normal ultrasound, and three fetuses with normal ultrasounds and anomalies in previous siblings. All fetuses were proven normal post-delivery.
Exclusion criteria which were considered in this study were as follows: any placental abnormality suspected in ultrasound or MRI, evidence of fetal growth retardation (estimated fetal weight in ultrasound < 5th percentile or low birth weight at time of delivery), abnormal fetal Doppler study, multiple pregnancy, sub-placental or sub-chorionic hemorrhage, aneuploidy or underlying maternal systemic illness. Gestational age was based on either first trimester ultrasound (preferable) or last menstrual period (LMP), whichever available.
3.2. Ultrasound Study
The placenta was evaluated trans-abdominally using a 3 - 5 MHz curved array transducer. For each placenta location, maximal thickness, subjective shape, and Grannum classification was assessed (13). The placenta was also evaluated for possible infarcts, and placental (subplacental, placental or subchorionic) hemorrhage which were considered exclusion criterion.
3.3. MRI Study
All MRI’s were performed on a 1.5 T Siemens Avanto Magnet with a 4 channel body coil. Mothers with GA of 20 weeks or above were examined in the right tilt position. Images included T2 half-fourier acquisition single-shot turbo spin-echo (HASTE) and true fast imaging with steady state precession (True FISP) images 6 mm thick axial, coronal and sagittal planes to the patient’s body. T2 HASTE and Trufisp images were also taken with 4 mm slice thickness relative to specific fetal body part being evaluated. T1 fast low angle shot (FLASH) images were also obtained in at least one plane based on clinical indication.
The placenta was assessed in HASTE images for maximal thickness, subjective shape (flat, globular, intermediate) and the presence of possible infarcts, and placental hemorrhage. Maximal thickness of the placenta was measured in the best plane based on the location of the placenta as a routine assessment to identify grossly abnormal placentas and fetuses at risk for intra uterine growth retardation (IUGR). Placentas were also evaluated for Grannum grading and signal intensities based on the method previously published by Blaicher et al. (14).
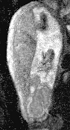
DWI images were acquired with two b value series of 0, and 1000, and 50, 400, and 800 in the plane containing largest artifact-free visible placental surface copying the corresponding T2 HASTE image position. Freehand regions of interest (ROI) were drawn on the largest possible placental surface in three adjacent slices. In order to draw the ROI’s, we scrolled through the best representative images in which the imaging plane was perpendicular to the myometrium. We did not attempt to exclude normal venous lakes or small fibrin deposits. There were no placental infarctions to exclude in the ROI’s as per the exclusion criteria. The ROI’s were then measured on ADC maps by cutting and pasting the ROI first drawn on the b0 image (Figure 1). The ADC value attributed to each placenta was the average of the three separately measured slices. Images were qualitatively evaluated by two radiologists with a minimum of 6 years experience in gynecologic imaging and MRI in consensus. ROI’s were drawn by a 3rd year radiology resident and all ROI’s were double checked by one of the participating radiologists (S.S).
 map")
A 21-year-old female who was referred for evaluation of borderline ventriculomegaly with no anomaly detected. She had an uneventful pregnancy. A, b-value = 50; B, b-value = 400; C, b-value = 800; and D, Apparent diffusion coefficient (ADC) map
3.4. Statistical Methods
ADC values for each set of b values were plotted against GA and Grannum grading. The correlation was assessed using linear regression (for GA) and Kruskal-Wallis (for Grannum grades). The Grannum grades were also correlated with corresponding ADC values using the Spearman rank correlation. Mean ADC values ± standard deviation (SD) was calculated for each Grannum grade.
4. Results
All values are presented as mean ± standard deviation. A total of 66 patients underwent fetal MRI during the time interval of the study. 28 fetuses were excluded from the study; the details of which are demonstrated in Table 1.
| Exclusion criteria | Patients |
|---|---|
| Fetal anomalies | 18 (64.29) |
| Absence of DWI images | 3 (10.71) |
| Technically inadequate/non-diagnostic study | 4 (14.29) |
| Fetal growth restriction based on ultrasound diagnosis | 2 (7.14) |
| Fetal growth restriction based at birth | 1 (3.57) |
Number and Percentage of Excluded Patientsa
Gestational age and maternal age for normal fetuses were 25.54 ± 5.22 (range, 18 to 37 years) and 28.38 ± 5 (range, 16.4 to 35.1 weeks) respectively. The mean time interval between the MRI and last ultrasound was 10 days ± 6.2. The number of patients in each Grannum grade is detailed in Table 2.
ADC values for three different categories of Grannum grades (0 - 2) using the two mentioned sets of b values are depicted in Figure 2. ADC values obtained from b values of 0, and 1000 shows a significant correlation with gestational age using linear regression (P < 0.001), while the ADC values obtained from b values of 50, 400 and 800, failed to show statistically significant correlation with GA using Kruskal-Wallis (P = 0.076). In addition, ADC values obtained from b values of 0, and 1000 showed a significant correlation with Grannum classification using Kruskal-Wallis and also Spearman rank correlation (P = 0.004 and P = 0.02, respectively), while the ADC values obtained from the b values of 50, 400 and 800 failed to display statistically significant correlation with Grannum classes using Kruskal-Wallis and Spearman rank correlation (P = 0.236 and P = 0.192, respectively) (Table 3). Using linear regression analysis, ADC values obtained from b values of 0, and 1000 shows a better fit correlated with gestational age (R2 = 0.60) than the ADC values acquired from b values of 50, 400 and 800 (R2 = 0.087) (Figures 3 and 4) and (Table 3). The correlation between GA and ADC values was not statistically significant in ADC obtained from either b-value set using linear regression (P = 0.600 and P = 0.087 for the b = 0, 1000 and b = 50, 400, 800 respectively).
| ADC value | Grannum grade (0, 1, 2) | ADC ± SD, sec/mm2 | Correlation of ADC value with Granuma, P value | Correlation with gestational ageb, P value | Correlation with gestational ageb, R2 |
|---|---|---|---|---|---|
| b 0, 1000 | 0.004 | < 0.001 | 0.600 | ||
| 0 | 1.88 ± 0.94 | ||||
| 1 | 1.79 ± 0.11 | ||||
| 2 | 1.66 ± 0.13 | ||||
| b 50, 400, 800 | 0.236 | 0.073 | 0.087 | ||
| 0 | 1.65 ± 0.14 | ||||
| 1 | 1.66 ± 0.18 | ||||
| 2 | 1.55 ± 0.13 |
ADC Values of 38 Placentas in Pregnancies with Normal Outcomes Using Two Sets of b Values in Correlation with Grannum Class and Gestational Age
5. Discussion
Normal interactions between maternal and fetal circulation in the placenta are necessary for maintaining normal fetal growth through a healthy rate of nutrient and oxygen exchange. Impaired invasion of fetal trophoblasts into maternal decidua can hypothetically cause intrauterine growth restriction (IUGR) and is clinically evaluated indirectly by the resulting upstream effects on the uterine color Doppler ultrasound and downstream effects on the fetal circulation caused by hypoxemia and lactic acidosis (22). These changes enhance the widespread use of ultrasonography in diagnosis, follow-up and management of fetuses with IUGR or who are considered high risk for IUGR.
MRI, however was utilized in the diagnosis and management of IUGR much later. Initially due to its superb tissue contrast, MRI was used to evaluate placental morphology. Placental masses, venous lakes and fibrin deposits are better depicted with MRI due to its superb tissue contrast (11). Placental volume and shape in terms of globularity as defined by thickness to volume ratio have also been demonstrated to correlate with fetal or neonatal mortality and growth restriction (15). Based on the visualization of placental hemorrhages, and ischemic lesions, Linduska et al. predicted that MRI would become an effective tool for assessment of placental insufficiency (23).
Similar to other abdominal organs, the role of MRI in the evaluation of the placenta has been evolving from a morphological role to a functional role. With further improvement of supplementary functional MRI, diagnosis and management of pregnancy complications related to the placenta, such as IUGR and preeclampsia can be advanced to the next level. Among the advanced MRI methods which have been recently employed for evaluation of placental function, Dynamic Contrast Enhanced MRI (DCE-MRI) and arterial spin labeling, also blood oxygen level dependent (BOLD), and oxygen enhanced (OE) T1 have been employed with varying degrees of success. Diffusion weighted MRI indirectly assesses the tissue characteristics at the microstructural level (24-27).
DWI is technically practical to obtain and being already incorporated in routine practice is an ideal candidate for functional evaluation of the placenta. Being able to evaluate the microstructure, DWI might be able to assist in facing one of the main challenges of pregnancy i.e. IUGR. Since microsturctural and functional changes precede gross morphological findings, ADC values have a promising role in diagnosis and management of IUGR and other vascular placental conditions including preeclampsia (28).
ADC values of twins with IUGR have been shown to be lower than twins without IUGR (29). Similarly, Bonel et al. found a reduced ADC and restricted diffusion in dysfunctional placentas of growth restricted pregnancies compared to normal pregnancies of the same gestational age. They suggested a need for reference values for normal ADC numbers in the placenta but did not correlate the ADC values with Grannum classification or gestational age (16). In this study, however, we correlated ADC value with Grannum classification and GA and found a significant correlation when we used b values of 0 and 1000. When the minimum value was 50, the resulting ADC value did not correlate with either the GA or the Grannum classification. Unlike the mentioned study, however we included the largest possible free hand drawn ROIs in three adjacent slices and thus included a larger sample volume for each placenta. Inclusion of lower b values most likely causes the correlation to happen by including pseudo-diffusion or the perfusion component which is measurable by intravoxel incoherent motion (IVIM) methods.
Low b values are used in calculation of intravoxel incoherent motion (IVIM) which has also shown a correlation with placental insufficiency (24-27). Since downstream resistance and perfusion affect the flow of uterine artery, it can be concluded that ADC values calculated from low b values, which also have an inherent perfusion-dependant component, might also correlate with the risk of preeclampsia and IUGR. In other words, lower b values reflect pseudo-diffusion as an indicator of intravascular motion of the protons; thus, it can be hypothesized that ADC values extracted from lower b values might have a better correlation with both gestational age and placental pathologies theoretically underlying intrauterine growth retardation. This was the rationale we proposed for the correlation we found between Grannum classification and ADC values in the set of b-values including b0, while such a correlation was not seen in the set with b-values starting from b50 (Figure 2).
 values of 38 placentas in pregnancies with normal outcomes, using two sets of b values, in each of the three different Grannum classes")
Box and whisker chart of apparent diffusion coefficient (ADC) values of 38 placentas in pregnancies with normal outcomes, using two sets of b values, in each of the three different Grannum classes
Since most MRIs were performed in the second trimester, no placenta was graded as Grannum 3 (Table 2). In our study, ADC values obtained from b values of 0, and 1000 have shown a significant correlation with gestational age and Grannum grade using linear regression (Figure 3) and Kruskal-Wallis (also Spearman rank correlation) respectively, while ADC values obtained from b values of 50, 400, and 800 have not shown significant correlation with gestational age (Figure 4) or Grannum grade in this patient population.
 values of 38 placentas in pregnancies with normal outcome using b values of 0 and 1000, showing regression line and with 95% confidence interval lines (R<sup>2</sup> = 0.67)")
Scatter plot of apparent diffusion coefficient (ADC) values of 38 placentas in pregnancies with normal outcome using b values of 0 and 1000, showing regression line and with 95% confidence interval lines (R2 = 0.67)
 values of 38 placentas in pregnancies with normal outcome using b values of 50, 400, 800, showing regression line and with 95% confidence interval lines (R<sup>2</sup> = 0.087)")
Scatter plot of apparent diffusion coefficient (ADC) values of 38 placentas in pregnancies with normal outcome using b values of 50, 400, 800, showing regression line and with 95% confidence interval lines (R2 = 0.087)
We had already excluded obvious pathologies such as hemorrhages and infarctions, but while drawing the ROI’s, we did not exclude the normal placental lesions such as normal venous lakes or small fibrin deposits. The fact that we still found a positive correlation underscores the strength of measurements rather than representing a limitation.
Our study had a number of limitations, the main limitation being the small sample size. Nevertheless, while the small population is a real limitation, the b values of 0 - 1000 show a significant correlation with Grannum classification even in this small number of patients, underscoring the significance of the correlation. In addition, we were not aiming at finding an optimal set of b-values for evaluating the normal placenta, our purpose was to find a correlation between Grannum classification and GA with ADC values. Optimal b-values need to be addressed in further studies. Also based on our small sample size we could not establish a normal value for any GA or trimester.
Whilst the IVIM calculation is a more direct representation of the microperfusion component, these calculations are not directly measurable in daily radiology work and need sophisticated post processing and advanced calculation, whereas ADC values can easily be measured on picture archive and communication system (PACS) workstation. By finding a significant correlation between Grannum grading and thus placental maturation and ADC values, our study suggests a possibility of routine clinical utility of ADC values for evaluation of the functional status of the placenta. Before our results become clinically applicable, normal ranges need to be established for different gestational ages and optimal b-values have to be determined. Further studies with larger sample volumes will be needed before we can make the final conclusion.
In conclusion, while ADC values obtained from the b value set of 50, 400, and 800 did not correlate with Grannum classification and GA, ADC values acquired from the b of 0, and 1000 set show a good correlation with both parameters. ADC values calculated from sets of b-values, which included b 0 might correlate with placental maturity. This could be attributed to application of lower b-values which cover the microperfusion in addition to diffusion characteristics of the tissue. When the lower b-values are included in the set, ADC values correlate significantly with Grannum grades.
