


1. Background
Multiple sclerosis (MS) is a demyelinating disease which involves almost 2.5 million people all around the world (1). The symptoms of this disease vary, depending on the amount and the kind of nerves which are affected by this disease (2). The lesion can be present in both brain and cervical cord of the patients (3-5).
According to many studies, computed tomography (CT) scanning has poor sensitivity in diagnosis, assessment, and categorization of MS lesions, hence its evaluation is merely limited to magnetic resonance imaging (MRI) (6-8). MRI was first applied in the late 1980s to detect MS in the upper cervical cord (9). Today it is believed that MRI of spinal cord can be a suitable tool to provide some information regarding disease development. This information can be valuable in detecting MS in some cases, besides it can be useful to observe treatment effects (10, 11). There are different MR pulse sequences that can detect MS plaques. For instance, in T2 weighted and fluid attenuation inversion recovery (FLAIR), the legions are typically hyperintense. T1 weighted usually shows the legions hypointensly. There are other sequences, such as T2*, diffusion weighted imaging (DWI)/apparent diffusion coefficient (ADC), MR spectroscopy and short tau inversion recovery (STIR) (12, 13).
The consortium of MS centers consensus (CMSC) guidelines has suggested proton density (PD)/T2 weighted sequences as the standard spinal cord MS protocol (14). Some studies declared that the PD sequence is superior to T2 fast spin echo MR imaging in cord lesions (15, 16). However, there are some studies that reported FLAIR to be superior to PD and T2 pulse sequences in brain MRI (17). Others believe that for detecting spinal cord lesions, FLAIR is not sensitive enough and the best choice is STIR (18) because by using STIR sequence, the acquisition time can be reduced and sensitivity can be amplified (19). STIR pulse sequence can suppress the high intensity of fat using the inversion time of around 110 ms. Although the application of STIR pulse sequence is very common in the detection of cervical cord lesions, this pulse sequence is susceptible to artifacts and might result in inter-reader variability in the analysis of lesion burden (20).
The second IR sequence is the T1 weighted phase-sensitive inversion recovery (PSIR), which is an alternative to detect the spinal cord MS plaques. This pulse sequence can produce high contrast between MS plaques and surrounding tissues. A phase sensitive reconstruction performs for PSIR which produce a greater dynamic range of signal intensities that leads to a higher tissue contrast in comparison to conventional T1 inversion recovery. It is also less sensitive to flow artifacts since it uses small echo time (TE) (21, 22). The process of nulling the tissues using PSIR is a little more complicated than STIR because PSIR images can be reconstructed both as phase sensitive or magnitude images. The inversion time can be in the range of 390 to 430 ms (22).
2. Objectives
This study intended to compare T2 weighted, STIR and another IR pulse sequence in detecting cervical spinal cord lesions in patients with MS using 1.5 Tesla Siemens machine.
3. Patients and Methods
This was a cross-sectional study. Total of 60 out of 68 patients with definite MS diagnoses participated in this study for a six-month period from June to December 2016. Written Informed consent was obtained from all participants. The inclusion criteria were that T2 weighted, STIR and PSIR pulse sequences had to be performed in the same session of imaging. The exclusion criteria were the existence of any factor that might reduce the quality of images, such as small motion artifacts that slightly blurred the spinal cord.
1.5 T Siemens (Avanto, Erlangen, Germany) MR scanner and three pulse sequences (T2 weighted and two inversion recovery pulse sequences) were used for cervical cord MR imaging. Slice thickness, matrix size and field of view in all scans were 3 mm, 256 × 256 and 220 × 220 mm, respectively. Other characteristics of MR protocols used in this study are shown in Table 1.
| MR sequences | Repetition time (msec) | Echo time (msec) | Inversion time (msec) | Phase encoding steps | Echo train length |
|---|---|---|---|---|---|
| T2 | 2700 | 220 | - | 504 | 18 |
| STIR | 3000 | 31 | 160 | 336 | 8 |
| PSIR | 4000 | 20 | 349.8 | 468 | 12 |
Abbreviations: STIR, short-tau inversion recovery; PSIR, phase-sensitive inversion recovery
To assess the effectiveness of these pulse sequences, two indices of the lesion to cord ratio (LCR) and lesion to noise ratio (LNR) were calculated. Equations 1 and 2 show these ratios.
Where Slesion is the mean signal intensity of lesion area, Scord is the mean signal intensity of normal cervical cord and SDair is the standard deviation of the signal intensities of air region.
Sagittal images were used in this study. Among different slices, those in which cervical lesions were larger and could be seen easily were selected for assessment. The identical slices were chosen for all pulse sequences to be assessed so that the lesions that were seen in all sequences were selected for analysis.
Since manual segmentation of all cervical lesions could be very time-consuming, a MATLAB based program was written. It should be explained that the software was validated comparing the results of the same patient provided by this software and the Medical Imaging Interaction Toolkit (MITK) (23). MITK needs more manual practice to segment all voxels of MS plaques which may be scattered among the normal cord, however this software requires only one level of manual segmentation.
At first, digital imaging and communications in medicine (DICOM) images were read by program, then the user manually segmented the cord region from C1 down to T1 in order to avoid the interference of surrounding structures in automatic segmentation of the lesions and cord area. After restricting the image to the spinal cord area, threshold method was applied, using the information of signal intensities. The lesion, normal cord, and air (somewhere out of the patient's anatomy) regions were segmented automatically, then the mean, max and min of all lesions and cord signal intensities were determined and LCR/LNR calculated.
Using the repeated measure ANOVA and Tukey’s HSD post hoc test, the calculated indices of pulse sequences were compared. P values less than 0.05 was considered to be statistically significant. The statistical tests were performed using MedCalc version 15.2.
4. Results
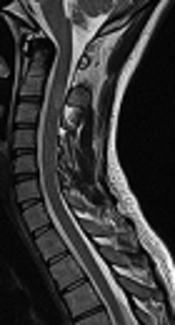
From 68 patients with definite MS cases, 60 participated in the study and eight were excluded due to slightly blurred images or separate sessions of imaging. The mean age of the patients was 34 years with an age range of 13 to 52 years. As an example, the MR images of a 22-year-old female obtained by 1.5 T Siemens scanner using different pulse sequences of T2, STIR, and PSIR are shown in Figure 1. The results of lesion and cord segmentation in different pulse sequence images are shown in Figure 2.The calculated LCR and LNR indices of each pulse sequences are shown in Figures 3 and 4.
, short tau inversion recovery (STIR), and phase sensitive inversion recovery (PSIR) pulse sequences (C)")
Cervical MRI images of a 22-year-old female with MS. T2 weighted (A), short tau inversion recovery (STIR), and phase sensitive inversion recovery (PSIR) pulse sequences (C)
 image; D. Segmented lesion's voxels in T2 image; E. Segmented cord's voxels in T2 image; F. Segmented lesion's voxels in PSIR image; G. Segmented cord's voxels in phase-sensitive inversion recovery (PSIR) image")
A. Manual segmentation of cord region; B. Segmented lesion's voxels in STIR image; C. Segmented cord's voxels in short-tau inversion recovery (STIR) image; D. Segmented lesion's voxels in T2 image; E. Segmented cord's voxels in T2 image; F. Segmented lesion's voxels in PSIR image; G. Segmented cord's voxels in phase-sensitive inversion recovery (PSIR) image
 of different pulse sequences")
The results of calculated lesion cord ratio (LCR) of different pulse sequences
 of different pulse sequences")
The results of calculated lesion to noise ratio (LNR) of different pulse sequences
There were statistically significant differences between LCR and LNR means as determined by repeated measures ANOVA (F= 10.86, P < 0.001 and F = 113.32, P < 0.001, respectively). The statistical characteristics of LCR and LNR in all pulse sequences are shown using P values provided by Tukey’s HSD post hoc test in Tables 2 and 3.
| T2 | STIR | PSIR | |
|---|---|---|---|
| Mean LCR ± SD | 0.04 ± 0.12 | 0.23 ± 0.11 | -0.03 ± 0.08 |
| Statistically lower than | STIR (P < 0.001) | - | T2 (P < 0.001), STIR (P < 0.001) |
| Statistically higher than | PSIR (P < 0.001) | T2 (P < 0.001), PSIR (P < 0.001) | - |
Abbreviations: LCR, lesion to cord ratio; PSIR, phase-sensitive inversion recovery; SD, standard deviation; T2, T2 weighted pulse sequence; STIR, short tau inversion recovery
| T2 | STIR | PSIR | |
|---|---|---|---|
| Mean LNR ± SD | 2.74 ± 10.30 | 22.70 ± 12.41 | -2.09 ± 4.82 |
| Statistically lower than | STIR (P < 0.001) | - | T2 (P = 0.02), STIR (P < 0.001) |
| Statistically higher than | PSIR (P = 0.02) | T2 (P < 0.001), PSIR (P < 0.001) | - |
Abbreviations: LNR, lesion to noise ratio; PSIR, phase-sensitive inversion recovery; SD, standard deviation; T2, T2 weighted pulse sequence; STIR, short tau inversion recovery
Although there was a significant difference between different pulse sequences, it should be considered that the intensity of T2 and PSIR images were reverse so the signs of LCR and LNR were also reverse which lead to the significant difference between these two pulse sequences.
5. Discussion
Early diagnosis of the inflammatory process in MS patients provides a chance for patients to initiate therapy using immunomodulatory drugs. This might prevent the disease from progression and helps to control the illness. Another advantage of early diagnosis is the reduced treatment costs, which is of great importance.
In this study, the LCR and LNR of three pulse sequences (T2, STIR, and PSIR) in cervical spinal cord were compared. As it can be seen in Figure 1 the legions are hyperintense in T2 and STIR and hypointense in PSIR. Visually one might conclude that PSIR creates a good contrast between the lesion and cord in comparison with T2. The intensity of T2 and PSIR were reverse. According to Tables 2 and 3, LCR and LNR of T2 and PSIR were significantly different and T2 indices were significantly larger than PSIR. This difference was due to the negative value of LCR and LNR of PSIR, if the absolute value of LCR and LNR were considered to cancel the effect of intensity, there would be no significant difference between T2 and PSIR LCR (P = 0.79) and LNR (P = 0.66) for detecting MS plaques. According to Figures 3 and 4, and Tables 2 and 3, STIR had a significantly different LCR and LNR, hence it can be concluded that STIR was better in the diagnosis of cervical cord MS plaques. This superiority can be seen in Figure 1 since the MS plaques can be easily detected.
Different studies have compared these pulse sequences. For the first time, in 1996, Lycklama a Nijeholt et al. compared the cervical cord MRI imaging using cardiac-triggered dual-echo spin-echo and magnetization transfer-prepared gradient-echo (MT-GE) pulse sequences in MS diagnosis. It revealed that the MT-GE technique was superior in comparison to spin-echo technique, but LCR ratio of the MT-GE images was equal to that of T2-weighted images (24).
In 2013, Nayak et al. compared T2 and STIR pulse sequences in the detection of spinal cord MS plaques. This was a subjective comparison showing that STIR is better than T2 (25).
Alcaide-Leon et al. in 2016 compared the sensitivity and specificity of T2, STIR and PSIR pulse sequences in the diagnosis of spinal cord MS plaque. This study revealed that STIR and SPIR had the same sensitivity and specificity in cervical cord MS diagnosis but better than T2. However, in thoracic spine STIR was better than PSIR (26).
The results of this study are in line with studies conducted by Nayak et al. and Alcaide-Leon et al. in terms of STIR superiority with respect to T2 in cervical cord MS plaques. However, Alcaide-Leon et al., considered the same superiority for STIR and PSIR in cervical cord region, contrary to our study that objectively showed that STIR is superior to the PSIR.
In 2008, Poonawalla et al. compared T1-weighted inversion recovery, STIR, and dual fast spin echo in the diagnosis of cervical spinal cord lesions. They found that T1-weighted inversion recovery had advantages in comparison with the other studied pulse sequences (27).
In a review article in 2015, Kearney et al. stated that although both STIR and PSIR could accurately distinguish the lesions from normal tissue as a result of enhanced contrast between lesions and the surrounding tissue, STIR might be subjected to artifacts, such as flow artifacts, hence PSIR is better than STIR in detecting cervical spine lesions (28).
The results of our study were not compatible with studies performed by Poonawalla et al. (27) and Kearney et al. (28). This difference could be attributed to the field strength of the MRI devices. In their studies, they used 3 T MRI machine and we used a 1.5 T MRI device. Besides, Poonawalla et al. (27) used a phased sensitive reconstruction in their T1- weighted inversion recovery imaging, which may have led to some differences in their results in comparison with our results.
For further research, we suggest performing another study with the same pulse sequences for thoracic cord lesions, to find out if STIR sequence is superior to other sequences in all parts of the spinal cord. Also, we are planning another study to find out if STIR sequence could be totally replaced with T2 sequence in spinal cord MS lesion detection.
In conclusion, to detect MS plaques in the cervical spinal cord using 1.5 T MRI machine, STIR sequence has higher sensitivity and specificity, hence it is superior to T2 weighted and PSIR sequences.
