


1. Background
Excess free fatty acids are deposited ectopically in non-fat cells of the liver, pancreas, heart, and skeletal muscles in humans (1). Mathur and colleagues first proposed the concept of non-alcoholic fatty pancreas disease (NAFPD) in 2007 when their research showed that pancreas from obese mice are heavier and contain a higher percentage of fat than those of non-obese mice (2). Pancreatic fat deposition may lead to pancreatic β-cell dysfunction through lipid toxicity and trigger type 2 diabetes mellitus (T2DM) (3). Furthermore, studies have shown that NAFPD is related to diabetes independent of age, gender, obesity, and other risk factors (4).
Proton magnetic resonance spectroscopy (1H-MRS), the most accurate technique for measuring tissue fat content, has been used widely to detect hepatic fat content (5, 6). 1H-MRS can also be used for pancreatic fat assessment. Lingvay et al. (7) reported that MRS quantifies pancreatic triglyceride (TG) content with high reproducibility and with good concordance with biochemical measurements in rats. Additionally, they used MRS to measure pancreatic TG content in vivo in 79 human volunteers. Tushuizen et al. (8) and Begovatz et al. (9) used 1H-MRS and oral glucose tolerance tests to study the association of pancreatic lipid accumulation with β-cell function in patients with T2DM and controls. To date, no report has described its use in multiple regions of the same pancreas and in determination of pancreatic fat distribution and content in patients with newly diagnosed T2DM.
In this study, 1H-MRS was used to measure fat content and distribution in the pancreatic head, body, and tail in patients with newly diagnosed T2DM and volunteers without diabetes. Then, possible correlations between pancreatic fat content (PFC) and age, body mass index (BMI), and serum TG levels were explored.
2. Objectives
The aims of this study were first to quantify PFC in patients with newly diagnosed T2DM using in vivo proton magnetic resonance spectroscopy in multiple regions of the pancreas, and second, to identify factors that may be associated with pancreatic fat deposition.
3. Patients and Methods
3.1. Study Participants
Patients were eligible for the study if they had newly diagnosed T2DM (less than 6 months) and had not received hypoglycemic or lipid-lowering drug therapy. Exclusion criteria were concurrent cardiac, hepatic, or renal dysfunction; diabetic complications such as ketoacidosis, hyperosmolar coma, or infection; pregnancy or lactation; history of claustrophobia or mental disorder; or contraindication to magnetic resonance imaging (MRI).
Volunteers without diabetes, aged 20 to 60-years-old, comprised the control group. Exclusion criteria were family history or personal history of diabetes; personal history of severe cardiopulmonary disease, pancreatitis, pancreatic tumor, or pancreatic anatomic abnormality; pregnancy or lactation; history of claustrophobia or mental disorder; or contraindication to MRI.
Participant heights and weights were obtained to calculate BMIs, and serum TG levels were measured during the 2 days preceding MRI.
3.2. Detection Equipment and Methods
Patients fasted for 4 to 6 hours prior to MRI examination using a 3.0T superconducting MR instrument (Signa Excite HD; General Electric Medical Systems, Milwaukee, WI, USA) with an 8-channel phased-array coil. Three-dimensional T2-weighted fast spin-echo (FSE) scanning was performed in the breath-holding state. Axial and coronal fat-suppressed T1-weighted fast spoiled gradient-echo sequence (fast SPGR), cross-sectional, T2-weighted FSE, and T1-weighted chemical shift dual echo sequences were acquired successively. These sequences were used for precise positioning of the 1H-MRS scan.
Single-voxel point-resolved spectroscopy sequences (PRESS) were used to acquire 1H-MRS data with specified parameters: repetition time, 1500 ms; echo time, 35 ms; eight excitations; voxel greater than or equal to 10 mm × 10 mm × 10 mm (10, 11); and scanning time of 2.5 min. The volume of interest (VOI) was set in the head, body, and tail of the pancreas, and wider areas of the pancreas with homogeneous MR signals were selected. The adipose tissue and blood vessels surrounding the pancreas were saturated with saturation bands during 1H-MRS scanning.
Participants were asked to breathe calmly during the procedure, as scanning was triggered by respiratory gating. At the same time, multiple pre-saturated zones were set up in anterior and posterior, superior and inferior, and left and right sides of the VOI to eliminate interference of MR signals from tissues surrounding the pancreas from tissue signals within the VOI (12). Automatic pre-scanning was performed routinely to complete the shimming. When the scanning was performed, the water signal within the VOI was not inhibited.
3.3. Data Measurement and Fat Fraction Calculation
SAGE v7 software (Spectral Analysis/General Electric 7.0; General Electric Medical Systems) was used for 1H-MRS data post-processing at the Advanced Development Workstation 4.3 (General Electric Medical Systems). Spectra included in the statistical calculations required a stable baseline, with a sharp and high-water peak and a low and flat fat peak. Spectra were quantified individually in the pancreatic head, body, and tail. The peak position of the spectral abscissa was set as the metabolite qualitative index, and the areas under the peaks of fat and water were measured at 1.3 ppm and 4.7 ppm, respectively. PFC was expressed as the fat fraction (FF). Areafat was the area under the lipid peak, and AreaH2O was the area under the water peak. FF was calculated as (10):

3.4. Statistical Analysis
SPSS version 18 software (SPSS Inc., released 2009, PASW Statistics for Windows, Chicago, IL, USA) was used for statistical analysis. Normally distributed data were expressed as means and standard deviations, and non-normally distributed data were expressed as medians and 25th to 75th percentile ranges. One-way analysis of variance was used to compare differences in fat fractions among the head, body, and tail of the pancreas. Chi-squared tests were used to compare the success rates of spectrum acquisition among the head, body, and tail of the pancreas. Pearson or Spearman tests were used to detect PFC correlations with age, BMI, and serum TG level. A P value less than 0.05 was considered statistically significant.
4. Results
4.1. Study Participants
Fifty-nine patients (44 males and 15 females) with newly diagnosed T2DM were enrolled in the study and completed 1H-MRS examination. T2DM group participants’ mean age was 44.7 years (range, 20 to 72 years). Their BMIs ranged from 20.52 kg/m2 to 36.33 kg/m2 (mean, 26.51 kg/m2), and fasting blood glucose levels ranged from 7.81 mmol/L to 24.90 mmol/L (mean, 12.62 mmol/L).
In total, 32 volunteers without diabetes (17 males and 15 females) were enrolled in this study and completed 1H-MRS examination. Non-diabetic volunteers were 42.7 years on average (range, 24 to 59 years). Non-diabetic volunteers’ BMIs ranged from 20.81 kg/m2 to 33.58 kg/m2 (mean, 25.29 kg/m2), and their fasting blood glucose level ranged from 4.21 mmol/L to 6.05 mmol/L (mean, 5.13 mmol/L).
4.2. Acquisition and Post-Processing of Pancreatic 1H-MRS Data
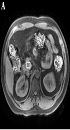
Spectra were acquired successfully for at least one pancreatic position (head, body, or tail) in 59 patients with newly diagnosed T2DM and 32 volunteers without diabetes. To be accepted, the spectrum was required to have a stable baseline, a good signal-to-noise ratio, and visible fat and water peaks. SAGE V.7 software was used to measure the areas under the peaks of fat and water in the spectra (Figure 1).

Schematic diagram for the acquisition of 1H-MRS in the pancreatic head and post-processing of spectra. A, Volume of interest positioning of the pancreatic head; B, Original spectrum obtained from the pancreatic head; C, Post-processing spectrum of the pancreatic head. SAGE v7 software was used to calculate the areas under the peaks of fat and water.
The number of cases in which successful spectra were acquired for the pancreatic head, body, and tail were counted for each group. Spectra were successfully acquired from the head in 86 cases (54 cases in the T2DM group and 32 cases in the non-diabetic group), from the body in 66 cases (39 cases in the T2DM group and 27 cases in the non-diabetic group), and from the tail in 69 cases (45 cases in the T2DM group and 24 cases in the non-diabetic group). Success rates were 94.5%, 72.5%, and 75.8%, respectively (Table 1). Chi-squared tests were used for pair-wise comparison. The success rate for spectrum acquisition for the pancreatic head differed from those for the pancreatic body and tail (Pearson χ2 = 14.808, P < 0.001; Pearson χ2 = 12.568, P = 0.001, respectively), but the success rate for the pancreatic body did not differ from that of the pancreatic tail (Pearson χ2 = 0.116, P = 0.865).
| Pancreatic region | Number of participants | ||
|---|---|---|---|
| Success | Failure | Total | |
| Head | 86 | 5 | 91 |
| Body | 67 | 24 | 91 |
| Tail | 69 | 22 | 91 |
Spectra Acquisition from the Pancreatic Head, Body, and Tail
4.3. Measurement of Pancreatic Fat Fractions
The average fat fractions in the pancreatic head (15.14 ± 7.49%), body (17.51 ± 7.74%), and tail (18.35 ± 7.58%) regions did not differ from each other significantly in the T2DM group (F = 1.782, P > 0.05; Table 2). Likewise, the average fat fractions in the pancreatic head (12.27 ± 7.85%), body (15.35 ± 8.53%), and tail (16.20 ± 10.02%) regions did not differ from each other significantly in the non-diabetic control group (F = 1.622, P > 0.05; Table 2). The mean pancreatic fat fractions in the T2DM and non-diabetic groups were 16.82 ± 6.16% and 14.56 ± 7.97%, respectively (t = 1.394, P = 0.169; Table 3).
| Pancreatic region | Number of acquisitions | Pancreatic fat fraction (%) | ||
|---|---|---|---|---|
| Type 2 diabetes mellitus | No diabetes | Type 2 diabetes mellitus | No diabetes | |
| Head | 54 | 32 | 15.14 ± 7.49 | 12.27 ± 7.85 |
| Body | 40 | 27 | 17.51 ± 7.74 | 15.35 ± 8.53 |
| Tail | 45 | 28 | 18.35 ± 7.58 | 16.20 ± 10.02 |
| F valuea | 1.782 | 1.622 | ||
| P value | 0.152 | 0.204 | ||
Fat Content by Pancreatic Region in Patients with Newly Diagnosed Type 2 Diabetes Mellitus and Volunteers Without Diabetes
| Parameter | Type 2 diabetes mellitus (N = 59) | No diabetes (N = 32) |
|---|---|---|
| Mean PFC (mean ± SD) | 16.82 ± 6.16 | 14.56 ± 7.97 |
| T valuea | 1.394 | |
| P value | 0.169 |
Mean Pancreatic Fat Content (PFC) for Participants with Newly Diagnosed Type 2 Diabetes Mellitus and Volunteers Without Diabetes
4.4. PFC Correlations with Age, BMI, and Serum TG Level
PFC did not correlate with age, TG, or BMI in patients newly diagnosed with T2DM (r < 0.15, P > 0.05; Table 4). The PFC for the 32 volunteers without diabetes was modestly correlated with serum TG levels (r = 0.467; P = 0.007) and BMI (r = 0.362, P = 0.042), but not with age (Table 4).
Correlation of Pancreatic Fat Content (PFC) with Clinical and Laboratory Parameters in Participants with Newly Diagnosed Type 2 Diabetes Mellitus and Volunteers Without Diabetesa
5. Discussion
1H-MRS is currently the most accurate MRI technique available for measuring tissue fat content; in recent years, it has been widely used to measure hepatic fat content (6). However, it is more difficult to apply to pancreatic fat quantitation. Because the pancreas is small and surrounded by arteries, veins, and adipose tissue, the VOI selected for pancreatic 1H-MRS examination should not be too large.
In this quantitative 1H-MRS study of PFC, 59 patients with newly diagnosed T2DM and 32 non-diabetic volunteers were evaluated. Spectra were successfully acquired for multiple pancreatic regions in each participant. Spectra were collected successfully for further analysis for 86 pancreatic heads (94.5% success), 67 pancreatic bodies (72.5% success), and 69 pancreatic tails (75.8% success) from the 91 participants. The higher spectra acquisition rate for pancreatic heads, compared to those for bodies and tails, may be related to the potential for obtaining larger VOIs in the pancreatic head for most participants. In magnetic resonance spectroscopy (MRS), larger VOIs are associated with higher success rates and higher signal-to-noise ratios for spectral lines. Additionally, the pancreatic head, neck, and body are located in the retroperitoneal space, whereas the tail enters the peritoneal space formed by the splenorenal ligament. Thus, the locations of the pancreatic head and body are less affected by respiratory movement.
In this study, pancreatic 1H-MRS scanning was triggered by respiratory gating in the free-breathing state. As previously published (13), spectra acquired during pancreatic 1H-MRS in a breath-holding state are characterized by a higher signal-to-noise ratio, whereas those acquired in a free-breathing state require less time to obtain (compared to using intermittent scanning in a breath-holding state). Moreover, the spectra acquired by these two methods are highly correlated with each other (13), as described by Bainbridge et al. (14). Using this free-breathing protocol, analyzable-quality pancreas spectra can be obtained in vivo with a clinical MR system within an acceptable examination time, and data can be acquired for the entire pancreas. Although each patient underwent respiratory training prior to spectra acquisition, we still cannot exclude the effects of respiratory factors on the obtained spectra.
Pancreatic fat deposition can be diffuse, homogeneous, or focal. Li et al. (15) showed that fat content does not vary among the pancreatic head, body, and tail regions for participants of all ages, including the 50 to 70-year-old persons, for whom pancreatic fat fractions begin to increase. It has also been reported that localized fat deposits occur more commonly in the anterior and posterior portions of the pancreatic head, but not the uncinate process (16, 17). In this study, fat fractions did not differ significantly across the pancreatic head, body, and tail in either diabetic patients or non-diabetic volunteers. The finding of homogenous fat distributions in the pancreatic head, body, and tail across both groups is consistent with the findings of Li et al., who studied PFC in healthy participants using chemical shift MRI.
Other researchers have found inconsistent results with respect to pancreatic fat deposition and age. One study by Saisho et al. (18) showed that increasing age is correlated with increased pancreatic fat deposition. However, another study by Li et al. (15) showed that the pancreatic fat fraction increases in men older than 50 years and that pancreatic fat distribution is homogeneous and unrelated to age among 20 to 50-year-old cases.
It is possible that PFC may vary by ethnicity. For example, Le et al. (19) showed that PFC is higher in Hispanic compared to non-Hispanic African Americans and that this difference increases with age. In our study, pancreatic fat fractions in patients with newly diagnosed T2DM and those without diabetes were unrelated to age. This finding may reflect the relatively young age of study participants, which ranged from 20 to 72 years in the study group (only five participants were older than 60 years) and 24 to 59 years in the non-diabetic group.
Previous studies have analyzed correlations between pancreatic fat deposition and obesity and metabolic syndrome (20-24). Animal studies show that obesity can lead to pancreatic fat infiltration (2, 25). PFC also correlates with hepatic fat content and circulating free fatty acid levels (15, 26, 27). Our study results indicated that PFC does not correlate with TG or BMI in patients with newly diagnosed T2DM and that non-diabetic volunteers showed weak PFC correlations with TG and BMI. This small difference may be explained because some patients with diabetes have mild pancreatic fat deposition due to their short duration of untreated diabetic disease.
In recent years, the role of pancreatic fat deposition in the pathogenesis of T2DM has attracted worldwide attention. Researchers using ultrasound to assess non-alcoholic fatty liver and pancreas disease have found that pancreatic fat infiltration is an independent risk factor for T2DM, after controlling for age, gender, and obesity (4, 28). A few studies in which 1H-MRS was employed to assess PFC found elevated PFC in individuals with impaired fasting glucose and/or impaired glucose tolerance, and patients with T2DM compared to healthy control levels (8, 29). Another group found no relationship between pancreatic adipose tissue infiltration and beta cell function in healthy controls, patients with impaired fasting glucose and/or impaired glucose tolerance, or patients with T2DM (9). In our study, PFC was slightly higher in patients with newly diagnosed T2DM compared to those without diabetes. Although patients in our study had been diagnosed as having T2DM for 6 months or less prior to study enrollment (and had not received hypoglycemic and lipid-lowering treatment), their PFC was higher than that of persons in the non-diabetic group. Thus, the role of pancreatic fat deposition in T2DM pathogenesis cannot be ignored.
In conclusion, 1H-MRS can be used to quantitatively analyze pancreatic fat, with spectra acquisition being more successful at the pancreatic head than the body and tail. The distributions of fat in the pancreatic head, body, and tail of persons with newly diagnosed T2DM and persons without diabetes were found to be roughly homogenous. PFC levels obtained of persons with newly diagnosed T2DM and persons without diabetes were similar. Moreover, PFC did not correlate with age in subjects with or without diabetes. PFC correlated modestly with TG and BMI in subjects without diabetes. Our findings indicating that PFC does not correlate with TG or BMI in subjects with T2DM requires further study.
