


1. Background
The clinical use of hybrid [18F]-fluoro-2-deoxy-D-glucose (18F-FDG) positron emission tomography/computed tomography (PET/CT) for differentiation, staging, therapy monitoring and follow-up assessment of various cancers has spread worldwide (1-4). The PET images are commonly interpreted quantitatively by measuring the standardized uptake values (SUV) through drawing a region of interest (ROI) in the organ or lesion. Comparing tumor activity with background activity is an attractive way to reduce variability from test to retest. From this aspect, the FDG uptake of the liver is commonly taken as reference background for interpreting metabolism of lesions (2, 4). For example, the lesion-to-liver ratio of SUV has been used in differentiating malignancy from benign lymphadenopathy in the mediastinum in many tumors (4-7).
In recent years, the extensive literatures advocating 18F-FDG PET to evaluate the therapy response of the tumor have given rise to the propose of the PET response criteria in solid tumors (PERCIST) 1.0 (2). In this criteria, the SUV normalized by lean body mass (SUL) was selected as the quantitative index to measure normal liver metabolism as background 18F-FDG PET activity. Particularly, the peak SUL of baseline tumor that is equal to or higher than 1.5 × mean liver SUL + 2 × standard deviations (SD) of SUL is suggested as metabolically measurable tumor activity. However, given that SUV normalized to total body weight (SUV, commonly in pattern of SUVmax) is more often used than SUL clinically, and that 18F-FDG PET/CT is not restricted to treatment response assessment, it seems more necessary to investigate the impact of volume-of-interest (VOI) placement on variability and reproducibility of background liver SUV measurement. Furthermore, SUL is not always easily measured using current commercially available workstations.
When performing quantitative assessment, reproducibility is important. Few studies have investigated the reproducibility of quantitative measurements of PET. A significant impact of VOI placement on variability and reproducibility of SUL was identified by Viner et al., who advocated that the upper aspect of the liver obtained the lowest variation between readers (8). Although the impact of VOI placement on the variation of SUV and the best area for placing VOI when measuring background liver SUV remain unclear, the central area of the right-lobe liver was recommended by previous study (9).
2. Objectives
The purpose of this study was to evaluate the impact of VOI placement on the variability and reliability of the liver SUVmean measurement and to demonstrate where is better for drawing VOI in the right lobe of liver when measuring background uptake of 18F-FDG
3. Patients and Methods
3.1. Study Patients
The institutional ethics committee approved this study. Informed consents were obtained from all subjects. A total of 343 patients admitted from December 2010 to September 2013 who had experienced PET/CT examinations for cancer screening were selected. First, we reviewed the imaging reports of PET/CT and patients’ medical records. Patients with any of the following diseases that might impact liver metabolism were excluded: history of malignancy, in status of acute inflammation, diabetes, abnormal serum liver functions tested within one month, hyperthyroidism or hyperparathyroidism, renal failure, heart failure, liver segmentectomy or transplantation, and splenectomy. Thereafter, we preliminarily reviewed the PET/CT images and excluded anyone with the following conditions: malignancy or metastasis, liver cirrhosis or deposit disease, hepatic cysts or fatty infiltration seen at CT, PET/CT were regional not including liver. Finally, 343 patients with a normal liver were included in this study.
3.2. PET/CT Acquisition
All PET/CT studies were conducted with a GE Discovery VCT 64 PET/CT scanner (GE Healthcare, Milwaukee, WI, USA) according to the standard clinical protocol at our institution. All patients fasted for 6 hours or more before injection of 18F-FDG (0.12 mCi/kg). The injected dose was calculated by measuring the radioactivity of the syringe before and after injection, which ranged from 5.8 to 17.5 mCi (mean ± SD, 9.6 ± 1.9 mCi). PET/CT scanning was started 1 hour after intravenous injection of 18F-FDG. All patients were scanned from the mid-thigh to the skull vertex in the supine position with arms above heads. Helical CT scanning were performed first using the following parameters: tube voltage, 120 - 140 kV; tube current, 200 mAs; collimation configuration, 64 × 0.6 mm; pitch, 0.516; field of view, 50 cm; matrix size, 512 × 512; scanning time, 0.33 second per rotation. For review, the CT images were reconstructed with a slice thickness of 1.5 mm and increments of 1.25 mm. PET scans were performed using three-dimensional (3D) imaging mode with emission scans of 2 minutes per bed position. Images were reconstructed with the 3D iterative reconstruction method.
3.3. Imaging Review and Liver SUV Measurement
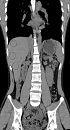
Two readers (Guobing Liu and Yan Hu) reviewed the PET/CT images, independently. Reader 1 (Guobing Liu) was a physician of nuclear medicine who had read PET/CT images for more than 2 years. Reader two (Yan Hu) was a resident doctor who had been trained for 3 years in nuclear medicine and had being trained for more than 2 months in reading PET/CT images. In combination of axial, coronal and sagittal images, a 3D VOI (3 cm in diameter) was placed in three separate areas in the right lobe of the liver, namely: I) above bifurcation of the portal vein (segments VII and VIII), II) below the bifurcation of the portal vein (segments V and VI), and III) at the level of bifurcation of the portal vein (segments V through VIII). Perceivable vessels were avoided as much as possible, when placing the VOIs (Figure 1). The mean SUVs were calculated. Both readers placed the VOIs and measured the SUVs independently.
 and positron emission tomography (PET) images (B, D, F) of hybrid PET/CT from a healthy individual at upper (A, B), lower (E, F) and portal vein level (C, D) within the right lobe of the liver. Areas in circus denote volumes of interest (VOI) for measuring liver mean standardized uptake value (SUV<sub>mean</sub>). Panel G is coronary CT image showing entirely the three VOIs in A, C and E.")
Transverse unenhanced CT (A, C, E) and positron emission tomography (PET) images (B, D, F) of hybrid PET/CT from a healthy individual at upper (A, B), lower (E, F) and portal vein level (C, D) within the right lobe of the liver. Areas in circus denote volumes of interest (VOI) for measuring liver mean standardized uptake value (SUVmean). Panel G is coronary CT image showing entirely the three VOIs in A, C and E.
3.4. Statistical Analysis
Statistical analyses were performed using SPSS 20 (IBM Corp. Released 2011, IBM SPSS Statistics for Windows, Armonk, NY, USA). All hypothesis tests were two sided with a significance level of 0.05. For statistics of numerical variables, 95% confidence intervals (CI) were calculated. The Kolmogorow-Smirnow test was performed to test the normal distribution and the Levene test was used to test equality of variances before comparing differences between groups. One-way ANOVA analysis with the Bonferroni test for post hoc comparisons was taken for analyzing significant differences of variables with homogeneous variances, while Kruskal-Wallis test with the Tamhane’s T2 test for pairwise comparisons was chosen for variables with heterogeneous variance among groups. General liner model analysis was performed to test effects of VOI location and reader on SUVmean measurements, with VOI locations being considered as fixed variable while reader considered as randomized variable. Variability of SUVmean between different levels of the liver was analyzed through calculating the coefficient of variation. Reliability of liver SUVmean was assessed by assessing the intraclass correlation coefficient (ICC). An ICC of 0.80 - 1.00 indicates good reproducibility; 0.61 - 0.80 indicates substantial reproducibility, 0.41 - 0.60 indicates moderate reproducibility, 0.21 - 0.40 indicates fair reproducibility, 0 - 0.20 indicates slight reproducibility (10). Bias of SUVmean between readers were calculated through Bland-Altman analysis for assessing variability between the readers.
4. Results
4.1. Patient Demographic Information
Of the 343 patients included, 236 (68.8%) were male, 107 were female (31.2%). The mean age was 47.1 ± 8.32 years, ranging from 21 to 74 years. No significant difference of age was identified between male and female subjects (46.7 ± 8.52 vs. 48.2 ± 7.79, P = 0.115).
4.2. Inter-Reader Agreements of Liver SUV<sub>mean</sub> at Different Locations
Statistics of liver SUVmean in relation to readers and VOI positions are summarized in Table 1. For reader 1, the liver SUVmean was measured as 1.84 ± 0.439 (95% CI: 1.80 - 1.89) at the upper level, 1.91 ± 0.417 (95% CI: 1.87 - 1.96) at the portal vein level, and 1.89 ± 0.415 (95% CI: 1.85 - 1.93) at the lower level. For reader 2, the SUVmean was 1.85 ± 0.432 (95% CI: 1.80 - 1.89) at the upper level, 1.84 ± 0.396 (95% CI: 1.80 - 1.89) at the portal vein level, and 1.89 ± 0.413 (95% CI: 1.85 - 1.93) at the lower level. Neither VOI location nor reader had a significant effect on liver SUVmean, with P values being 0.449 and 0.446, respectively (Figure 2). The inter-location ICCs controlling for readers were calculated as 0.955 (95% CI: 0.946 - 0.962, P < 0.001) for reader 1 and 0.980 (95% CI: 0.976 - 0.983, P < 0.001) for reader 2, indicating great agreement of SUVmean among different locations.
| Variables/Statistics | Liver SUVmean | Interlocation ICCs (95% CI) | P values | ||
|---|---|---|---|---|---|
| Upper level (CV) | Portal level (CV) | Lower level (CV) | |||
| Reader 1 | 1.84 ± 0.439 (23.9%) | 1.91 ± 0.417 (21.8%) | 1.89 ± 0.415 (22.0%) | 0.955 (0.946 - 0.962) | < 0.001 |
| Reader 2 | 1.85 ± 0.432 (23.4%) | 1.84 ± 0.396 (21.5%) | 1.89 ± 0.413 (21.9%) | 0.980 (0.976 - 0.983) | < 0.001 |
| Interreader ICCs (95% CI) | 0.935 (0.920 - 0.947) | 0.937 (0.906 - 0.956) | 0.930 (0.914 - 0.944) | NA | NA |
| P values | < 0.001 | < 0.001 | < 0.001 | NA | NA |
| Interreader bias | 0.004 ± 0.144 | 0.069 ± 0.112 | 0.002 ± 0.136 | NA | < 0.001a |
Summary of the Statistics of Liver SUVmean in Relation to Readers and VOI Locations
 measured at different locations by different readers. The general linear model analysis demonstrated that neither volume of interest (VOI) location nor reader had significant impact on liver SUV<sub>mean</sub>, with P values being 0.449 and 0.446, respectively.")
Scatter diagram shows liver mean standardized uptake value (SUVmean) measured at different locations by different readers. The general linear model analysis demonstrated that neither volume of interest (VOI) location nor reader had significant impact on liver SUVmean, with P values being 0.449 and 0.446, respectively.
4.3. Inter-Reader Agreements of Liver SUV<sub>mean</sub> at the Same Location
The ICCs of liver SUVmean within the same locations between the two readers were calculated as 0.935 (95% CI: 0.920 - 0.947, P < 0.001) at the upper level, 0.937 (95% CI: 0.906 - 0.956, P < 0.001) at the portal vein level, and 0.930 (95% CI: 0.914 - 0.944, P < 0.001) at the lower level (Table 1). This indicated great inter-reader reproducibility of SUVmean measurements at each location. As for the variance of SUVmean, the coefficients of variation were also close between readers in each location, namely 23.9% at the upper level, 21.8% at portal vein level, and 22.0% at the lower level for reader 1, while 23.4% at the upper level, 21.5% at portal vein level and 21.9% at the lower level for reader 2.
Bland-Altman plot analysis showed that inter-reader SUVmean biases were 0.004 ± 0.144, 0.069 ± 0.112, and 0.002 ± 0.136 for the upper level, portal vein level and lower level, respectively (Figure 3). Levene test showed that variance of the bias among the three locations was not homogeneous (Levene statistic = 4.769, P = 0.009). Therefore, Kruskal-Wallis test was performed to test the difference of SUVmean bias among the three locations, which demonstrated significant difference (test statistics = 46.685, P < 0.001). Then, the Tamhane’s T2 test was chosen for pairwise comparisons, which showed that bias of liver SUVmean at portal vein level was significantly larger than those at the upper level (0.069 ± 0.112 vs. 0.004 ± 0.144, P < 0.001) and larger than those at the lower level (0.069 ± 0.112 vs. 0.002 ± 0.136, P < 0.001), whereas the latter two were not significantly different (0.004 ± 0.144 vs. 0.002 ± 0.136, P = 0.923).
 measured at upper (A), portal vein (B) and lower (C) levels of the right-lobe of the liver. Liver SUV<sub>mean</sub> at the portal vein level presented the largest bias (0.069 ± 0.112, P < 0.001, Kruskal-Wallis test), as compared to the other two locations which were not significantly different (0.004 ± 0.144 vs. 0.002 ± 0.136, P = 0.923, post hoc Tamhane’s T2 test).")
Bland-Altman plots show inter-reader variabilities of liver mean standardized uptake value (SUVmean) measured at upper (A), portal vein (B) and lower (C) levels of the right-lobe of the liver. Liver SUVmean at the portal vein level presented the largest bias (0.069 ± 0.112, P < 0.001, Kruskal-Wallis test), as compared to the other two locations which were not significantly different (0.004 ± 0.144 vs. 0.002 ± 0.136, P = 0.923, post hoc Tamhane’s T2 test).
5. Discussion
In this study, we demonstrated that SUVmean measurement in the right lobe of the liver presented excellent reliability and reproducibility in spite of where VOIs were placed. In contrast, the upper and the lower level of the right-lobe liver might be more suitable for SUVmean measurement, compared to the portal vein level, as inter-reader bias of liver SUVmean was identified larger at the portal vein level than that measured at the other two levels. Therefore, taking the upper or lower area in the right lobe of the liver for measuring liver SUVmean would minimize variance and allow more repeatable quantification of background liver FDG uptake.
Comparing tumor activity with background activity is an attractive way to reduce variability from test to retest (2, 11). Many anatomic sites have been used to obtain background SUVs, such as mediastinum, liver, back muscle, and thighs (2). In contrast, the right lobe of the liver is a homogeneous tissue which presents many advantages. As thighs are not always included completely within the scanning field of PET/CT examination clinically, and muscle uptake may be influenced by many factors (such as stress and room temperature), these two sites are not reliable for quantification of background metabolism. The mediastinum may be a good choice, especially when the liver is diseased. However, it is easier to draw a VOI in the right lobe of the liver than in the aorta as the latter needs to repeatedly draw ROIs on multiple levels for avoiding uptake of the vessel wall (9). Besides, FDG uptake in the liver varies less than that in the mediastinum (9).
Many methods have been applied to assess the FDG uptake in lesions, of which the maximum SUV (SUVmax) normalized to total body weight has been reported most commonly in clinical practice, due to its easy access using current commercial workstations and resistance to partial-volume issues in small tumors. Furthermore, an approach using background threshold has been fabricated and has achieved initial success for determining tumor by defining single-pixel SUVmax above 3 folds of SDs of background levels avoiding the uncertainty of SUVmax (12, 13). From this aspect, the mean SUV normalized to total body weight (SUVmean) is more suitable for assessing metabolism of background liver than mean SUV normalized to lean body weight (SULmean), given its closer matching to SUVmax and easier measuring process that is feasible by the widespread workstations used clinically.
Although SULmean has been recommended in the PERCIST 1.0 for quantification of background liver metabolism, there was no evidence of any significant advantage over SUVmean in relation to variability and reproducibility (2, 9). The variability of SULmean measurements in the liver has been reported to be 21.0% - 23.1% (8), which is close to the variability of liver SUVmean measurements in this study (21.5% - 23.9%). Besides, the clinical utility of 18F-FDG PET/CT is not restricted to treatment-response evaluation. SULmean may be more consistent between different patients than body-weight SUVmean (14, 15); but for a specific individual taking PET/CT for tumor screening or staging, body weight always remains stable over time. One cannot expect significant change of liver SUVmean measurements between various times of PET/CT examinations in these kind of patients.
Our results contradict conclusions or methods of many previous studies regarding to VOI placement in the right lobe of the liver. Central position in the right lobe of the liver was recommended by many studies for measuring background liver SUVmean, possibly because of the large area in this region where easier VOI drawing is allowed (9, 14, 16, 17). However, in this study, the SUVmean measured at the central level of the right-lobe of the liver presented significantly larger inter-reader bias both of that at the upper level or that at the lower level. This means the upper and lower area of the right-lobe of the liver are superior over the central area for reducing variance of SUVmean measurement. This finding is partially supported by the study conducted by Viner et al. (8), who also identified that the upper area of the right-lobe of the liver was superior over the central area for SULmean measurement. The reason underlying this phenomenon may be related to the reduced uniformity of VOI placement in the central area just because of its relatively larger space for VOI placement and the relatively more vessels running through this area, given the significant influences of various serological factors on variations of liver 18F-FDG uptake (16, 18, 19).
In conclusion, liver SUVmean measured at the three levels within the right lobe of the liver presented excellent reliability and reproducibility. The measurements made at the upper or lower levels of the liver have relatively smaller variation and more precision between readers. Therefore, when measuring background liver SUVmean, the upper or lower part of the right-lobe of the liver is recommended.
