


1. Background
Gout is one of the most common joint diseases (1). Unfortunately, former epidemiology study showed an elevated risk of gout and suboptimal treatment (2). A proper diagnosis is needed to achieve a successful treatment outcome. Monosodium urate (MSU) identification by aspiration is considered the gold standard for a diagnosis of gout (3). However, multiple clinical factors may lead to MSU detection failure, and a false-negative result can significantly delay gout treatment (4, 5). In 2015, the American College of Rheumatology (ACR) developed new gout classification criteria that included imaging as one of the domains and increased sensitivity and specificity to 92% and 89%, respectively (6).
For diagnosing gout, ultrasound is a useful tool with great potential. Snowstorm sign, double contour (DC) sign, tophi and bone erosion are established ultrasound features of gout. The prevalences of these signs in gout are 78.9%, 42.3%, 28.2% and 39.4%, respectively. In previous studies, ultrasound demonstrated good sensitivity and specificity for diagnosing gout (85.9% and 86.7%), especially with regard for the specificity of DC sign and tophi (96.7% and 100%) (7). Currently, ultrasound is increasingly used to evaluate gout, especially in its early stage. However, little is known about the prevalence of ultrasound signs in first gout attack.
2. Objectives
The aim of the present study was to evaluate the prevalence of ultrasound features in first attack gout. By demonstrating that some patients with first gout attack have bone erosion and tophi, we hope to show that gout involves chronic inflammation of articular tissues. We also correlated these ultrasound features with hyperuricemia duration to improve our understanding of the relationship between gout and hyperuricemia and what factors trigger the onset of acute gout.
3. Patients and Methods
Subjects were recruited from January 2015 to November 2016 from the Department of Rheumatology of Peking University People’s Hospital. Subjects with suspected first gout attack underwent ultrasound examination the same day they saw a doctor. Gout was defined according to the 2015 ACR gout classification criteria (6). Subjects with asymptomatic hyperuricemia were selected through a review of the medical records of our hospital. Then, telephone interviews were performed to exclude those with gout. Hyperuricemia was defined as a serum urate acid (SUA) level ≥ 360 μmol/L in women or ≥ 420 μmol/L in men. The exclusion criteria applied in all subjects were age < 18 years old, a prior history of arthritis (including gout, rheumatoid arthritis, systemic lupus erythematosus and similar conditions), or a prior history of joint trauma. After informed consent was provided, all subjects who were included in our study underwent a detailed clinical examination, laboratory tests and ultrasound examination within 3 days. All subjects completed a questionnaire that reported information on their demographic characteristics (age and race), duration of hyperuricemia, medication history and individual knowledge about nutrition.
3.1. Ultrasound Examination
Ultrasonography was performed with an 18 MHz transducer using a Toshiba Aplio 500 system (Toshiba Medical Systems Corporation, Tochigi, Japan). Standardized examinations were completed on six joints three bilateral joints) in each patient beginning with the first metatarsophalangeal (1st MTP) joint followed by the ankle and knee joints. All scans were performed in two dimensions: from side-to-side in the longitudinal plane and distally to proximally in the transverse plane. Each site was scanned in both grayscale mode and with the power Doppler technique during the same examination by the same sonographer. Sonographic images were stored for all patients. All subjects were scanned by two experienced sonographers who were blinded to patient histories. Intra- and interobserver reliability was also calculated. According to the outcome measures in rheumatology (OMERACT) definition, an abnormal hyperechoic band over the superficial margin of the articular hyaline cartilage was regarded as a DC sign. Circumscribed, inhomogeneous, hyperechoic and/or hypoechoic aggregation with or without acoustic shadow was defined as indicating the presence of tophi. Bone erosion was defined as cortical discontinuity (8). Snowstorm sign was defined as hyperechoic spots in the joint fluid and synovium (9). Abnormal blood flow was defined as the presence of a power Doppler signal in the synovium.
3.2. Statistical Analysis
All analyses were performed using SPSS V. 19.0 (IBM Corp. Released 2010. IBM SPSS Statistics for Windows, Version 19.0. Armonk, NY: IBM Corp). The distributions of the variables were checked with the Kolmogorov-Smirnov test. Continuous variables are expressed as the mean ± standard deviation (SD) if they had a normal distribution and as the median and interquartile range if they had a skewed distribution. Categorical variables are expressed as percentages and numbers. Differences between means were compared by unpaired t-tests when the variables showed a normal distribution or by the Mann-Whitney U test when they did not. Differences were compared by the chi-square test for binomial variables. A P value < 0.05 was considered to be significant. Intra- and interobserver reliability was estimated based on the Cohen κ coefficient. κ values of 0 - 0.20 were considered poor, 0.20 - 0.40 fair, 0.40 - 0.60 moderate, 0.60 - 0.80 good, and 0.80 - 1 excellent.
4. Results
4.1. Subjects’ Characteristics
A total of 48 patients with first gout attack and 43 patients with asymptomatic hyperuricemia (AHU) were recruited for this study in our department. In terms of nationality, all of the included individuals were Han. No patients in our study were receiving regular treatment for hyperuricemia, and no patients took any uric acid-lowering drugs within 1 week before their ultrasound examination. All of the patients with first gout attack were men, and 72% of them had a high purine diet level before experiencing a gout attack (28% seafood, 27% beer and 17% bean products). The clinical and laboratory parameters are shown in Table 1. The patients with first gout attack were significantly older than the patients with AHU. There was no significant difference in laboratory parameters between the two groups except for the fasting plasma glucose (FPG) levels.
| AHU (n = 43) | First gout attack (n = 48) | P value | |
|---|---|---|---|
| Age (year) | 41.67 ± 1.42 | 49.39 ± 2.34 | 0.005 |
| Sex (female) | 9 | 0 | |
| BMI (kg/m2) | 26.21 ± 0.43 | 25.73 ± 0.38 | 0.417 |
| SUA (μmol/L) | 495.70 ± 12.89 | 496.22 ± 19.62 | 0.982 |
| FPG (mmol/L) | 5.77 ± 0.20 | 5.28 ± 0.09 | 0.039 |
| LDL (mmol/L) | 3.20 ± 0.15 | 3.30 ± 0.12 | 0.630 |
| HDL (mmol/L) | 1.09 ± 0.03 | 1.02 ± 0.03 | 0.102 |
| TC (mmol/L) | 5.19 ± 0.20 | 5.01 ± 0.16 | 0.492 |
| TG (mmol/L) | 2.79 ± 0.43 | 2.09 ± 0.18 | 0.164 |
| GFR (mL/min × 1.73 m2) | 92.04 ± 3.22 | 86.24 ± 3.22 | 0.211 |
| HU duration (year) (mean range) | 3 (1, 5) | 4.5 (1, 6.75) | 0.358 |
Abbreviations: AHU, asymptomatic hyperuricemia; BMI, body mass index; FPG, fast plasma glucose; GFR, glomerular filtration rate; HDL, high density lipoprotein; HU, hyperuricemia; LDL, low density lipoprotein; SD, standard deviation; SUA, serum uric acid; TC, total cholesterol; TG, triglyceride.
aValues are expressed as mean ± SD, unless it was mentioned.
4.2. Ultrasound Findings
A total of 288 joints associated with first gout attack and 258 associated with AHU were examined, and their ultrasound features are shown in Figure 1. Among the first gout attack patients, the 1st MTPs were affected in 61% (29/48) of the patients, the ankles in 33% (16/48) and the knees in 6% (3/48). The patient-based and joint-based ultrasound features of the included individuals are presented in Tables 2 and 3. Among the patients with AHU, 60% (26/43) had normal ultrasound findings. Abnormal blood flow was also found in the unaffected joints of 10 first gout attack patients.
| AHU (n = 43) | First gout attack (n = 48) | P value | |
|---|---|---|---|
| Snow storm sign | 12 (28) | 44 (92) | < 0.001 |
| DC sign | 10 (21) | 14 (29) | 0.523 |
| Tophi | 1 (2) | 3 (6) | 0.619 |
| Bone erosion | 1 (2) | 6 (13) | 0.074 |
| Abnormal blood flow | 2 (5) | 40 (83) | < 0.001 |
Abbreviations: AHU, asymptomatic hyperuricemia; DC, double contour.
aValues are expressed as No. (%).
| AHU (n = 258) | First gout attack (n = 288) | P value | |
|---|---|---|---|
| Snow storm sign | |||
| 1st MTP | 19 (7.4) | 58 (20.1) | < 0.001 |
| Ankle | 1 (0.3) | 28 (10.8) | < 0.001 |
| Knee | 1 (0.3) | 6 (3.4) | 0.079 |
| DC sign | |||
| 1st MTP | 15 (5.8) | 14 (4.9) | 0.620 |
| Ankle | 3 (1.2) | 4 (1.4) | 0.815 |
| Knee | 2 (0.8) | 5 (1.7) | 0.326 |
| Tophi | |||
| 1st MTP | 1 (0.3) | 2 (0.7) | 0.628 |
| Ankle | - | 2 (0.7) | 0.501 |
| Knee | - | 2 (0.7) | 0.501 |
| Bone erosion | |||
| 1st MTP | 2 (0.8) | 7 (2.4) | 0.182 |
| Ankle | - | 5 (1.7) | 0.063 |
| Knee | - | 2 (0.7) | 0.501 |
| Abnormal blood flow | |||
| 1st MTP | 2 (0.8) | 30 (10.4) | < 0.001 |
| Ankle | - | 19 (6.6) | < 0.001 |
| Knee | - | 5 (1.7) | 0.063 |
Abbreviations: AHU, asymptomatic hyperuricemia; 1st MTP, first metatarsal-phalangeal joints
aValues are expressed as No. (%).
In the patient-based evaluation, the prevalence of snowstorm signs and abnormal blood flow was significantly higher in first gout attack than in AHU (P < 0.001). In the joint-based evaluation, the snowstorm sign in the 1st MTPs was the most frequent finding in both patients with AHU and patients with first gout attack. The prevalences of both snowstorm signs and abnormal blood flow were significantly higher in both 1st MTPs and ankles in first gout attack than in AHU (P < 0.001). Intraobserver reliability (mean κ 0.74) and interobserver reliability (mean κ 0.63) were both good.
The median duration of hyperuricemia was 7.5 years in patients with a first gout attack with tophi was 7.5 years and 6.5, 4 and 2 years in those with bone erosion, DC sign and snowstorm sign, respectively. The hyperuricemia duration was significantly longer in patients with tophi and bone erosion than in those with snowstorm and DC signs (P = 0.004). However, there was no significant difference between patients with tophi and bone erosion (P = 0.366) or between patients with snowstorm signs and DC signs (P = 0.455). The hyperuricemia duration was 7 years in patients with AHU with tophi and bone erosion. There was no significant difference in the median hyperuricemia duration of AHU patients with DC signs and snowstorm signs (4 years vs. 2 years, P = 0.194).
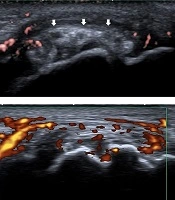
. A, First metatarso-phalangeal joints (1st MTP) longitudinal view, B-mode ultrasound shows synovial thickening and hyper echoic foci (white arrows) in patients with first gout attack. B, Knee transverse view, B-mode ultrasound shows double contour (DC) sign (white arrows) on the surface of the cartilage in patients with first gout attack. C, 1st MTP longitudinal view, tophi (white arrows) with surrounding power Doppler signal in patients with first gout attack. D, 1st MTP longitudinal view, bone erosion (white arrows) in patients with first gout attack. E, 1st MTP longitudinal view, synovial thickening and power Doppler signals in patients with first gout attack. F, Ankle longitudinal view, hyperechoic foci (white arrows) inside the synovial fluid.")
Ultrasound features of joints in first gout attack and asymptomatic hyperuricemia (AHU). A, First metatarso-phalangeal joints (1st MTP) longitudinal view, B-mode ultrasound shows synovial thickening and hyper echoic foci (white arrows) in patients with first gout attack. B, Knee transverse view, B-mode ultrasound shows double contour (DC) sign (white arrows) on the surface of the cartilage in patients with first gout attack. C, 1st MTP longitudinal view, tophi (white arrows) with surrounding power Doppler signal in patients with first gout attack. D, 1st MTP longitudinal view, bone erosion (white arrows) in patients with first gout attack. E, 1st MTP longitudinal view, synovial thickening and power Doppler signals in patients with first gout attack. F, Ankle longitudinal view, hyperechoic foci (white arrows) inside the synovial fluid.
5. Discussion
Very few studies have addressed the ultrasound features of first gout attack. In our study, the prevalences of the four evaluated ultrasound features were lower in the joints of patients with first gout attack than has been shown in previous studies (7, 10). Naredo et al. performed ultrasound in 91 male gout patients, and the prevalences of hyperechoic cloudy area and DC sign were 87.5% and 74.7%, respectively, both of which were significantly higher than the results obtained in the healthy control group (10). Another study also reported that the prevalences of snowstorm sign, DC sign, tophi and bone erosion in patients with gout were 78.9%, 42.3%, 28.2% and 39.4%, respectively (7). This may be because these previous studies included patients with recurrent attacks of gout. A long disease duration and flares of acute gout attack cause damage to the joints. Furthermore, we also studied the prevalences of the four evaluated ultrasound features in the joints of AHU patients, and our results were similar to those presented in previous studies (11). While uric acid becomes inflammatory only when it crystallizes to form monosodium urate crystals, the factors that lead to the formation of monosodium urate crystals and the stimulation of innate immune inflammation remain unclear. In recent years, multiple factors have been reported to be involved in the development of gout; these include genetics, diet and metabolic disease (12, 13). Interestingly, we detected more urate crystal deposition in patients with first gout attack than we found in patients with AHU, even though there was no significant difference in serum urate acid levels or hyperuricemia duration between the two groups. Our results provide evidence showing that hyperuricemia is not sufficient to initiate the onset of acute gout attacks. A combination of genetic factors and environmental exposure leads to the development of gout.
According to the 2012 ACR guidelines, it is important to start the treatment as soon as possible during an acute attack of gout (14). During an acute gout attack, patients have severe swelling and pain in the affected joint, which contribute to disability and loss of productivity (15, 16). Biopsy studies have shown that blood flow detected by ultrasound was associated with the overall pathology of the synovium and can be used to evaluate synovial inflammation (17, 18). In our study, we detected abnormal blood flow in both affected and unaffected joints in first attack patients. We also detected abnormal blood flow in the joints of patients with AHU. Our findings suggest that low-grade inflammation may present without clinical symptoms. It may therefore be more appropriate to divide asymptomatic hyperuricemia into two categories: patients with and without inflammation. Ultrasound is a more sensitive indicator than clinical manifestations of local synovial inflammation activity. Because the most frequently affected joints were the 1st MTPs and ankles, we recommend that regular ultrasound examinations should be performed of these two joints in patients with gout and AHU to identify joint inflammation. To our knowledge, this is the first report to show the ultrasound features of first gout attack and its association with hyperuricemia duration. Our results show that hyperuricemia duration decreased in the following order: tophi > bone erosion > DC sign > snowstorm sign. This finding is similar to those presented in a study by Elsaman, in which the authors found a significant correlation between ultrasound features and gout duration (7). The presence of bone erosion is a severe complication of gout that eventually leads to joint damage and disability, and tophi are strongly associated with bone erosion (19). However, in our study, tophi and bone erosion were also detected in patients with first gout attack who had a relatively longer hyperuricemia duration. Furthermore, the formation of uric acid crystallization begins within two years of hyperuricemia onset. Routine ultrasound should be performed as soon as possible in affected patients to prevent joint damage even when there are no clinical symptoms.
A limitation of our study is that the hyperuricemia duration was obtained through a questionnaire survey, and this may have led to errors and underestimation. To make our results more reliable, we excluded subjects who were not clear about their disease duration. Moreover, the relatively small sample size may have limited the statistical power of our analysis, and further studies that include larger sample sizes are needed to confirm our conclusions.
In conclusion, ultrasound features are associated with hyperuricemia duration. Furthermore, tophi and bone erosion can be detected in first gout attack. These data suggest that the low-grade inflammation induced by urate acid may also be present in individuals with AHU.
