

1. Background
Pulmonary embolism (PE) ranks third among the most frequent causes of acute cardiovascular disease (1). The clinical picture of PE is not specific. Therefore, diagnostic tests should be performed to confirm the diagnosis and to determine the severity of the PE.
The relationship between the clot load of lower extremity veins and the severity of pulmonary artery emboli is unknown.
2. Objectives
The purpose of this study was to investigate the relationship between pulmonary artery clot load score, lower extremity venous clot load, and serum D-dimer levels, and cardiac computed tomography (CT) findings of right heart failure.
3. Patients and Methods
Institutional review board approval was granted and all patients gave informed consent. The study group comprised 74 patients with clinically suspected acute PE consecutively. All had undergone clinical assessment of the probability of PE, using the original Wells scoring system. All patients with a suspicion of PE and high serum D-dimer levels underwent both CT pulmonary angiography (CTPA) and bilateral lower extremity venous duplex ultrasonography (DUS) within 24 hours of admission to the hospital.
The patients were divided into three groups;.35 patients had negative CTPA and deep vein thrombosis (DVT) findings (group 1), 29 had positive CTPA and negative DVT findings of PE (group 2), and 10 patients had positive DVT and CTPA findings (group 3).
Two radiologists who were blinded to each other’s findings reviewed the CTPA and bilateral lower extremity venous DUS results.
Measurements of the serum D-dimer were made using a Sysmex CA 7000 with D-dimer plus reagent and D-dimer plus activator (Dade Behring Marburg, Germany) solutions.
CTPA was performed on a 16-slice CT scanner (LightSpeed Plus, General Electric Medical Systems, Milwaukee, USA) with electrocardiogram (ECG)-gating with 0.5-second helical rotation time, 1.25 mm collimation. One hundred 100 mL of Iopamidol (Isovue 370, Bracco Diagnostics) was injected at a rate of 4 mL/sec. Imaging began 20 seconds after initiation of the contrast infusion.
The CTPA findings were accepted as positive if thrombus, a partial or complete filling defect was present in one or more pulmonary arteries, or a sharp arterial cut-off within an opacified artery.
The method of Qanadli et al. was used to evaluate the degree of pulmonary vascular obstruction. It was considered that the arterial tree of each lung had 10 segmental arteries (three in the upper lobes, two in the middle lobe and in the lingula and five in the lower lobes). The presence of emboli in a segmental artery was evaluated 1 point. The emboli in the most proximal arterial level were classified with a value equal to the number of segmental arteries that rose distally. For each value, a weighting factor was assigned, based on the degree of vascular obstruction. This factor was equal to zero, when no thrombus was observed; 1, when partially occlusive thrombus or 2 was observed, with total occlusion (2).
Quantitative measurements of cardiac CT were obtained in axial CT images:, right ventricle (RV) and left ventricle (LV) diameter, RV wall thickness (RVW)/LV wall thickness (LVW), the thickness of the interventricular septum and the diameter of the left and right pulmonary artery, the diameter of the azygos vein, the return flow of the contrast agent in the inferior vena cava (IVC), and the inclination of the septum to the left, leading to the assessment of right heart failure. Ventricular axis was measured in diastole on a single transverse scan perpendicular to the long axis of the heart and was defined as the largest distance between the inner aspect of the interventricular septum and the free wall of the ventricle. Measurements were taken of the portion of the azygos vein facing the right tracheal wall, and of the superior vena cava at the level of the azygos arch.
Inclination of the septum (convex toward the left ventricle) was accepted as septal bowing. Trace of contrast reflux to IVC with or without reflux to hepatic veins was accepted as IVC reflux.
The lower extremity Doppler ultrasound (DUS) was performed using a Logic 700 (General Electric Medical Systems, Milwaukee, USA) with a linear 7-MHz probe and a 3.5-mm convex probe from the IVC distal segment to the level of trifurcation. Sonographic findings were considered positive if thrombus, complete or partial filling defect was present, or lack of Doppler flow at examination. The method of Mewissen et al. was used to evaluate the burden of blood clots. Seven venous segments are included: IVC, common iliac veins, external iliac veins, common femoral veins, superficial proximal femoral veins, distal superficial femoral veins and popliteal veins. The score is based on partial or complete occlusion of each segment (0 - 2). The maximum score is 14 per extremity (3).
All statistical analyses were performed using the statistical package for social sciences (IBM SPSS Statistics 22.0) software program. Continuous variables were compared using Student’s t-test, nominal variables were scored using the chi-square test and Spearman’s correlation test. In addition, one-way analysis of variance (ANOVA) and correlation tests were used. All values given are mean ± standard deviation (SD) of the mean (SEM). P < 0.05 was accepted as statistical significance.
4. Results
Seventy-four patients with suspected PE (36 women, 38 men), whose mean age was 55.9 ± 13 (range, 22 - 80) years, were enrolled in the study. No significant differences were determined between the three groups regarding age and sex (Table 1). A significant positive correlation was found between the lower extremity coagulation load and the main the total index of pulmonary artery obstruction index (P = 0.001) (Table 2).
| Variables | Group 1 (n = 35) | Group 2 (n = 29) | Group 3 (n = 10) | P value |
|---|---|---|---|---|
| Age | 56.7 ± 2.6 | 54.9 ± 1.9 | 55.9 ± 3.8 | > 0.05 |
| Gender (male/female) | 17/18 | 15/14 | 4/6 | > 0.05 |
| DUS ven scanning positive, % | 2.9 | - | 100 | 0.0001 |
| Pleural effusion, % | 42.9 | 41.4 | 80.0 | > 0.05 |
| Leftward septal bowing, % | 91.4 | 50 | 37.9 | 0.0001 |
| IVCD | 19.6 ± 0.6 | 24.0 ± 0.9 | 26.4 ± 1.8 | 0.0001 |
| IVCR | 0.5 ± 0.1 | 1.0 ± 0.2 | 1.4 ± 0.2 | 0.002 |
| IVST | 10.6 ± 0.3 | 14.9 ± 0.4 | 15.2 ± 0.9 | 0.0001 |
| MPAD | 25.9 ± 0.7 | 30.1 ± 0.8 | 29.5 ± 1.3 | 0.001 |
| RPAD | 20.2 ± 0.6 | 24.7 ± 0.9 | 22.5 ± 2.8 | 0.002 |
| LPAD | 19.8 ± 0.5 | 24.7 ± 0.6 | 24.2 ± 1.6 | 0.0001 |
| RVWT | 6.7 ± 1.9 | 5.3 ± 2.2 | 5.9 ± 1.4 | 0.022 |
| LVWT | 13.6 ± 3.4 | 14.3 ± 3.8 | 16.4 ± 3.5 | > 0.05 |
| RVD | 36.2 ± 1.1 | 39.8 ± 1.3 | 41.8 ± 2.6 | 0.03 |
| LVD | 43.6 ± 1.1 | 38.2 ± 1.3 | 35.3 ± 3.2 | 0.002 |
| SVCD | 15.7 ± 0.3 | 16.1 ± 0.4 | 15.8 ± 0.9 | > 0.05 |
| Azygos vein | 11.8 ± 0.4 | 12.8 ± 0.3 | 12.9 ± 1.0 | > 0.05 |
| RPOI | - | 6.6 ± 0.5 | 8.0 ± 1.2 | 0.0001 |
| LPOI | - | 6.3 ± 0.5 | 7.4 ± 0.9 | 0.0001 |
| MPOI | - | 12.9 ± 0.7 | 15.4 ± 1.7 | 0.0001 |
| D-dimer | 329.2 ± 46.9 | 461.3 ± 70.5 | 1726.6 ± 543.5 | 0.0001 |
Abbreviations: DUS, duplex ultrasonography; IVCD, inferior vena cava diameter; IVST, interventricular septal thickness; IVCR, contrast medium reflux into the inferior vena cava; LVD, left ventricle diameter; LPAD, left pulmonary artery diameter; LPOI, left pulmonary artery obstruction index; LVWT, left ventricle wall thickness; MPAD, main pulmonary artery diameter; MPOI, main pulmonary artery obstruction index; RPAD, right pulmonary artery diameter, RVWT, right ventricle wall thickness; RPOI, right pulmonary artery obstruction index; RVD, right ventricle diameter; SD, standard deviation; SVCD, superior vena cava diameter
aGroup 1, negative CTPA and DVT findings; group 2, positive CTPA and negative DVT findings; group 3, positive DVT and CTPA findings.
bValues are expressed as mean ± SD unless otherwise indicated.
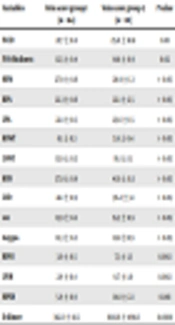
| Variables | Vein score group 1 (n = 64) | Vein score group 2 (n = 10) | P value |
|---|---|---|---|
| IVCD | 21.7 ± 0.6 | 25.6 ± 1.8 | 0.01 |
| IVST | 12.5 ± 0.4 | 14.8 ± 0.9 | 0.02 |
| MPAD | 27.9 ± 0.6 | 28.9 ± 1.3 | > 0.05 |
| RPAD | 22.3 ± 0.6 | 22.1 ± 2.5 | > 0.05 |
| LPAD | 22.1 ± 0.5 | 23.6 ± 1.5 | > 0.05 |
| RVWT | 6.1 ± 0.3 | 5.9 ± 0.4 | > 0.05 |
| LVWT | 13.9 ± 0.5 | 16.1 ± 1.1 | > 0.05 |
| RVD | 37.8 ± 0.9 | 41.6 ± 0.3 | > 0.05 |
| LVD | 41.1 ± 0.9 | 36.2 ± 3.1 | > 0.05 |
| SVCD | 15.9 ± 0.2 | 15.5 ± 0.9 | > 0.05 |
| Azygos | 12.3 ± 0.2 | 12.8 ±0.9 | > 0.05 |
| RPOI | 3.0 ± 0.5 | 7.3 ± 1.3 | 0.002 |
| LPOI | 2.9 ± 0.4 | 6.7 ± 1.0 | 0.002 |
| MPOI | 5.9 ± 0.9 | 14.0 ± 2.1 | 0.001 |
| D-dimer | 382.3 ± 41.5 | 1643.6 ± 498.6 | 0.0001 |
Abbreviations: IVST, interventricular septal thickness; IVCD, inferior vena cava diameter; LPAD, Left pulmonary artery diameter; LVD, left ventricle diameter; LVWT, left ventricle wall thickness; LPOI, left pulmonary artery obstruction index; MPAD, main pulmonary artery diameter; MPOI, main pulmonary artery obstruction index; RPAD, right pulmonary artery diameter; RPOI, right pulmonary artery obstruction index; RVD, right ventricle diameter; RVWT, right ventricle wall thickness; SD, standard deviation; SVCD, Superior vena cava diameter.
aGroup 1 (negative DVT findings) and group 2 (positive DVT findings).
bValues are expressed as mean ±SD.
The RV/LV short axis relationship and azygos vein diameter were correlated with the rate of pulmonary artery obstruction (Table 1).
Leftward septal bowing was negatively correlated with IVC diameter and interventricular septal thickness (P < 0.005). Leftward septal bowing was positively correlated with left ventricular diameter and the RV/LV short axis ratio (P < 0.005). Leftward septal bowing was negatively correlated with the right PAOI, left PAOI, and total PAOI (Table 3).
| IVCD | IVCR | IVST | MPAD | RPAD | LPAD | LVWT | RVWT | RVD | LVD | SVCD | Azygos | RPOI | LPOI | MPOI | D-dimer | |
|---|---|---|---|---|---|---|---|---|---|---|---|---|---|---|---|---|
| IVCD | - | * | * | * | * | * | * | * | * | * | * | |||||
| IVCR | * | - | * | * | * | * | * | * | * | * | * | |||||
| IVST | * | * | - | * | * | * | * | * | * | * | * | * | * | |||
| MPAD | * | * | * | - | * | * | * | * | * | * | ||||||
| RPAD | * | * | * | * | - | * | * | * | * | * | * | |||||
| LPAD | * | * | * | * | * | - | * | * | * | * | * | |||||
| LVWT | * | - | * | * | * | * | * | * | ||||||||
| RVWT | * | - | * | * | * | |||||||||||
| RVD | * | * | * | * | * | * | - | * | * | * | * | * | ||||
| LVD | * | * | - | * | * | * | * | |||||||||
| SVCD | - | * | ||||||||||||||
| Azygos | * | * | * | * | * | * | * | - | * | * | * | |||||
| RPOI | * | * | * | * | * | * | * | * | * | * | * | - | * | * | * | |
| LPOI | * | * | * | * | * | * | * | * | * | * | * | * | - | * | * | |
| MPOI | * | * | * | * | * | * | * | * | * | * | * | * | * | - | * | |
| D-dimer | * | * | * | * | * | * | - |
Abbreviations: IVCD, inferior vena cava diameter; IVCR, contrast medium reflux into the inferior vena cava; IVST, interventriculer septal thickness; LPAD, left pulmonary artery diameter; LVD, left ventricle diameter; LVWT, left ventricle wall thickness; LPOI, left pulmonary artery obstruction index; MPAD, Main pulmonary artery diameter; MPOI, main pulmonary artery obstruction index; RPOI, right pulmonary artery obstruction index; RPA, right pulmonary artery diameter; RVWT, right ventricle wall thickness; RVD, right ventricle diameter; SVCD, superior vena cava diameter.
Reflux of the contrast agent in the IVC was significantly correlated with the diameter of IVC (P < 0.005), interventricular septum thickness (P = 0.003), diameter of the right and left pulmonary artery (P < 0.005), diameter of the right ventricle (P < 0.005), short axis RV/LV ratio (P = 0.001), right pulmonary artery obstruction rate (P = 0.006), left pulmonary artery obstruction rate (P = 0.02), rate of left pulmonary artery obstruction, and rate of total pulmonary artery obstruction (P = 0.006)
5. Discussion
Specific studies of the exact prevalence of DVT and lower extremity clot load scores of patients with PE, and also the relationship between venous clot load and the severity of PE are unavailable. Imaging and an evaluation of clot load volume in lower extremity veins may be significant for the management, treatment, and prognosis of patients with PE. Therefore, it would be beneficial to research if the PE recurrence rate is higher in patients with a high DVT score. Ghaye et al. demonstrated a good correlation between the severity of PE and lower extremity venous score severity (1).
Severe or massive PE can cause acute right heart failure and circulatory failure (4). Therefore, quantitative cardiac CT measurements can be used for identification of signs of acute right heart failure, thus indicating severe and potentially fatal PE, which is well correlated with clinical severity. Manifestations of right heart failure at CTPA include the dimensions of the ventricles, RV/LV diameter ratio > 1; leftward septal bowing, and increased azygos vein diameter (5-8).
In the study conducted by Osman and Abdeldayem it was found that the CT RV/LV ratio was the most sensitive parameter to predict RV dysfunction, followed by pulmonary artery diameter. They found the PAOI cut-off value as 45% for mortality and 35% for intensive care unit (ICU) admission, and 27.5% for right ventricular dysfunction (9).
In a meta-analysis study, an abnormally higher proportion of RV/LV diameters was found associated with adverse outcomes with a 5-fold higher risk of mortality related to PE and approximately 2.5 times the risk of mortality from all causes (10).
In a study, the PAOI score and RV/LV ratio were higher using multiple detector computed tomography (MDCT) in patients with right ventricular dysfunction with echocardiography (ECHO) (11). Wu et al. (12), van der Meer et al. (5), and Collomb et al. (6) reported that pulmonary artery clot load score could be used as an indicator of the hemodynamic severity of a pulmonary embolism and a predictor of death in patients with pulmonary emboli.
In our study, the RV/LV short axis relationship, interventricular thickness of the septum, presence of a septum arch to the left, interventricular thickness of the septum, IVC diameter, reflux of contrast agent in the IVC, and the diameter of the main, left and right, and pulmonary artery was statistically greater in patients with PE than in the normal group, and was also associated with PAOI.
In addition, we found IVC diameter, interventricular septal thickness, PAOI, and serum D-dimer values were significantly correlated with lower extremity clot load score (Table 3).
The wall thickness of RV was statistically thinner and the wall thickness ratio of RV wall/LVwall was greater in patients with PE compared to the normal group, and these were associated with PAOI. However, no significant differences were determined between the groups with and without DVT (groups 3 and 2, respectively). We suggest that this result may be due to the small number of patients in the study group, so this relationship should be evaluated in larger series.
In conclusion, CTPA is a non-invasive first-line imaging modality for the diagnosis of PE and the detection of acute right ventricle dysfunction, thus indicating severe and potentially fatal pulmonary embolism, which is well correlated with clinical severity. Also, the addition of lower extremity venous DUS allows an accurate evaluation of underlying DVT, the major risk for recurrent PE, and lower extremity clot load, which is correlated with PE severity.
