


1. Background
Pulmonary thromboembolism (PTE) is one of the major causes of cardiovascular deaths. PTE has high mortality and morbidity potential, hence fast and accurate diagnosis remains to be an important issue (1, 2).
Computed tomographic angiography (CTA) has become the gold standard diagnostic examination for suspected PTE after the introduction of multidetector computed tomography with its high temporal and spatial resolution (3). When compared with echocardiography, CTA provides more comprehensive benefits for the assessment of clot load in the pulmonary artery, the underlying lung disease, and other causes of acute chest pain (4-6). Clot load on the pulmonary arteries can be calculated by using various scoring systems. In addition, data that can help the assessment of PTE severity such as the ratio of right ventricle diameter to left ventricle diameter (RV/LV ratio) can be obtained (7, 8).
Pulmonary arteries are displayed angiographically with dual energy computed tomography (DECT). Furthermore, perfusion information can be obtained by calculating the iodine distribution in the lung parenchyma and evaluating the iodine perfusion maps visually. When compared with the other CT systems, acquisition of the perfusion information without an increase in the radiation dose is an important advantage of DECT (9). Iodine perfusion maps provide guidance in detection of peripheral thromboembolism which can not be monitored angiographically. In addition, there are various perfusion scoring systems based on these iodine perfusion maps which are candidates to be used in the assessment of the severity of PTE (10-12).
2. Objectives
The objective of this study was to determine the value of perfusion defect score (P score) in the detection of the severity of PTE and to correlate it with pulmonary obstruction score (Qanadli score), other CTA and clinical parameters such as echocardiography.
3. Patients and Methods
3.1. Patient Population
Dual energy CT scans of patients who underwent CTA examination with clinical suspicion of acute PTE were reviewed. We excluded the patients without pulmonary embolism (PE) (based on the radiology reports), and the patients in which we could not reach the clinical data. We reviewed CTA images initially and excluded the patients with manifest artifacts, masses or underlying diffuse parenchymal disease which may affect the scoring systems adversely. The study population involved a total of 55 patients (33 women, and 22 men; age range: 21 - 90 years) who were hospitalized with the diagnosis of PTE. This study was approved by the local Research Ethics Committee (Approval Number: 14-4/11) and the requirement for informed consent was waived for this retrospective study.
3.2. CTA Imaging Protocol
All studies were conducted on a single tube DECT scanner with rapid kVp switching (Discovery 750 HD, GE Healthcare; Milwaukee, Wisconsin, USA). The examinations were performed as CTA in dual energy (DE) technique. The DE images were acquired using the spectral imaging mode with rapid kV switch from 140 kVp to 80 kVp during a CT gantry rotation. The axial images were taken on deep inspiration during a single breath hold and included the body part from the thoracic inlet to the diaphragm. A bolus of 1 mL/kg body weight of nonionic contrast material (Iopromide, Ultravist 370, Bayer Schering Pharma, Berlin, Germany) was injected through a catheter in the antecubital vein at the rate of 4 mL/s using an automatic injector. The bolus-tracking method was used for optimizing pulmonary artery (PA) opacification. After termination of contrast agent administration, 50 mL of saline was injected. The scanning parameters were: tube voltage 80/140 kvp; pitch 1.375, collimation 64 × 0.625 mm, reconstruction interval 1 mm; and rotation time 0.5 sn. Images were sent to workstation (GSI viewer, GE Healthcare) for data analysis.
3.3. DECT Data Analysis
Two radiologists with over 5 and 11 years of experience in chest CT reading reviewed the CT images. They were blinded to clinical data of patients. CT images were analyzed simultaneously and by consensus between the two radiologists.
3.4. Cardiac Measurements
Cardiac measurements were calculated through the reconstructed four chamber views. Two-dimensional multiplanar reformatted images of original axial source images were generated in order to obtain reconstructed four chamber views. RV and LV diameters were measured by identifying the widest distance between the ventricular endocardium and the interventricular septum at the plane of tricuspid and mitral valves, respectively. Then, RV/LV ratio was calculated. A ratio of RV/LV > 1 was considered as an indication of right ventricular dysfunction. The main PA diameter was measured perpendicular to its long axis, from inner wall to inner wall, on an axial source image in which the main PA run parallel to the axial plane (Figure 1).
 and left ventricle (LV) diameters were measured by identifying the widest distance between the ventricular endocardium and the interventricular septum. The ratio of RV to LV diameters was calculated (A). Pulmonary artery (PA) diameter was measured perpendicular to its long axis, from the inner wall to the inner wall, on an axial source image (B).")
Axial CT images of a 53-year-old female patient presenting with shortness of breath. Right ventricle (RV) and left ventricle (LV) diameters were measured by identifying the widest distance between the ventricular endocardium and the interventricular septum. The ratio of RV to LV diameters was calculated (A). Pulmonary artery (PA) diameter was measured perpendicular to its long axis, from the inner wall to the inner wall, on an axial source image (B).
3.5. Pulmonary Obstruction Score
To quantify the pulmonary obstruction, we used “Qanadli score” which was defined by Qanadli et al. (13). Ten segmental pulmonary arteries (three to the upper lobes, two to the middle lobes or lingula, and five to the lower lobes) are in the foreground of this scoring system. In each patient, the central and peripheral segmental (i.e. segmental) arteries were scored with regard to the degree of vascular obstruction. The severity of vascular obstruction was indicated as 0 if no filling defect was present, 1 for partial obstruction and 2 for complete obstruction. With this scoring system, the maximum CT obstruction index could be 40.
3.6. Perfusion Defect Score
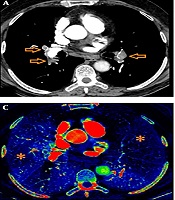
Iodine perfusion maps were created on the workstation with a dedicated software package. Various color coded or grey-scaled schemes were available in order to evaluate the iodine perfusion maps. In our study, we aimed to show wedge-shaped perfusion defects using “rainbow” as color coded scheme (Figure 2). The extent of those perfusion defects were visually assessed as darker shade on color coded iodine maps. Care was taken not to involve pseudo-defects related to beam hardening artifact.
 and coronal (B) CTA images of a 48-year-old male patient presenting with dyspnea. Filling defects suggesting thromboembolism are seen (arrows). There are perfusion defects on “rainbow” colour coded iodine perfusion maps in axial (C) and coronal (D) planes (stars).")
Axial (A) and coronal (B) CTA images of a 48-year-old male patient presenting with dyspnea. Filling defects suggesting thromboembolism are seen (arrows). There are perfusion defects on “rainbow” colour coded iodine perfusion maps in axial (C) and coronal (D) planes (stars).
We used “P score” defined by Thieme et al. as the perfusion scoring system (11). We assessed the six anatomical pulmonary lobes visually to obtain lobar scores of each lobe by using a gradation system based on the percentage of perfusion defect in the lung parenchyma (Table 1). Thereafter, we multiplied this score with a weighting factor in accordance with the number of lung segments of each pulmonary lobe. Addition of those weighted scores revealed a “perfusion defect score” (total P score) of the whole lung ranging from a minimum value of 0 to a maximum value of 100. We also divided the lung parechyma into four quadrants to correlate Qanadli score and P score in a more elaborative way (two lower quadrants included the lower lobes and two upper quadrants included the upper lobes and right middle lobe/lingula). During the analysis, we correlated not only the total scores (total P score, total Qanadli score) but also the scores of quadrants between each other.
| Grade | Percentage | Perfusion defect score |
|---|---|---|
| Grade 0 | 0 | No perfusion defect |
| Grade 1 | 1 - 25 | Subtle perfusion defect |
| Grade 2 | 26 - 50 | Moderate perfusion defect |
| Grade 3 | 51 - 75 | Severe perfusion defect |
| Grade 4 | 76 - 99 | Subtotal perfusion defect |
| Grade 5 | 100 | Complete perfusion defect |
Calculation of Perfusion Defect Score
3.7. Echocardiographic and Clinical Data
Echocardiographic and clinical data of the patients during their hospitalization were evaluated. Echocardiographic data was available in 39 patients. Two-dimensional transthoracic echocardiography was performed by cardiology fellows by using parasternal long-axis, subcostal short-axis, and apical four-chamber views as the standard protocol for evaluation of RV size and function. RV dilatation and RV dysfunction were recorded. RV dysfunction was based on the presence of RV hypokinesis and paradoxic motion of the interventricular septum or reduced RV ejection fraction.
We analyzed partial pressure of arterial oxygen (PaO2), partial pressure of arterial carbon dioxide (PaCO2), PaO2/fraction of inspired oxygen (FiO2), and oxygen saturation values to get arterial blood gas analysis data. PaO2/FiO2 ratio was used to evaluate the severity of ventilation/perfusion mismatch. Chronic diseases, predisposing factors, mortality and the hemodynamic indicators including pulse and blood pressure were assessed additionally. If patient death was defined after objective confirmation of symptomatic PE in the absence of any alternative diagnosis, they were considered to have died of PE.
3.8. Statistical Analysis
The statistical assessment was performed using SPSS Statistics for Windows software released 2017, version 25.0 (IBM Corp. Armonk, N.Y., USA). We calculated the correlation coefficient (r) to evaluate the interaction between Qanadli score, P score and the other data (cardiac parameters, hemodynamic data, and arterial blood gas analysis). We used Shapiro-Wilk test as the normality test. Correlation calculation was performed with Spearman's rho coefficient as a nonparametric correlation method. The echocardiographic data was evaluated with nonparametric Mann Whitney U test. We made the comparison of the data with P score and Qanadli score. A P value of < 0.05 was considered to indicate statistical significance in both analyses.
4. Results
The mean age of study patients was 64 years (range, 21 - 90 years). All patients were hospitalized at the respiratory disease clinic. Six patients (10.9 %) did not benefit from treatment and died within 45 days. When we considered the predisposing factors of PTE, the immobility history was present in 43 of survivors (67.1 %). Five of the nonsurvivors (83.3%) were over the age of 65. The most common comorbid condition was hypertension (26.6 %). The clinical characteristics of patient population is summarized in Table 2.
| Patient demographics | No. (%) |
|---|---|
| Predisposing factors | |
| None | 5 (7.8) |
| Malignancy | 14 (21.8) |
| Immobility | 43 (67.1) |
| Oral contraceptive consumption | 1 (1.6) |
| Surgery | 12 (18.7) |
| Obesity | 1 (1.6) |
| Age > 65 | 27 (42.1) |
| Genetic factors | 2 (3.1) |
| Comorbidities | |
| Congestive heart failure | 5 (7.8) |
| Ischemic heart disease | 5 (7.8) |
| Hypertension | 17 (26.6) |
| Chronic obstructive pulmonary disease | 4 (6.2) |
| Malignancy | 7 (10.9) |
| Diabetes | 8 (12.5) |
| Chronic renal failure | 2 (3.1) |
| Cerebrovascular disease | 5 (7.8) |
| Interstitial lung disease | 2 (3.1) |
| Pneumonia | 1 (1.6) |
Patient Demographics
4.1. CT Obstruction and Perfusion Scores
We evaluated 220 quadrants in 55 patients in order to calculate Qanadli scores and P scores. Thromboembolic filling defects were observed in 137 of 220 quadrants (62.3%). Concomitant filling defects were also present in these quadrants. We detected neither thromboembolism nor perfusion defect in 39 of 220 quadrants (17.7%). In 4/220 quadrants (1.8 %), we could not determine any filling defect in pulmonary arteries accordant with clot, but we observed perfusion defect. On the contrary, in 40/220 quadrants (18.2%), thromboembolism was observed as filling defect in pulmonary arteries, but there were no concomitant perfusion defects.
As a result of correlation analysis, a significant positive correlation was found between total P score and total Qanadli score (n = 55, r = 0.748, P < 0.001) (Figure 3). Besides, in the evaluation of lung quadrants, there was a significant positive correlation between P scores and Qanadli scores between each other (Table 3).
| N = 55 | P score (right upper quadrant) | P score (right lower quadrant) | P score (left upper quadrant) | P score (left lower quadrant) |
|---|---|---|---|---|
| Qanadli score (right upper quadrant) | r = 0.631 (P < 0.001) | |||
| Qanadli score (right lower quadrant) | r = 0.588 (P < 0.001) | |||
| Qanadli score (left upper quadrant) | r = 0.692 (P < 0.001) | |||
| Qanadli score (left lower quadrant) | r = 0.799 (P < 0.001) |
Correlation of P Score and Qanadli Score
 and total pulmonary obstruction score (Qanadli score)")
Correlation graph of total perfusion defect score (P score) and total pulmonary obstruction score (Qanadli score)
4.2. Relationship Between Ventricular Ratio and CT Obstruction and Perfusion Scores
There was a significant positive correlation between total P score and RV/LV ratio (n = 55, r = 0.432, P = 0.001). Moreover, we found significant positive correlation between total Qanadli score and RV/LV ratio (n = 55, r = 0.424, P = 0.001) (Figure 4). Considering the correlation coefficients, a slight superiority of total P score to total Qanadli score was seen. As for PA diameter, no statistically significant correlation could be demonstrated neither with the total P score nor with the total Qanadli score.
 and right ventricle (RV)/ left ventricle (LV) ratio, and total pulmonary obstruction score (Qanadli score) and RV/LV ratio")
Correlation graphs of total perfusion defect score (P score) and right ventricle (RV)/ left ventricle (LV) ratio, and total pulmonary obstruction score (Qanadli score) and RV/LV ratio
4.3. Correlation Between CT Findings and Echocardiographic/Clinical Data
Blood gas analysis (PaO2, PaCO2, PaO2/FiO2, O2 saturation) and hemodynamic data (pulse, blood pressure) were obtained from 55 patients within the study and evaluated as clinical parameter for PTE severity. We couldn’t demonstrate a significant correlation between these parameters and total P score or total Qanadli score (Table 4).
| Total P score | Total Qanadli score | |||
|---|---|---|---|---|
| r | P | r | P | |
| RV/LV ratio | 0.432 | 0.001 | 0.424 | 0.001 |
| PA diameter | n.s | n.s | ||
| PaO2 | n.s | n.s | ||
| PaCO2 | n.s | n.s | ||
| PaO2/FiO2 | n.s | n.s | ||
| O2 saturation | n.s | n.s | ||
| Blood pressure | n.s | n.s | ||
| Pulse | n.s | n.s | ||
Results of Correlation Analysis
Echocardiographic data was present in 39 patients (70.9 %). The results of nonparametric Mann Whitney U test showed that, P score was significantly higher in patients with RV dilatation (n = 18, P = 0.022) and RV dysfunction (n = 22, P = 0.001) (Figure 5). Likewise, similar interaction was present in between Qanadli score and RV dilatation (n = 18, P = 0.023) and RV dysfunction (n = 22, P = 0.003).
 and right ventricle (RV) dilatation, and total P score and RV dysfunction")
Box plot graphs of total perfusion defect score (P score) and right ventricle (RV) dilatation, and total P score and RV dysfunction
5. Discussion
Dual energy computed tomography (DECT), not only detects of thromboembolic filling defects but also similar to radionuclide perfusion scintigraphy provides functional perfusion information by generating iodine distribution maps (11, 12).
In this study, we investigated the effectiveness of DECT system in evaluation of PTE severity by means of revealing correlation of P score with Qanadli score, other CTA parameters including RV/LV ratio and PA diameter, echocardiographic data and clinical parameters.
There are various perfusion scoring systems based on these iodine perfusion maps which are candidate to be used in the assessment of severity of PTE. Since it is easy to use we preferred the “P score” defined by Thieme et al. (11). As to the “Qanadli score”, it is one of the pulmonary artery obstruction scoring systems proposed recently and designed to quantitatively assess the severity of acute PTE at CTA. Wu et al. and van der Meer et al. found the Qanadli score to be a significant predictor of death at their CTA studies (8, 14-16).
To calculate Qanadli scores and P scores, 220 quadrants in 55 patients were evaluated and a significant positive correlation between entire P scores and Qanadli scores was determined. Also, a significant positive correlation was found between total P score and total Qanadli score (n = 55, r = 0,748, P < 0.05). This result is of considerable importance and shows that P score can have an effective role in the evaluation in PTE severity as Qanadli score. Similar to our study, Chae et al. performed DECT in 30 PTE patients and established a perfusion defect score based on a visual assessment of each lung segment. A good correlation was seen with this score and the Qanadli score (12). Thieme et al. evaluated 63 patients in their study, and found strong correlation between P score and the Mastora score (11).
Although we could not detect any clot in the pulmonary artery branches, there were perfusion defects in iodine perfusion maps in 1.8 % of lung quadrants. Thieme et al. also mentioned decreased iodine content in 5.8 % of lung lobes without presence of embolic clots (11). Perfusion defects in these patients may be related to pulmonary arterial vasoconstriction mediated by hypoxia (11). In addition, there can be subtle undetectable thromboembolic filling defects localized in tiny peripheral PA branches leading perfusion defects. Thus, iodine perfusion maps might add important functional information in addition to vascular filling defects.
There are studies emphasizing the effectiveness of RV/LV ratio in the prediction of PTE severity (17-20). Araoz et al. showed that the patients with RV/LV ratio > 1.5 have 3.6-fold increase at risk of admission to the intensive care unit (18). Reid and Murchison stated that PTE causes a decrease in cardiac output by leading to RV dilatation and as a result, RV/LV ratio becomes higher than 1.5 (20). Ghaye et al. revealed a significant relationship between increased RV/LV ratio and the risk of death in 82 patients that had diagnosis of clinically severe PTE and required admission to the intensive care unit (19). In our study, we found significant positive correlation between total P score and RV/LV ratio (n = 55, r = 0.432, P < 0.05). Chae et al. and Kong et al. showed correlation between their perfusion scoring system and RV/LV ratio (12, 17). Similarly Zhang et al. evaluated 31 patients and found significant correlation between RV/LV ratio and the number of lung lobes seen with perfusion defect (10).
Some of the recent studies suggest that PA diameter is not a meaningful indicator of PTE severity (14-16). Similarly, we could not determine a significant correlation between P score and Q score and the PA diameter. The role of PA diameter in determining the severity of PTE is controversial.
Echocardiographic data was available in 70.9% of the cases. The echocardiographic detection of RV dysfunction is an important sign of prognosis related with high complication and mortality in patients with acute PE (20-22). In our study, P score and Qanadli score was significantly higher in patients with RV dilatation and RV dysfunction. It is essential to mention the importance of the analysis results of nonsurvivors briefly. Six patients (10.9 %) did not benefit from treatment and died within 45 days. Echocardiographic examination was performed on four of them. Although it seems as an inadequate number to make analysis, we established an important point to be considered. Four of these patients had RV dysfunction and RV dilatation on echocardiography. The RV/LV ratio was greater than one in three of them. Moreover they had high P scores ranging in between 55 - 75 (mean P score was 63.75). Comprehensive studies with larger patient population may strengthen this association.
Low PaO2 values can be seen with the other lung diseases, hence we cannot accept hypoxemia as a specific indicator of PTE severity. PIOPED study suggest that PaO2 levels show no difference between PTE diagnosed patients that have additional cardiopulmonary disease or not (23). Huet et al. reported in their study that at least %80 of the patients with a diagnosis of PTE were hypoxemic (24). Similarly, Metafratzi et al. showed a significant correlation between PaO2 value and Qanadli score (25). Thieme et al. reported no correlation between the P score and oxygen saturation (11). In our study, there was no significant correlation between PaO2 value and either P score or Qanadli score. Since this is a retrospective study, we can not verify whether the saturation measurement was done before oxygen support or not.
Our study has several limitations. The main limitation is the retrospective design. Due to the retrospective design, the number of patients that were included in the whole clinical data was limited. The number of patients with adverse clinical outcome was also small. Congestive heart failure might be a confounding factor in the evaluation of P score and echocardiography and was present in five of our patients. Regarding the limitations mentioned above, our findings suggest importance of P score in detection of PE severity. Comprehensive studies with larger patient population may be more favorable to show correlation between P score and clinical parameters.
In conclusion, in acute pulmonary thromboembolic disease, assessment of perfusion score on DECT is a good adjunctive tool to other CTA parameters and echocardiography in detection of PTE severity.
Addition of perfusion changes to the clinical risk assessment will help in management of patients.
