


1. Background
Pulmonary embolism (PE) is a common life threatening condition. After heart attack and stroke it is the third most common cause of death from cardiovascular disease (1). Accurate and immediate diagnosis is crucial for initiation of appropriate treatment.
Multidetector computed tomography (MDCT) angiography is considered as the gold standard imaging modality in the evaluation of acute pulmonary embolism (2). Beyond morphologic assesment, dual energy computed tomography (DECT) in this era has led to improved image quality and functional data information at the same radiation dose (3). An important advantage of DECT imaging is its ability to generate virtual monoenergetic images at different energy levels and give information about the behavior of substances at these energy levels (3). Initial DECT studies have investigated the added value of generated perfusion maps in PE imaging (4, 5). In daily practice, one of the important challenges in PE imaging is the suboptimal enhancement at the level of pulmonary arteries (6). The poor enhancement may be related to respiratory motion, hemodynamic effects or inappropriate bolus timing (6). An additional pulmonary CT angiography may be necessary in such cases with equivocal findings leading to an extra radiation and contrast burden. DECT imaging datasets are acquired at multiple X ray energy levels and virtual monoenergetic images (VMI) are generated from these datasets simulating acquisitions obtained at low X ray energy levels (3). The iodine in contrast material appears brighter at energy levels close to k-edge of iodine (33.2 keV). This feature can be used to enhance vascular opacification at low energy levels (7).
2. Objectives
The purpose of this study was to investigate the potential improvement in pulmonary artery attenuation in patients with suboptimal CT angiography using fast switch kVp dual energy CT. We also aimed to assess the change in image quality parameters in VMI in comparison to standard pulmonary CT angiography.
3. Patients and Methods
This study was approved by the medical ethics committee of our institution (approval number:19-3.1T/70). Informed consent was obtained from all patients. Between May 2017 to March 2018, DECT angiography images of 877 emergency department patients who were referred to radiology department with a preliminary diagnosis of pulmonary embolism were retrospectively reviewed. Exclusion criteria included history of severe allergic reaction to iodinated contrast material, renal failure (eGFR < 30 ml/min) and patient age < 18 years.
Pulmonary artery Hounsfield Unit (HU) measurements were performed to detect limited attenuation. Suboptimal contrast enhancement was defined as computed tomography (CT) attenuation values at lower than 200 HU. Sixty patients (mean age: 59.4 ± 3.2, male: 39, female: 21) with suboptimal enhancement were involved.
3.1. Dual Energy Computed Tomography Imaging
The DECT examinations were performed on a single tube DECT scanner with rapid kVp switching (Discovery CT 750 HD (GE Healthcare, Waukesha, WI, USA). CT angiography imaging was performed using spectral imaging mode with fast tube voltage switching between 80 kVp and 140 kVp during a single rotation. The axial images were acquired craniocaudally at shallow inspiration and included the body part from thoracic inlet to the diaphragma. A total of 1 ml/kg body weight of nonionic contrast material was injected through a catheter in the antecubital vein at a rate of 4 mL/s using an automatic injector. After termination of contrast agent administration, 50 mL of saline chaser was injected. The bolus-tracking method was used for optimizing PA opacification. A region of interest (ROI) was placed in the main pulmonary artery and image acquisition started 7 s after the signal attenuation reached the threshold of 100 HU in the main pulmonary artery. The scanning parameters were; tube current 600 mA, tube voltage 80/140 kVp, pitch 1.375, collimation 1.25 mm, and rotation time 0.5 sn. Two image series were reconstructed. One set of axial CT angiography images were used as reference standard (soft tissue kernel, 140 kVp, slice thickness: 1 mm, increment:0.5 mm) and a second set of monochromatic images (soft tissue kernel, adjustable range from 40 keV to 140 keV; slice thickness: 1 mm, increment:0.5 mm) used to generate VMI. Images were sent to workstation (Gemstone Spectral Imaging viewer software, GE Healthcare) for data review and analysis. VMI were generated using the dedicated workstation. VMI were generated in the range of 40 to 80 keV at 5 keV intervals and 80 to 120 keV at 10 keV intervals.
3.2. Image Analysis
VMI were reviewed by two radiologists with 14 years and 7 years experience. Circular ROI (average size: 1.0 cm2) was placed in the main trunk of the pulmonary artery just before pulmonary bifurcation and in the proximal part of the right and left pulmonary arteries. To determine the image noise, a ROI was placed in the trapezius muscle (average size: 1.0 cm2) and in the presternal air (average size: 1.0 cm2). At these ROIs, the mean attenuation (signal) and standard deviation in attenuation (noise) were measured. All measurements were performed on standard 140 kVp image and on VMI with an increment of 5 keV from 40 to 80 keV and 10 keV from 80 to 120 keV.
The signal to noise ratio (SNR) and the contrast noise ratio (CNR) were calculated with the following formulas:
SNR: SI (artery)/noise (artery)
CNR: SI (artery)- SI (muscle)/background noise
SI; indicates mean signal intensity. The signal was calculated as the mean HU within
the ROI, and noise was calculated as the SD of the pixel values.
A consensus read was performed by two radiologists (clinical experience of more than 10 years of thoracic imaging) to provide the optimal image score. These readers were blinded to imaging results. The overall image quality was subjectively scored in 60 patients with suboptimal pulmonary artery opacification on a 5-point scale increasing image quality from 1 to 5. The readers were allowed to modify the preset window settings (window level: 50 HU, window width: 350 HU) at different energy levels to determine the optimal image score.
Images were rated as follows:
1= nondiagnostic (hard to visualize the vasculature due to the background noise)
2= suboptimal quality (less than 25% of peripheral vessels are visualized, major noise limiting visualization)
3= adequate quality (25% - 50% of peripheral vessels are visualized, moderate noise)
4= good quality (50% - 75% of peripheral vessels are visualized, minor noise)
5= excellent quality (more than 75% of peripheral vessels are visualized, no noise).
Best images were selected as the studies that reached a main pulmonary artery opacification greater than 200 HU using different virtual monoenergy levels and that also had an image quality rating ≥ 3. Fifty six studies that met these criteria were considered as salvaged. At this best energy level quantitative parameters were compared with standard 140 kVp images.
Pulmonary embolism was detected in nine patients. We evaluated the differences in attenuation between the vessel and the emboli. A circular ROI was placed on the endoluminal clot (average size: 20 - 70 mm2 depending on the clot size) and on the pulmonary artery proximal to the clot (average size: 1.0 cm2) to measure the attenuations.
Contrast to noise ratio was measured. The following formula was used:
CNR clot = (ROI2 - ROI1)/SD2
ROI1 indicates the mean CT attenuation of the clot
ROI2 indicates the mean CT atteuation of the pulmonary artery proximal to the embolus
SD2 indicates the standard deviation of pulmonary artery CT attenuation values.
CNR clot measurements were performed from the standard and the best energy level images.
3.3. Statistical Analysis
The study data were analyzed by using dedicated statistical software IBM Corp. Released 2017 SPSS Statistics for Windows, version 25.0 (IBM Corp. Armonk, N.Y.USA). The quantitative data were expressed as mean ± standard deviation. The Wilcoxon signed-rank test was used to assess the differences in CNR, SNR and noise at different virtual energy levels.
The comparison between VMI and standard images were performed using paired t-test. The value of P < 0.05 was considered statistically significant. The Wilcoxon signed-rank test was used to compare the contrast to noise ratio of pulmonary embolism in standard and VMIs.
4. Results
The dual energy chest CT angiography images of 877 emergency department patients who were referred to our department with a preliminary diagnosis of pulmonary embolism were reviewed. Suboptimal enhancement (< 200 HU) was present in 60 studies. The study population consisted of 39 male, and 21 female patients with the age range of 20-88 years (mean age ± SD, 59.4 ± 3.2 years). The mean attenuation of main pulmonary artery was 172.61 ± 23.4 in standard (140 keV) images. The mean SNR and CNR in standard images were 12.1 ± 5.3 and 9.2 ± 4.3. The mean attenuation of main pulmonary artery, SNR and CNR at different virtual monoenergy levels in patients with suboptimal pulmonary artery opacification is summarized in Table 1.
| Main pulmonary artery attenuation (mean HU ± standard deviation) | SNR (mean HU ± standard deviation) | CNR (mean HU ± standard deviation) | |
|---|---|---|---|
| 40 keV | 543.11 ± 123.0 | 19.8 ± 7.9 | 17.2 ± 7.2 |
| 45 keV | 444.76 ± 97.8 | 18.2 ± 7.2 | 15.6 ± 6.5 |
| 50 keV | 363.44 ± 77.2 | 16.6 ± 6.6 | 14.0 ± 5.9 |
| 55 keV | 302.97 ± 63.9 | 15.4 ± 6.2 | 12.8 ± 5.4 |
| 60 keV | 253.92 ± 52.62 | 16.7 ± 7.6 | 13.5 ± 6.3 |
| 65 keV | 215.29 ± 43.5 | 17.4 ± 8.0 | 13.7 ± 6.6 |
| 70 keV | 185.31 ± 36.3 | 15.2 ± 6.6 | 11.6 ± 5.4 |
| 75 keV | 161.37 ± 30.0 | 12.6 ± 5.2 | 9.3 ± 4.2 |
| 80 keV | 141.59 ± 26.4 | 10.5 ± 4.3 | 7.5 ± 3.4 |
| 90 keV | 113.16 ± 20.6 | 9.6 ± 3.8 | 6.5 ± 3.0 |
| 100 keV | 93.0 ± 16.9 | 8.5 ± 3.4 | 5.3 ± 2.6 |
| 110 keV | 78.74 ± 14.7 | 7.5 ± 3.2 | 4.2 ± 2.3 |
| 120 keV | 68.83 ± 13.2 | 6.8 ± 2.9 | 3.5 ± 2.1 |
Mean Pulmonary Artery Attenuation, SNR, CNR of Patients with Suboptimal Enhancement at Multiple Different Energy Levels
Using the VMIs; the best image was determined as the image that had a main pulmonary artery opacification greater than 200 HU and an image quality rating ≥ 3. Fifty six studies that met these criteria were considered as salvaged. The optimal energy level for salvage was 60 keV for 23 patients (41.0 %), 65 keV for five (8.9 %), 55 keV for 19 (33.9 %), 50 keV for eight patients (14.2 %) and 40 keV for one patient (1.7 %). At this best energy level, quantitative parameters were compared with the standard (140 kVp) image.
The mean attenuation of pulmonary artery in standard images of these 56 salvaged studies was 172.61 ± 23.4, SNR and CNR ratio were 12.1 ± 5.3 and 9.2 ± 4.3. The mean attenuation at different virtual monoenergy levels of this salvaged subgroup is summarized in Table 2.
| PA 40 keV | PA 45 keV | PA 50 keV | PA 55 keV | PA 60 keV | PA 65 keV | PA 70 keV | PA 75 keV | PA 80 keV | PA 90 keV | PA 100 keV | PA 110 keV | PA 120 keV | |
|---|---|---|---|---|---|---|---|---|---|---|---|---|---|
| Mean HU | 552.22750 | 452.20536 | 369.18911 | 307.91768 | 257.96464 | 218.63893 | 188.16839 | 163.82839 | 143.68696 | 114.76929 | 94.24839 | 79.73911 | 69.46250 |
| Standard deviation | 116.139453 | 92.095828 | 73.024299 | 60.402513 | 49.714779 | 41.234503 | 34.590815 | 29.571767 | 25.384615 | 20.126754 | 16.667909 | 14.623976 | 13.254880 |
| SNR 40 keV | SNR 45 keV | SNR 50 keV | SNR 55 keV | SNR 60 keV | SNR 65 keV | SNR 70 keV | SNR 75 keV | SNR 80 keV | SNR 90 keV | SNR 100 keV | SNR 110 keV | SNR 120 keV | |
| Mean | 20.67847 | 18.97382 | 17.37469 | 16.12447 | 17.48114 | 18.25144 | 15.93960 | 13.14926 | 10.95567 | 10.07415 | 8.91337 | 7.81930 | 7.11704 |
| Standard deviation | 7.620327 | 6.910573 | 6.352450 | 5.910405 | 7.431811 | 7.759004 | 6.394125 | 4.999302 | 4.113964 | 3.693446 | 3.272260 | 3.101984 | 2.862442 |
| CNR 40 keV | CNR 45 keV | CNR 50 keV | CNR 55 keV | CNR 60 keV | CNR 65 keV | CNR 70 keV | CNR 75 keV | CNR 80 keV | CNR 90 keV | CNR 100 keV | CNR 110 keV | CNR 120 keV | |
| Mean | 17.98822 | 16.30152 | 14.69054 | 13.40178 | 14.19957 | 14.45842 | 12.28420 | 9.85676 | 7.96453 | 6.86610 | 5.62212 | 4.50399 | 3.79096 |
| Standard deviation | 6.899493 | 6.200698 | 5.630337 | 5.159194 | 6.272587 | 6.373929 | 5.157883 | 3.977321 | 3.219223 | 2.824688 | 2.447693 | 2.236016 | 2.062776 |
Mean Pulmonary Artery Attenuation, SNR, CNR of Salvaged Patients at Multiple Different Energy Levels
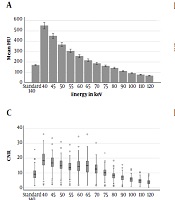
The attenuation of pulmonary artery in VMIs at 40 - 70 keV were significantly higher than standard images (P < 0.001) (Figures 1 and 2A).
 of Chest CT examination shows inadequate opacification of pulmonary artery (178 HU). Virtual monoenergetic images generated at different energy levels (from 40 keV to 120 kev) are seen. Sufficient opacification is achieved at 65 keV (208 HU).")
The axial Dual Energy CT images of 78 year old woman with suspected pulmonary embolism. The standard image (lower row, right image) of Chest CT examination shows inadequate opacification of pulmonary artery (178 HU). Virtual monoenergetic images generated at different energy levels (from 40 keV to 120 kev) are seen. Sufficient opacification is achieved at 65 keV (208 HU).
, SNR (B), CNR (C), and noise (D) in the pulmonary arteries of standart images and virtual monoenergetic reconstructions at different energy levels. The small circles indicate ’outliers’, the stars represent ‘extremes’. The median is indicated as a line across each bar (CNR, contrast to noise ratio; SNR, signal to noise ratio).")
Bar chart or Box- Plots for attenuation (A), SNR (B), CNR (C), and noise (D) in the pulmonary arteries of standart images and virtual monoenergetic reconstructions at different energy levels. The small circles indicate ’outliers’, the stars represent ‘extremes’. The median is indicated as a line across each bar (CNR, contrast to noise ratio; SNR, signal to noise ratio).
Similarly, SNR and CNR were higher than standard images at VMI levels of 40, 45, 50, 55, 60, 65, and 70 keV (P < 0.001) (Figure 2B and C). Distribution of image noise values in different energy levels is summarized in Figure 2D. The mean background noise was significantly higher (P < 0.001) than the standard images at energy levels of 40 - 55 keV. However, the mean background noise was significantly lower (P < 0.05) than standard images at energy levels of 65 - 70 - 75 - 90 - 100 keV.
In the salvaged patients, the attenuation of standard images were compared with the best images. The attenuation of standard images in the main pulmonary artery recovered from 172.61 ± 23.4 to 280.55 ± 40.7. The SNR recovered from 12.1 ± 5.3 to 16.7 ± 7.1 and CNR increased from 9.2 ± 4.3 to 13.7 ± 6.0 (P < 0.001). The average increase in mean pulmonary artery attenuation was 62% (from 172.61 ± 23.4 to 280.55 ± 40.7), the average increase in SNR was 38% (from 12.1 ± 5.3 to 16.7 ± 7.1) and the average increase in CNR was 48% (9.2 ± 4.3 to 13.7 ± 6) (P < 0.001) (Table 3).
| Mean HU | Standard deviation | P | |
|---|---|---|---|
| Standard PA | 172.61946 | 23.463665 | < 0.001 |
| Best PA | 280.55911 | 40.240734 | |
| Standard RPA | 170.83357 | 30.383140 | < 0.001 |
| Best RPA | 296.70982 | 51.379205 | |
| Standard LPA | 168.03893 | 28.845949 | < 0.001 |
| Best LPA | 283.10750 | 49.267423 | |
| Standard PA SNR | 12.12227 | 5.349566 | < 0.001 |
| Best PA SNR | 16.77508 | 7.182433 | |
| Standard RPA SNR | 12.04787 | 5.666597 | < 0.001 |
| Best RPA SNR | 17.69968 | 7.858795 | |
| Standard LPA SNR | 11.83792 | 5.574183 | < 0.001 |
| Best LPA SNR | 16.95697 | 7.727396 | |
| Standard PA CNR | 9.25330 | 4.383872 | < 0.001 |
| Best PA CNR | 13.75121 | 6.037983 | |
| Standard RPA CNR | 9.17891 | 4.885918 | < 0.001 |
| Best RPA CNR | 14.67582 | 6.931463 | |
| Standard LPA CNR | 8.96896 | 4.829860 | < 0.001 |
| Best LPA CNR | 13.93310 | 6.808977 | |
| Standard noise | 18.47286 | 14.115518 | < 0.003 |
| Best noise | 22.55071 | 20.059231 |
Comparison of Image Quality Parameters Between Standard and Best Images
Within patients with suboptimal pulmonary artery opacification, pulmonary embolism was present in nine patients. The optimal energy level for detection of pulmonary embolism was 60 keV in four patients (44.4%), 55 keV for one (11.1%), and 50 keV for four (44.4%) patients in this subgroup. Pulmonary clot to artery contrast-to noise ratio (CNR clot) was measured in these patients from the standard and best images. Standard CNR clot ratio was 5.77 ± 1.73, and best image CNR clot ratio was 10.97 ± 3.54. The CNR clot ratio in best images were significantly higher than standard images (P < 0.05). The graph shows the distribution of CNR clot ratio in standard and best images (Figure 3).

Graph shows the distribution of CNR clot ratio in Standard and best images.
5. Discussion
Optimum vascular enhancement is critical for pulmonary CT angiography studies.
Suboptimal enhancement is observed in approximately 4% - 6% of pulmonary CT angiography
examinations, leading to an indeterminate scan and causing repeated CT angiography or ventilation/perfusion scans (6, 8). In our study, similar to the literature findings, suboptimal enhancement was detected in 6% of the studies (6, 8).
Failure of pulmonary CT angiography due to poor enhancement may be due to various reasons. Inadequate study may be caused by patient-related factors such as obesity or circulatory hemodynamics such as cardiac failure or congenital heart diseases.
Technical factors related to acquisition such as extravasation of contrast medium, insufficient amount of contrast medium for imaging, inadequate contrast delivery rate and incorrect bolus tracking may lead to a suboptimal study (6, 9). Transient interruption of contrast secondary to inspiration occurs due to dilution of contrast with unopacified blood from inferior vena cava and is reported in 22% - 37% of patients (10, 11).
Obtaining optimal intravenous contrast attenuation and high CNR ratio is critical for a good CT angiography examination. To improve the iodine contrast attenuation, single energy low kV pulmonary angiography technique has been suggested to detect pulmonary embolism (12).
Schueller-Weidekamm et al. compared standard 140 kVp CT angiography with the 100 kVp and demonstrated an increase in percentage of central and peripheral pulmonary arteries that could be evaluated with CT angiography (12). Recently, several investigators reported the added value of dual energy CT systems using VMI reconstructions in CT angiography studies (13-16). Sangwaiya et al. reported their dual source CT pulmonary angiography experience that compared the image quality of 80 and 140 kVp image data sets. They detected improvement in image noise and vessel contrast and diagnostic confidence (17).
Delesalle et al. evaluated the thoracic circulation using a dual source dual energy CT at 80/140 kVp and showed that 60 keV monoenergetic reconstructions provided the adequate attenuation in pulmonary arteries with highest SNR and CNR (18).
Ghandour et al, compared conventional (120 kVp) images with the optimal monoenergetic level and showed a significant improvement of attenuation, SNR and CNR using dual layer spectral CT, advocating the 50 keV images as the optimal monoenergetic level (14).
In the current study, we found that the benefit of low kiloelectronvolt VMI is its potential to improve the suboptimal pulmonary CT angiography studies using rapid kVp switch dual energy CT. Several prior studies have assessed dual energy CT for suboptimal enhancement in the pulmonary artery, however the patient population and CT protocols of these studies were heterogeneous (14, 19). Different contrast volumes and acquisition parameters were used. However, our study primarily focused on the group of patients with preliminary diagnosis of PE and were scanned with the same standard PE detection protocol.
As expected, in the current study, we demonstrated an increase in pulmonary artery attenuation towards the lowest energy level, because the lower energy levels approached the k edge of iodine (33.2 keV). However, this distribution was not similar for CNR and SNR due to varying noise ratios at different energy levels. The optimal energy level that balanced noise and attenuation in our study was 55 - 60 keV similar to the literature (18, 20). The virtual monoenergetic reconstructions assisted in salvage of around 93% (56/60) of the scans in our study. When compared with the standard CT angiography images, the salvaged best images yielded a significant improvement in SNR and CNR. The mean SNR and CNR of VMIs at energy levels of 40 - 70 keV were higher when compared with the standard CT angiography images. Bae et al, reported a significant increase in CNR and SNR of VMI images at 40 - 65 keV compared with 120 kVp images similar to our finding (13).
Low kV dual energy CT studies investigated the impact of reduced amount of contrast medium delivery during CT angiography studies (20, 21). Yuan et al. preferred the 50 keV energy level in their fast kV switch dual energy CT study in which they examined the use of reduced iodine dose in pulmonary angiography for the diagnosis of pulmonary embolism. They reported a significant reduction in iodine load and improvement in vascular attenuation compared with the standard protocol (20). The improvement in vascular attenuation at lower energy levels while preserving SNR detected in the current study, supports the feasibility of lower amounts of contrast material.
The number of patients with pulmonary embolism was small in our study group. We evaluated the differences in attenuation between the vessel and the emboli using the CNR clot ratio. Matsumoto et al. and Cheng et al. also investigated the CNR clot ratio in their studies and reported that the best CNR clot ratio was achieved in dual energy CT studies at 70 keV and 50 keV monoenergy levels, respectively (22, 23). In our study, the CNR clot ratio was higher in the best images compared to the standard images in all patients. The optimal energy level for all these patients ranged between 50 - 60 keV.
There are several limitations in our study. First, the study design was retrospective and included a single center experience. Second, the number of patients with PE was limited and we could not reach the control CT angiography study in all these patients, so a comparison with a gold standard was not available. We investigated the quantitative and qualitative image quality data rather than diagnostic performance for detection of PE. Third, in order to determine the adequacy of pulmonary artery opacification level in CT angiography, we accepted a limit of 200 HU. However, this value is preferred as 180 HU in some studies (13). There is no single predetermined standard value that could be used in this regard for pulmonary CT angiography.
In conclusion, the suboptimal opacification in pulmonary artery CT angiography study could be optimized using low energy VMI at rapid kVP switch dual energy CT. At the best selected energy levels, the main pulmonary artery attenuation, SNR and CNR are significantly greater than the standard polyenergetic images.
