


1. Background
Pulmonary sarcomatoid carcinoma (PSC) is a rare and aggressive subtype of non-small cell lung cancer (NSCLC) characterized by the presence of both carcinomatous and sarcomatous components. It represents a small proportion of lung malignancies, accounting for approximately 0.5% (1). Pulmonary sarcomatoid carcinomas are highly heterogeneous and malignant tumors that exhibit resistance to radiotherapy and chemotherapy, posing challenges in identifying effective treatment regimens (2, 3). Clinical guidelines and expert consensus statements specifically addressing PSC may have limitations (4, 5). Typically, management strategies for PSC align with those established for NSCLC. Surgical resection is the primary treatment modality whenever feasible, and it has shown significant improvement in overall survival for early-stage, operable PSC cases, with 5-year survival rates ranging from 11% to 19.5% (6-8).
Conventional imaging modalities such as computed tomography (CT), magnetic resonance imaging (MRI), and positron emission tomography (PET) provide insights into tumor extent, lymph node involvement, and distant metastases. However, the radiological features of PSC are not entirely specific and can resemble other subtypes of NSCLC or even benign entities (9). Therefore, a comprehensive pathological assessment is necessary for a definitive diagnosis. Early detection and diagnosis of PSC are crucial for improving patient outcomes.
Pulmonary inflammatory pseudotumor (PIP) is a non-neoplastic lesion characterized by excessive cell proliferation (10). However, on CT scans, PIPs often present as solid pulmonary masses, which can be potentially misinterpreted as malignancies such as PSCs. This poses a diagnostic challenge and can influence subsequent clinical treatments, including the decision for surgery. Currently, certain CT features have been used to differentiate PIPs from peripheral lung cancers (11, 12), aiming to distinguish between benign and malignant masses based on CT images. However, there is a lack of literature investigating the differentiation of PIPs and PSCs based on clinical and radiological characteristics. This knowledge gap hinders our understanding of these rare diseases and their differentiation ability and impacts the timeliness of surgical interventions and prognosis.
Radiomics has emerged as a promising technique for the in-depth analysis of quantitative features extracted from medical images that are not easily identified by the naked eye. It enhances diagnostic efficiency and reduces misdiagnosis rates (13), particularly for lung nodules and solid masses' diagnosis and prognosis. Machine learning, an advanced technique in computer science, uses algorithms to identify patterns within large datasets and make data-driven predictions or decisions (14). Although limited reports exist on the application of machine learning to differentiate between PSCs and PIPs (15-17), there is a clinical imperative to proactively distinguish between them through noninvasive CT scans, especially during the initial diagnosis phase.
2. Objectives
This study aimed to assess the feasibility of using radiomics-based machine learning methods to differentiate between PIPs and PSCs based on CT images. The reliability and generalizability of radiomics models rely on their accuracy, which necessitates comparing different machine learning approaches. This evaluation will support the effectiveness and timeliness of clinical treatment decisions in the next steps. By focusing on specific radiomics features within these lesions, we aimed to improve diagnostic accuracy compared to methods based solely on clinical and radiological features. Additionally, our study aimed to provide a preliminary reference for future research on this rare disease.
3. Patients and Methods
3.1. Patient Population
This retrospective, single-center study was conducted with institutional review board approval (2023HR23), and written consent was waived due to its retrospective nature. The study included 113 patients who were enrolled between March 2013 and August 2022 at our hospital. Among them, 21 patients had PSCs, and 92 patients had PIPs. We specifically recruited patients who had their first chest CT images taken at our hospital before treatment. Inclusion criteria were (1) non-contrast chest CT scans with thin-slice sections measuring 0.625 - 1.25 mm; (2) lesions with a maximum diameter equal to or greater than 1 cm; and (3) confirmed pathological diagnosis. Patients were excluded if they had received preoperative chemotherapy, radiotherapy, or chemoradiation treatment, had been diagnosed with chronic systemic diseases or other malignancies, or if the quality of their thoracic CT images was unsatisfactory. Ultimately, a total of 90 patients (27 males; median age, 58.1 years) were included in the study, comprising 14 patients with PSCs and 76 patients with PIPs. A flowchart illustrating the patient recruitment process is provided in Appendix 1 of the Supplementary File.
3.2. Computed Tomography Technique
Dual-source CT scanning (Somatom Definition, Siemens Medical Solutions, Germany) was performed on all subjects without the use of contrast. Thin-slice CT scans were acquired in a craniocaudal direction, covering the entire lung from the apex to the base. The following parameters were used for the chest CT examination: Detector collimation ranging from 1 - 5 mm, beam pitch ranging from 0.75 - 1.75 mm, tube voltage of 100 - 120 kV, automatic tube current modulation, detector collimation of 128 × 0.6 mm, and image matrix of 512 × 512. The reconstructed images had a slice thickness of 0.625 - 1.250 mm and were presented with window levels of 1600, 600, 350, and 35 HU for visualizing the lung and mediastinal anatomy.
3.3. Radiological and Clinical Data Acquisition
The CT images and relevant clinical data were obtained from picture archiving and communication systems, as well as the electronic medical records of the patients. The collected clinical parameters included age, sex, smoking status, prolonged fever, cough history, sputum, bloody sputum, hemoptysis, pleural pain, asymptomatic status, and white blood cell count. Two experienced radiologists, one with 15 years and the other with 20 years of experience in CT diagnosis, independently reviewed and evaluated the chest CT images of all subjects without access to their clinical data. The following radiological characteristics were recorded: Location, maximum diameter of the lesion, boundary of the lesion, shape of the lesion, lobulation sign, burr signs, vacuole sign, air bronchial sign, necrotic zone, calcifications, halo sign, satellite lesions, interlobular septal thickening, pleural indentation, pleural effusion, and mediastinal or hilar lymphadenopathy. To ensure the reproducibility of the results, a subset of 50 subjects was randomly selected and re-evaluated by the same observer after a 1-month interval.
3.4. Radiomics Feature Acquisition
The segmentation of the pulmonary lesions was performed by a radiologist specialized in chest CT diagnosis with a decade of experience. For this task, the radiologist used ITK-SNAP software version 3.8.0. The contouring process involved delineating the complete tumor margin along the lesion edge. Prior to the analysis, image stacks were manually masked to remove extraneous structures outside of the alveolar cavity, including blood vessels and large airways.
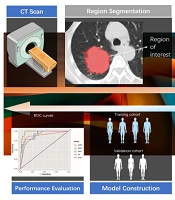
The radiomics features were extracted from the medical images using PyRadiomics version 3.0, an open-source Python package for radiomics feature extraction. A flowchart illustrating the process of building the radiomics model is shown in Figure 1.

The flowchart for building the radiomics model
A range of features was included for further analysis, including first-order statistics, intensity histogram statistics, shape descriptors (both 2-D and 3-D), and texture features such as gray level dependence matrix and gray level size zone matrix.
Initially, the radiomics features underwent standard score (z score) transformation to address dimensional heterogeneity caused by variations in value scales among features. Subsequently, correlation analysis and the least absolute shrinkage and selection operator (LASSO) method were used to reduce the dimensionality of the extracted features. Pearson correlation analysis was applied to normally distributed data, while Spearman correlation analysis was used for non-normally distributed data. Features with a correlation coefficient exceeding 0.9 were removed from further analyses. The study ultimately implemented a LASSO regression model with 5-fold cross-validation to select radiomics features with nonzero coefficients. A comprehensive diagram of the methodology is provided in Figure 1.
3.5. Development of Machine Learning Models
After successfully reducing the dimensionality of radiomics features using the LASSO method, our focus shifted to constructing robust radiomics models with the primary goal of identifying a classifier capable of exceptional recognition within the given database. The careful selection of these features is of immense significance, as they are believed to play a pivotal role in distinguishing and precisely classifying between PIPs and PSCs. To ensure the effectiveness and reliability of our approach, we incorporated a comprehensive array of machine learning algorithms renowned for their popularity and success in classification tasks (18, 19). Specifically, we used 5 well-established models: Logistic regression (LR), classification and regression trees (CART), support vector machine (SVM), k-nearest neighbors (KNN), and gradient boosting machine (GBM). By integrating multiple algorithms, our intention was to encompass diverse perspectives and exploit the strengths of each model in accurately discerning tumor patterns. Through meticulous comparison of the performance of these algorithmic approaches, we aimed to identify an optimal classifier model that demonstrates exceptional accuracy and predictive power in recognizing PIPs and PSCs. This rigorous evaluation process facilitated making informed decisions regarding the most suitable model for our study, ultimately enhancing the reliability and robustness of our findings. The “caret” R package was used to explain these 5 machine learning approaches. Thirdly, during the model training process, a control object was defined using 10-fold cross-validation, and the summary function was set to “twoClassSummary,” enabling the retrieval of predicted probabilities for different models. Subsequently, LR, SVM, CART, KNN, and GBM were trained using the corresponding functions “glm,” “svmLinear,” “rpart,” “knn,” and “gbm,” respectively. The diagnostic performance of each model was evaluated based on metrics such as area under the curve (AUC), accuracy (ACC), F1 score, and log loss using receiver operating characteristic curves (ROC) and confusion matrices. The optimal radiomics model was selected based on its superior performance.
3.6. Statistical Analysis
For the statistical analysis, we used R software version 3.6.3 and Python software version 3.5.6. To evaluate interobserver variability and reliability, we used the intragroup correlation coefficient (ICC). An ICC value greater than 0.8 indicated high repeatability (20). Student's t test was used for continuous variables, and the results were reported as mean ± SD. Categorical variables were analyzed using either the chi-square test or Fisher's exact test, and the results were presented as ratios. Subsequently, a multivariable LR analysis was performed on the selected statistically significant features to identify the ultimate predictor variables for model development. A 2-tailed P value less than 0.05 was considered statistically significant.
4. Results
4.1. Patients’ Population and Radiological Characteristics
In our study, a total of 90 patients were enrolled, including 14 with PSC and 76 with PIP. Detailed clinical and radiological features are presented in Tables 1 and 2.
| Variables | Total (n = 90) | PIP (n = 76) | PSC (n = 14) | P-Value |
|---|---|---|---|---|
| Age (y) | 58.1 ± 9.2 | 57.3 ± 9.3 | 62.4 ± 7.2 | 0.030 |
| Sex | 0.056 | |||
| Female | 63 (70) | 50 (65.8) | 13 (92.9) | |
| Male | 27 (30) | 26 (34.2) | 1 (7.1) | |
| Smoking status | 0.009 | |||
| Never | 38 (42.2) | 37 (48.7) | 1 (7.1) | |
| Smoker | 52 (57.8) | 39 (51.3) | 13 (92.9) | |
| Prolonged fever | 0.027 | |||
| No | 77 (85.6) | 68 (89.5) | 9 (64.3) | |
| Yes | 13 (14.4) | 8 (10.5) | 5 (35.7) | |
| Cough history | 1.000 | |||
| No | 21 (23.3) | 18 (23.7) | 3 (21.4) | |
| Yes | 69 (76.7) | 58 (76.3) | 11 (78.6) | |
| Sputum | 0.573 | |||
| No | 35 (38.9) | 31 (40.8) | 4 (28.6) | |
| Yes | 55 (61.1) | 45 (59.2) | 10 (71.4) | |
| Bloody sputum | 0.058 | |||
| No | 61 (67.8) | 55 (72.4) | 6 (42.9) | |
| Yes | 29 (32.2) | 21 (27.6) | 8 (57.1) | |
| Hemoptysis | 0.286 | |||
| No | 72 (80) | 59 (77.6) | 13 (92.9) | |
| Yes | 18 (20) | 17 (22.4) | 1 (7.1) | |
| Pleural pain | 1.000 | |||
| No | 70 (77.8) | 59 (77.6) | 11 (78.6) | |
| Yes | 20 (22.2) | 17 (22.4) | 3 (21.4) | |
| Asymptomatic | 0.651 | |||
| No | 10 (11.1) | 8 (10.5) | 2 (14.3) | |
| Yes | 80 (88.9) | 68 (89.5) | 12 (85.7) | |
| Total white blood cell count | 6.6 (5.2, 9.3) | 6.6 (5.3, 9.2) | 6.6 (5, 10) | 0.881 |
Comparison of Demographic and Clinical Data Between Pulmonary Sarcomatoid Carcinoma and Pulmonary Inflammatory Pseudotumor Patients a
| Variables | Total (n = 90) | PIP (n = 76) | PSC (n = 14) | P-Value |
|---|---|---|---|---|
| Location | 0.943 | |||
| Upper lobe | 49 (54.4) | 42 (55.3) | 7 (50) | |
| Middle lobe and lower lobe | 41 (45.6) | 34 (44.7) | 7 (50) | |
| Boundary of the lesion | 1.000 | |||
| Well-defined | 35 (38.9) | 30 (39.5) | 5 (35.7) | |
| Ill-defined | 55 (61.1) | 46 (60.5) | 9 (64.3) | |
| Lobulation sign | 0.084 | |||
| No | 48 (53.3) | 44 (57.9) | 4 (28.6) | |
| Yes | 42 (46.7) | 32 (42.1) | 10 (71.4) | |
| Burr signs | 1.000 | |||
| No | 64 (71.1) | 54 (71.1) | 10 (71.4) | |
| Yes | 26 (28.9) | 22 (28.9) | 4 (28.6) | |
| Vacuole sign | 0.841 | |||
| No | 44 (48.9) | 38 (50) | 6 (42.9) | |
| Yes | 46 (51.1) | 38 (50) | 8 (57.1) | |
| Air bronchial sign | 0.156 | |||
| No | 52 (57.8) | 41 (53.9) | 11 (78.6) | |
| Yes | 38 (42.2) | 35 (46.1) | 3 (21.4) | |
| Necrotic zone | 0.406 | |||
| No | 38 (42.2) | 34 (44.7) | 4 (28.6) | |
| Yes | 52 (57.8) | 42 (55.3) | 10 (71.4) | |
| Calcifications | 1.000 | |||
| No | 82 (91.1) | 69 (90.8) | 13 (92.9) | |
| Yes | 8 (8.9) | 7 (9.2) | 1 (7.1) | |
| Halo sign | 0.637 | |||
| No | 47 (52.2) | 41 (53.9) | 6 (42.9) | |
| Yes | 43 (47.8) | 35 (46.1) | 8 (57.1) | |
| Satellite lesions | 0.211 | |||
| No | 61 (67.8) | 49 (64.5) | 12 (85.7) | |
| Yes | 29 (32.2) | 27 (35.5) | 2 (14.3) | |
| Interlobular septal thickening | 0.133 | |||
| No | 61 (67.8) | 54 (71.1) | 7 (50) | |
| Yes | 29 (32.2) | 22 (28.9) | 7 (50) | |
| Pleural indentation | 0.005 | |||
| No | 68 (75.6) | 62 (81.6) | 6 (42.9) | |
| Yes | 22 (24.4) | 14 (18.4) | 8 (57.1) | |
| Pleural effusion | 0.483 | |||
| No | 71 (78.9) | 61 (80.3) | 10 (71.4) | |
| Yes | 19 (21.1) | 15 (19.7) | 4 (28.6) | |
| Mediastinal or hilar lymphadenopathy | < 0.001 | |||
| No | 63 (70) | 60 (78.9) | 3 (21.4) | |
| Yes | 27 (30) | 16 (21.1) | 11 (78.6) | |
| Maximum diameter of the lesion (mm) | 44.7 (38.2, 60.9) | 44.5 (38.2, 56.8) | 62 (40.2, 80.5) | 0.146 |
Comparison of Radiological Findings Between Pulmonary Sarcomatoid Carcinoma and Pulmonary Inflammatory Pseudotumor Patients
Our results showed significant differences between PSC and PIP patients in terms of pleural indentation, mediastinal or hilar lymphadenopathy, age, smoking status, and prolonged fever.
4.2. Machine Learning Models and Performances
In terms of image interpretation, the consistency among the observers was assessed using the ICC, which ranged from 0.977 to 1.000. These significant ICC values indicate a strong consensus among the observers in accurately interpreting the images. Initially, a total of 1186 radiomics features were extracted from plain CT scans. To prioritize the most informative and relevant features, some techniques for feature reduction and selection were employed. Through this process, 7 features with nonzero coefficients that demonstrated statistical significance were identified (Figure 2).

Radiomics features with nonzero coefficients remained via the least absolute shrinkage and selection operator.
These 7 features were selected based on their statistical significance. Subsequently, the performance of 5 different radiomics models (LR, SVM, GBM, KNN, and CART) was assessed. The diagnostic potential of each model and their ability to differentiate between PIP and PSC were evaluated using ROC curve analysis. Figure 3 displays the ROC curves of all 5 models, highlighting their respective performance.

The receiver operating characteristic curves of all machine models
To further evaluate the diagnostic efficacy of the models, multiple evaluation metrics (including AUC, F1 score, and log loss) were considered. Among the investigated models, GBM exhibited the highest level of diagnostic accuracy, with an AUC value of 0.980, F1 score of 0.967, and log loss of 0.161, as presented in Table 3 and Figure 4.
| Model | ACC | F1 Score | AUC | Log Loss |
|---|---|---|---|---|
| SVM | 0.878 | 0.938 | 0.914 | 0.273 |
| CART | 0.900 | 0.939 | 0.876 | 0.255 |
| GBM | 0.922 | 0.967 | 0.980 | 0.161 |
| KNN | 0.833 | 0.919 | 0.875 | 0.285 |
| LR | 0.878 | 0.942 | 0.915 | 0.242 |
Comparison of Diagnostic Performance Among Different Models

Diagnostic efficacy analysis of all machine models
4.3. Multivariable Logistic Regression Analysis for the Combined Model
Our study aimed to develop a combined model that integrates both the radiomics model and clinical-radiological features, including age, pleural indentation, mediastinal or hilar lymphadenopathy, smoking status, and prolonged fever. Logistic regression analysis demonstrated that only the GBM-based radiomics model served as a significant factor (odds ratio [OR] = 8.119; 95% CI, 3.761-9.079; P = 0.006; Table 4).
| Variables | B | Wald | OR (95% CI) | P-Value |
|---|---|---|---|---|
| Age | 0.12 | 0.184 | 1.127 (0.676 ~ 3.108) | 0.668 |
| Smoking status | -0.149 | 0.001 | 0.862 (0 ~ 131) | 0.981 |
| Fever | 2.225 | 0.001 | 9.252 (0.044 ~ 1588.911) | 0.979 |
| Mediastinal or hilar lymphadenopathy | 8.034 | 1.287 | 3084.472 (4.468 ~ 10807) | 0.257 |
| Pleural indentation | 7.048 | 1.077 | 1150.752 (0.915 ~ 1541) | 0.299 |
| GBM model | 34.33 | 3.388 | 8.119 (3.761 ~ 9.079) | 0.006 |
Multivariate Logistic Regression Analysis to Discriminate Between Pulmonary Inflammatory Pseudotumor and Pulmonary Sarcomatoid Carcinoma
5. Discussion
We conducted an investigation to assess the efficacy of CT-based radiomics models in differentiating between PSCs and PIPs. Our findings highlighted that the GBM-based radiomics model exhibited superior diagnostic accuracy compared to other machine learning approaches. Furthermore, we developed an integrated CT-based model that synergistically incorporated clinical predictors and GBM radiomics model to differentiate between PSCs and PIPs, leading to promising differentiated outcomes.
In our investigation, various clinical features were observed in the patients. Notably, patients with PSC exhibited pleural indentation, advanced age, mediastinal or hilar lymphadenopathy, and a history of smoking. Conversely, patients with PIP commonly presented with persistent fever. Accumulating evidence suggests an association between mediastinal lymphadenopathy and smoking history in the development of PSC. Recent studies have reported mediastinal lymph node involvement in nearly half of the patients at the time of diagnosis, indicating a high likelihood of lymphatic spread in this condition. Additionally, the presence of mediastinal lymph node metastasis has been correlated with an increased risk of distant metastasis and reduced overall survival. These findings underscore the importance of early detection and accurate staging of lymph node involvement in the management of PSC (21, 22). Zhao et al. (23) demonstrated a higher prevalence of smoking history in patients with PSC and its close association with poor prognosis. These findings emphasize the critical role of smoking cessation in reducing the incidence and mortality of PSC. On the other hand, a study by Kim et al. also showed that fever was a common symptom associated with PIP and can be a useful feature in guiding diagnosis (24). This finding is consistent with the results of our study.
Currently, there are relatively few studies on the imaging characteristics of pulmonary pleomorphic carcinoma. In contrast to PIPs, PSCs often exhibit radiological characteristics accompanied by pleural indentation, which is a common feature.
In this study, we conducted a radiomics-based analysis to differentiate between PSCs and PIPs. We used logistic multivariable analysis to integrate a GBM-based radiomics model with clinical predictors. This combination was based on the potential synergy between the quantitative information captured by radiomics and the valuable insights provided by clinically relevant predictors. By combining these factors, our model offers a more comprehensive understanding of the underlying mechanisms and characteristics associated with each tumor type, resulting in improved overall performance. However, the LR analysis revealed that only the GBM-based radiomics model served as an associate factor. Radiomics, as an intelligent calculation-based and non-invasive approach, uses original images to construct models, enabling the extraction of additional information that can reflect potentially relevant phenotypic features based on tumor heterogeneity. This approach provides valuable insights for both diagnosis and prognosis (15, 16).
In this study, the GBM-based radiomics model exhibited the highest diagnostic performance, as indicated by its exceptional values in terms of ACC, AUC, and F1 score, while achieving the lowest log loss value. Gradient boosting machine has established itself as a powerful machine learning algorithm, offering several advantages that make it well-suited for radiomics analysis. First, GBM operates as an ensemble model, iteratively combining multiple weak learners (decision trees). This iterative process allows GBM to learn from misclassified cases and focus on more intricate samples, thereby enhancing its overall performance. Moreover, GBM possesses a remarkable capacity to handle complex interactions between predictors through gradient optimization. Radiomics features often capture intricate patterns and textures within medical images, which can prove challenging to interpret using simple linear models like LR. Gradient boosting machine’s inherent ability to capture nonlinear relationships and interactions between features enables it to adapt to the complex and heterogeneous nature of radiomics data. Additionally, GBM incorporates regularization techniques such as shrinkage and feature subsampling, effectively mitigating overfitting and bolstering the model's generalizability. Regularization helps avert the risk of erroneously identifying spurious or irrelevant features, thereby yielding a more robust and accurate prediction model in radiomics analysis.
The findings of the present study are consistent with those of previous studies. For instance, a study reported that the GBM algorithm outperformed LR in predicting early gastric cancer (25). Another study demonstrated that GBM, when combined with dimensionality reduction techniques, achieved higher accuracy and AUC values compared to other machine learning models for predicting peritoneal metastasis of gastric cancer (26). Overall, GBM remains widely employed in the field of machine learning due to its prowess in handling complex data and generating precise predictions.
This study had several limitations that should be acknowledged. First, it was conducted retrospectively in a single center, which may have resulted in potential selection bias and limited the generalizability of the findings to other settings or populations. Second, the study was constrained by a small sample size due to the low incidence of PSC, making it challenging to collect an adequate number of medical images. To further validate the results, it is crucial to prospectively recruit a larger number of patients in future studies. It is worth noting that the differentiation between PSC and PIP has received limited attention in the existing literature, particularly regarding CT-based radiomics analysis, which could extract more image information for differentiation. Therefore, this preliminary study serves as a foundation for future research in this area. Third, the lack of directly related pathological tissue samples hindered the ability to verify the findings and limited the capacity to test hypotheses surrounding this matter, relying exclusively on prior reports instead.
In conclusion, our study suggests that the radiomics model based on GBM demonstrates exceptional diagnostic performance compared to conventional diagnostic methods. This highlights its potential utility as a differentiation approach for distinguishing between PSCs and PIPs. These findings have significant implications for informing future clinical and surgical strategies.
