

1. Background
Hepatic encephalopathy (HE) is a syndrome caused by severe hepatic dysfunction or an abnormal portal-systemic shunt, resulting in metabolic disorders. Its manifestations range from mild subclinical symptoms to deep coma. Minimal hepatic encephalopathy (MHE) is the latent stage of HE, also known as sub-clinical, early, or low-level HE. The incidence of asymptomatic MHE is grossly underestimated. Patients with MHE are at higher risk of hospitalization and motor vehicle accidents (1). Despite the lack of obvious clinical symptoms, patients with MHE have a significantly reduced health-related quality of life. Its occurrence increases the risk of overt HE, thereby worsening the prognosis (2). Thus, early detection of MHE is crucial.
Previous studies have focused on the effects of circulating intestinal toxins, especially ammonia, the progression of brain swelling, and central nervous system dysfunction caused by changes in the brain's neurotransmitter system. Tests can be neuropsychological or neurophysiological. Currently, there is no gold standard. Neuropsychological tests demonstrate better sensitivity and specificity in screening for MHE in patients with end-stage liver disease. However, the screening results might be affected by age and education level. Minimal hepatic encephalopathy is currently diagnosed by excluding other possible causes of brain dysfunction in patients when neuropsychological test results are unclear (3). Concordance between tests is low because they assess different pathways. No diagnostic protocols for MHE using neuroimaging methods have been developed so far. Neuroimaging technology provides a non-invasive method to evaluate changes in brain capacity and damage to brain function. MRI techniques can non-invasively quantify brain water content, such as diffusion-weighted imaging (DWI), diffusion tensor imaging (DTI), or diffusion kurtosis imaging (DKI) (4, 5). The correlation between DKI and neurocognitive abnormalities may provide early and more accurate localization of brain involvement and may help in predicting prognosis and neuropsychological sequelae (6).
Intravoxel incoherent motion (IVIM) has become an important method for cancer diagnosis, assessment of treatment response, and recurrence detection (7). Indeed, the cerebral microvasculature of MHE often exhibits multiple structural and functional abnormalities. Thus, perfusion imaging has become an important means for the management of MHE. Research on the IVIM imaging of HE in the brain (8, 9), wherein the apparent diffusion coefficient (ADC) is a reliable tool for the quantification of MHE, is limited (9). Intravoxel incoherent motion DWI can produce some objective biomarkers through different imaging sequences, allowing for the capture of more minor changes in the brain, thereby providing new means for early diagnosis and quantitative assessment of MHE. Herein, we aimed to analyze the diagnostic value of the parameters of mono-, bi-, and stretched exponential models of IVIM diffusion-weighted imaging (IVIM-DWI) in MHE.
2. Objectives
Considering probable changes in cerebral blood flow and brain function in MHE, this study aims to assess the diagnostic efficacy of DWI using mono-, bi-, and stretched exponential models for determining MHE.
3. Patients and Methods
3.1. Patient Selection Procedure and Clinical Data
Our hospital’s medical ethics committee approved this study, and the need for informed consent was waived due to its retrospective nature. Between October 2016 and October 2021, all patients with known MHE, based on the inclusion criteria, underwent conventional MR imaging techniques and diffusion-weighted MR imaging before treatment. Finally, 30 patients were included for further image analysis (Figure 1).

Flow diagram of patient selection
The inclusion criteria for the MHE group were as follows (1, 10): (1) Having underlying conditions causing HE, such as severe liver disease or extensive portosystemic collateral circulation shunt; (2) confirmed by psychometric hepatic encephalopathy score (PHES) (11); (3) not having received treatment for MHE before the MRI scan. The exclusion criteria for the MHE group were: (1) presence of an intracranial metal foreign body, denture, or other contraindications for MRI examination; (2) history of severe respiratory and circulatory diseases, kidney diseases, or cerebrovascular accidents; (3) presence of uncontrolled nervous system or mental diseases that interfere with cognitive function; (4) history of brain trauma; (5) current use of hypnotic and sedative drugs; (6) inability to complete the neuropsychological test due to eyesight, education level, or other reasons; (7) lack of DWI images or no MRI examination, or presence of severe artifacts on DWI images.
The control group comprised 30 individuals who had been concurrently examined at the physical examination center of our hospital. The control group was selected based on sex and age matching with the MHE group. We excluded examinees with insufficient information and data. A 1:1 pairing was carried out for age and gender matching, with 30 healthy examinees randomly selected as the control group. Controls with a history of nervous system, genetic metabolic, and chronic liver diseases were excluded based on history taking, physical examination, laboratory tests, and imaging data.
In total, 30 patients (21 males, 9 females) with MHE, aged between 30 and 80 years, with an average age of 50.83 years, were analyzed retrospectively. Among these patients, 16 had hepatitis B cirrhosis, 10 had schistosomiasis cirrhosis, 3 had drug-induced liver disease, and 1 had mixed cirrhosis (hepatitis B and schistosomiasis cirrhosis).
3.2. MR Examination and Post-Treatment
Currently, no scientifically proven imaging method unequivocally diagnoses MHE. Although the PHES tests are very useful for standardizing the assessment of MHE, early neurological alterations are not the same for all cirrhotic patients. Diffusion imaging could detect neurological deficits of MHE earlier than the PHES battery. The IVIM-DWI images were selected according to the flow diagram of selection. The radiologists performing the IVIM analysis were blinded to the group assignments and other relevant information.
3.2.1. MRI Examination
The participants in each group were scanned using a 3.0T superconductive MR machine (Discovery MR750, GE Medical Systems) and a special phased array target coil for the head. The scans included axial 3D T1BRAVO (3D inversion recovery–fast spoiled gradient recalled echo brain volume, BRAVO), T2-PROPELLER (periodically rotated overlapping parallel lines with enhanced reconstruction, PROPELLER), T1-weighted fluid-attenuated inversion recovery (FLAIR), and T2-FLAIR.
3.2.2. Intravoxel Incoherent Motion Scan
The IVIM scan adopts a single-shot echo-planar imaging sequence with axial imaging, following the same positioning as the 3D T1BRAVO. The parameters include: Repetition time (TR) = 4500 ms, echo time (TE) = 100 ms, number of excitations (NEX) = 2, field of view (FOV) = 240 × 240 mm², matrix = 128 × 128, slice thickness = 5 mm, slice spacing = 1.5 mm, and 13 b-values (0, 10, 20, 50, 100, 150, 200, 500, 800, 1000, 2000, 3000, 4000 s/mm²). The total scanning time was 6 minutes and 41 seconds.
3.2.3. Intravoxel Incoherent Motion Diffusion-Weighted Imaging Data Processing
All DWI images were transferred to AW 4.6 of the GE function workstation. Two radiologists (with 13 and 15 years of diagnostic experience) independently performed IVIM analysis. The original IVIM images were imported into the MADC software. The region of interest (ROI) was manually delineated on the pseudo-color perfusion map. The entire cerebral cortex, which may play important roles in mediating the development of MHE, was covered as much as possible (12, 13). Twenty-three ROIs were measured in the bilateral frontal lobe, temporal lobe, occipital lobe, parietal lobe, caudate nucleus head, globus pallidus, putamen, cingulate gyrus, thalamus, corpus callosum, midbrain, and pons. Additionally, connectivity impairment resulting from ganglia-thalamo-cortical circuits may play significant roles in facilitating the development of MHE; consequently, the bilateral thalamus was chosen as an area of interest (12). Each ROI consisted of at least 15 pixels.
Two observers recorded the standard ADC of the mono-exponential model, the true diffusion coefficient (D), the pseudo-diffusion coefficient (D*), and the perfusion fraction (f) of the double mono-exponential model, as well as the distributed diffusion coefficient (DDC) and Water Molecular Diffusion Heterogeneity Index (α) of the stretched exponential model. The two observers also recorded the mean value of each parameter. The same observer (with 15 years of diagnostic experience) repeated the measurements after one week to calculate the intraclass correlation coefficients.
3.3. Statistical Analysis
Data analysis was performed using SPSS 22.0 (IBM Corp. Released 2013. IBM SPSS Statistics for Windows, Version 22.0. Armonk, NY: IBM Corp.). The study sample consisted of 30 participants, and the measured variables, including ADC, D, D*, f, DDC, and α, are expressed as mean ± standard deviation (SD). We conducted data validation, including quality control checks and data validation procedures. A Shapiro-Wilk test was conducted, and results showed that skewness and kurtosis were close to 0, indicating a normal distribution for the quantitative parameters.
To compare the groups with normally distributed data, an independent sample t-test was used, as it is appropriate for continuous variables. Assumptions of normality and equal variances were assessed prior to conducting the t-test. Other tests, such as the rank sum test, were considered but not formally used due to the non-normal distribution of some measurement data. The diagnostic efficacy of significant parameters for MHE was analyzed using receiver operating characteristic (ROC) curves. Sensitivity, specificity, and the area under the curve (AUC) were calculated, along with corresponding 95% confidence intervals (CIs).
In this study, the intraclass and interclass correlation coefficients with a 95% confidence interval were used to define the interobserver and intraobserver consistency. Bland-Altman plots were used to analyze the interobserver agreement of the parameter measurements, with statistical significance set at P < 0.05.
4. Results
4.1. Study Characteristics
The age of the MHE group was 50.80 ± 8.17 years, while that of the control group was 50.73 ± 10.78 years. No significant differences were observed in the age and sex distribution between the MHE and control groups (P > 0.05).
The Bland-Altman plot was used to compare and analyze the parameter measurement results of the two observers to estimate the reproducibility of the measured parameters between different observers. The Bland-Altman plot showed that less than 5% of cases had measurements beyond the 95% CI band of the plot. The intra-class correlation coefficients suggested good interobserver and intraobserver reproducibility and agreement for the parameters (Appendix 1 in the Supplementary File). Additionally, the Bland-Altman analysis demonstrated higher reproducibility of parameter measurements (Figure 2), which is applicable in clinical practice.

A traditional Bland-Altman plot is depicted for comparison with the reproducibility of the measured parameters between different observers. Figures 2A–2F represent parameters ADC, D, D*, f, DDC, and α, respectively. The Y-axis represents the difference between the two measurement results of each sample point,whereas the X-axis represents the mean value of measurements. The solid horizontal line represents the mean difference between two measurements, and the dotted horizontal line represents the limit of parameter consistency. The parameter measurements from the two observers had good consistency.
4.2. Quantitative Analysis of Multi-Model Parameters of Cerebral Blood Flow in Each Region of Interest in Intravoxel Incoherent Motion Diffusion-Weighted Imaging Perfusion Imaging
Compared to those in the control group, significant differences (P < 0.05) were observed in several brain regions of the MHE group. Ten ROIs selected for analysis were from the bilateral frontal lobe, temporal lobe, occipital lobe, parietal lobe, and cingulate gyrus, each with at least five multimodal parameters that are statistically significant. The ADC values of the bilateral frontal lobe, temporal lobe, occipital lobe, parietal lobe, and cingulate gyrus were significantly different. The D values of the bilateral frontal lobe, parietal lobe, cingulate gyrus, and left temporal lobe were significantly different. The D* values of the bilateral temporal lobe, occipital lobe, parietal lobe, and cingulate gyrus were significantly different. The f values of the bilateral frontal lobe, temporal lobe, occipital lobe, parietal lobe, and left thalamus were significantly different. The DDC values of each ROI (bilateral frontal lobe, temporal lobe, occipital lobe, parietal lobe, cingulate gyrus, and thalamus) were significantly different. The α values of the bilateral frontal lobe, temporal lobe, occipital lobe, parietal lobe, and cingulate gyrus were significantly different.
Compared to the control group, the study parameters of the bilateral temporal lobe, occipital lobe, parietal lobe, and cingulate gyrus of the MHE group differed significantly in the mono-, bi-, and stretched exponential models (Appendix 2 in the Supplementary File, Figures 3 and 4).
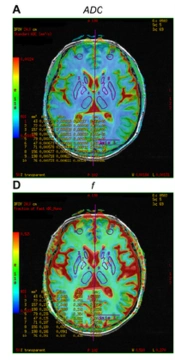
 group. Figures A–F are <i>ADC</i>, <i>D</i>, <i>D*</i>, <i>f</i>, <i>DDC</i>, and <i>α</i> pseudo-color maps, respectively. The region of interests are 1, right caudate nucleus head; 2, right globus pallidus; 3, right putamen; 4, right thalamus; 5, right frontal lobe; 6, left caudate nucleus head; 7, left globus pallidus; 8, left putamen; 9, left thalamus; and 10, left frontal lobe (note: Mirror symmetry).")
Pseudo-color map of intravoxel incoherent motion indexes in the region of interest of a 57-year-old female patient in the minimal hepatic encephalopathy (MHE) group. Figures A–F are ADC, D, D*, f, DDC, and α pseudo-color maps, respectively. The region of interests are 1, right caudate nucleus head; 2, right globus pallidus; 3, right putamen; 4, right thalamus; 5, right frontal lobe; 6, left caudate nucleus head; 7, left globus pallidus; 8, left putamen; 9, left thalamus; and 10, left frontal lobe (note: Mirror symmetry).
.")
Pseudo-color map of intravoxel incoherent motion indexes in the region of interest of a 45-year-old female patient in the control group. Figures A–F are ADC, D, D*, f, DDC, and α pseudo-color maps, respectively. The ROIs are 1, right caudate nucleus head; 2, right globus pallidus; 3, right putamen; 4, right thalamus; 5, right frontal lobe; 6, left caudate nucleus head; 7, left globus pallidus; 8, left putamen; 9, left thalamus; and 10, left frontal lobe (note: Mirror symmetry).
4.3. Diagnostic Efficacy Analysis of Intravoxel Incoherent Motion Parameters on Minimal Hepatic Encephalopathy Using the Receiver Operating Characteristic Curve
Finding the critical value based on the maximum Youden Index, ROC curve analysis results revealed that D* might be the most effective parameter for diagnosing MHE, with the highest AUC in the bilateral parietal lobe, bilateral cingulate gyrus, and left occipital lobe. Additionally, DDC might be the second most effective parameter for diagnosing MHE, with the highest AUC in the right occipital and bilateral temporal lobes. However, the α parameter had no diagnostic value for MHE (Appendix 3, 4 (in the Supplementay File), and Figure 5).
, <i>D</i> (green), <i>D*</i> (red), <i>f</i> (purple), <i>DDC</i> (yellow), and <i>α</i> (gray), respectively, for each region of interest of the right temporal lobe, left temporal lobe, right occipital lobe, left occipital lobe, right parietal lobe, left parietal lobe, right cingulate gyrus and left cingulate gyrus.")
Analyzing the diagnostic efficacy of intravoxel incoherent motion indexes on minimal hepatic encephalopathy through receiver operating characteristic curve analysis. Receiver operating characteristic curves 5A–5H represents the diagnostic efficacy of ADC (blue), D (green), D* (red), f (purple), DDC (yellow), and α (gray), respectively, for each region of interest of the right temporal lobe, left temporal lobe, right occipital lobe, left occipital lobe, right parietal lobe, left parietal lobe, right cingulate gyrus and left cingulate gyrus.
5. Discussion
MRI has unique advantages as a non-invasive method to detect MHE. Advanced MRI techniques have been intensively used to reveal aberrant features of cerebral structure, metabolism, and function, providing more objective and reliable information than neuropsychological testing in identifying MHE. However, there is no recognized diagnostic standard for MHE currently (2). Diffusion-weighted imaging is an MRI sequence that quantifies subtle changes in the Brownian motion of water molecules. Intravoxel incoherent motion is used to estimate the random flow perfusion of blood flow in capillaries and simulate diffusion. Furthermore, it can simultaneously measure tissue microstructure and microcirculation (13, 14). Improvements in the scan sequences of IVIM have met the signal-to-noise ratio requirement, allowing IVIM perfusion images to be obtained simultaneously with a DWI scan (15). Intravoxel incoherent motion DWI is widely used in the brain, mammary gland, abdomen, bone, and joints (16-19).
In this study, the parameters of the mono-, bi-, and stretched exponential models of the bilateral temporal lobe, occipital lobe, parietal lobe, and cingulate gyrus significantly differed between the MHE and control groups. The values of the multiple model parameters (ADC, D, D*, f, DDC, and α) in the 8 ROIs in the MHE group were higher than those in the control group, consistent with the results of Abdelhamid et al. (8). Matsusue et al. reported that the cingulate gyrus is symmetrically involved (20), and our study confirms this. The early appearance of mild cognitive dysfunction, sleep disorders, and personality changes in patients with MHE may be related to the high perfusion of blood flow in these brain regions. Moreover, this study revealed that DDC had the highest AUC in the bilateral temporal and right occipital lobes. These regions can be focused on when screening for MHE, as abnormalities in these areas can provide clues to the presence of MHE.
In this study, ROC curve analysis was used to evaluate the diagnostic efficacy of the parameters from the three models for MHE. Notably, D* and DDC might be effective parameters for diagnosing MHE. The double mono-exponential model is more accurate than the mono-exponential model, which is influenced by both diffusion and perfusion.
In this study, the MHE group had higher D* values in the bilateral frontal lobe, temporal lobe, occipital lobe, parietal lobe, and cingulate gyrus than the control group, except for the bilateral thalamus. The increased microcirculation blood perfusion in each ROI suggests widespread low-level cerebral edema in MHE (21). High ammonia levels can lead to mitochondrial edema. Extensive low-level edema may result in astrocyte dysfunction, inhibiting their energy metabolism and compromising the integrity of the brain microstructure, leading to brain function disorders in MHE. Local cortical atrophy, thinning, and edema in patients with cirrhosis and cognitive impairment may be associated with early manifestations of MHE, such as attention deficit (22). Among the eight ROIs with significant multi-model parameters, D* had the highest AUC in the bilateral parietal lobe, bilateral cingulate gyrus, and left occipital lobe, suggesting that D* may be a sensitive indicator for detecting MHE. Hyperammonia leads to vasodilation and hyperperfusion. Dysperfusion in the cerebral microcirculation—for example, due to shunting—might explain the increased D values (23). Some studies have reported that D* can evaluate the progression of cerebrovascular disease (24, 25) and possess diagnostic efficacy for nasopharyngeal carcinoma (26). However, other studies have found no significant difference in D* values between patients with lung cancer and lymph node metastasis and those with pleural invasion (27). Therefore, the reproducibility of D* in MHE diagnosis should be further studied due to differences in sample size, severity of liver disease, and degree of brain injury.
The DDC value of the stretched exponential model reflects the movement of water molecules in tissues and the complexity of lesions. DDC has been used for diagnosing and classifying prostate cancer, hepatocellular carcinoma, and endometrial cancer (28-30). The thalamic functional connection network (cortico-thalamic-cortical circuit) is crucial for information processing, integration, and transmission. Cognitive dysfunction in patients with MHE may be related to thalamic abnormalities (31). In this study, the DDC values of all ROIs (bilateral frontal lobe, temporal lobe, occipital lobe, parietal lobe, cingulate gyrus, and thalamus) in the MHE group were higher than those in the control group, and the difference was significant, which is consistent with the results of Pigoni et al. (32). The onset of MHE may be associated with diffuse gray matter degeneration and extensive cerebral edema of white matter (33, 34). Increased thalamic volume may be due to hypertrophy or hyperplasia of neurons or glial cells and be considered a compensatory effect of basal ganglia (BG) dysfunction (35). In this study, the increased DDC value may compensate for the osmotic imbalance caused by astrocyte accumulation. Fluid moves from the outside of astrocytes to the inside of the cells, impairing the movement of Brownian molecules in the extracellular space. Moreover, angiogenic and cytotoxic edema can occur in MHE. Hyperammonemia leads to mild oxidative stress and autophagic degradation of mitochondria. Ammonia induces the formation of reactive oxygen radicals in astrocytes, affecting protein homeostasis, such as proteasome degradation, and ultimately leading to autophagy of astrocytes (36). Astrocytes are the main cells responsible for clearing ammonia. Edema and autophagy of astrocytes hinder neurotransmitter production and ammonia clearance, potentially leading to cytotoxic edema, mild cognitive function or behavioral abnormalities, and personality changes in MHE (1).
In the early stage of MHE, the brain responds to pathophysiological changes through its own humoral neuromodulation. This response includes autophagy and mild oxidative stress in astrocytes, cytotoxic edema, increased neuronal blood flow, and a compensatory increase in gray matter perfusion. A low ADC value in the affected area reflects cytotoxic edema (37). The biexponential model D was significantly lower than the monoexponential model ADC, which may be associated with cerebral vasodilatation in HE patients. The biexponential model eliminates the influence of microcirculation perfusion on the true diffusion of water molecules. The F value represents the local volumetric ratio of microcirculatory perfusion effects to overall diffusion effects, including microcirculatory perfusion, fluid flow in the microstructure of glandular ducts, and glandular secretion. The f value itself cannot distinguish between these physiological activities. The α value was lower than in the control group and tended to be 0, which may be associated with the reduced differentiation of brain tissue and increased tissue heterogeneity in MHE patients.
In contrast to previous works, a quantitative assessment was made for the cerebral blood flow of MHE using 3D-ASL. While minimum CBF accurately reflected local minimum perfusion, the mean CBF tended to vary widely (38). Intravoxel incoherent motion DWI may be more effective for detecting underlying pathologic injury in early-stage patients (39).
This study had some limitations. First, the sample size was small. Future studies must increase the sample size and grade patients according to Child-Pugh to reduce possible result deviations caused by differences in liver decompensation. Second, the ROIs were placed manually; two observers recorded the mean values to reduce sampling error, and the delineated area was at least 15 mm². Computer automatic partitioning and measurement or whole-brain comparison and voxel-based false discovery rate (FDR) correction are required to further reduce errors (40).
In conclusion, MHE is a clinically significant problem that can impact the progression of cirrhosis and overall survival. No scientifically proven imaging method unequivocally diagnoses MHE. Intravoxel incoherent motion DWI is an imaging method that can detect MHE, and D* and DDC parameters might have higher diagnostic values. The bilateral temporal lobe, occipital lobe, parietal lobe, and cingulate gyrus regions should be focused on when evaluating MHE edema. This study found substantial heterogeneity and was conducted with a relatively small sample size. There is a lack of practical clinical application of IVIM-DWI in diagnosing and predicting MHE. Further research should focus on expanding the sample size, standardization, and validation of imaging biomarkers of IVIM-DWI to ultimately improve the management of MHE.
