


1. Background
Breast cancer ranks as the most prevalent form of cancer affecting women globally. According to the International Agency for Research on Cancer (IARC), breast cancer is the fifth leading cause of death among Iranian women. Timely detection of breast cancer plays a vital role in reducing complications and mortality rates (1). Various diagnostic methods are available for breast cancer, with mammography being the standard screening approach that effectively reduces breast cancer-related deaths. However, mammography-based diagnosis often leads to diagnostic errors due to its reliance on visual interpretation by radiologists with varying levels of experience (2, 3). To address this issue, computer-aided diagnosis (CAD) systems have been proposed, primarily focusing on mass detection and classification (4, 5). Feature extraction holds significant importance as it can enhance diagnostic accuracy (6).
In recent years, multi-resolution methods such as Wavelet and Curvelet transforms have garnered considerable attention from researchers in the field of image processing, offering potential improvements to CAD systems (7, 8). Previous studies have explored Wavelet-based fractal and multi-fractal features for breast cancer detection in various imaging scenarios (9, 10).
Karthiga et al. conducted a study on different machine learning techniques for classification, incorporating texture features derived from Curvelet coefficients of the gray level co-occurrence matrix (GLCM). Among these techniques, the cubic support vector machine (CSVM) achieved an impressive accuracy (Acc) of 93.3% when applied to 60 frontal images from the Visual Inspection Laboratory Database (11).
A comparative study by Ayatollahi et al. investigated the performance of Wavelet and Curvelet transforms. The study focused on analyzing 16 non-mass-enhancing lesions (NMELs) in breast dynamic contrast-enhanced magnetic resonance imaging (DCE-MRI). A 725-element feature vector was obtained using a support vector machine (SVM) classifier. The results showed an Acc of 75%, specificity (Sp) of 87.5%, and sensitivity (Se) of 62.5% (12).
Ancy and Nair investigated a novel CAD system utilizing an efficient GLCM-based SVM algorithm for tumor and non-tumor detection. The system was tested on a dataset consisting of 100 pairs of images from the Mammographic Image Analysis Society (MIAS) and United States Digital Mammography (USFDM) databases. The combination of GLCM feature extraction and SVM classification yielded promising results, with an Acc of 81%, Sp of 99%, and Se of 73% (13).
Saraswathi et al. introduced a novel feature extraction method that combined Curvelet transform with particle swarm optimization (PSO). The method was tested on a dataset of 182 images from the MIAS database. The extracted features were fed into an SVM algorithm for classification, resulting in an Acc of 96%, Sp of 91.7%, and Se of 92.1% (14).
Dheeba et al. proposed a novel texture-based classification approach for breast abnormalities using a particle swarm optimized wavelet neural network (PSOWNN). The study utilized 261 images from a clinical mammographic database. The Acc, Sp, and Se achieved were 93.671%, 92.105%, and 94.167%, respectively (15).
2. Objectives
The objectives of this study include detecting and distinguishing tumors from healthy tissue, as well as extracting optimal features to assist radiologists in diagnosing breast cancer image abnormalities. The study proposed a classification method based on texture extraction using Curvelet transform and fractal features, employing a genetic algorithm-multi-objective optimization-artificial neural network (GA-MOO-ANN) approach. This novel method, which has not been explored in previous studies, aims to achieve two important objectives: The simultaneous search for significant subsets of features and the optimization of the network structure. Through this algorithm, it is possible to select the most appropriate subset of features and the best state of network optimization, focusing solely on the effective features.
The experimental results demonstrated an accuracy (Acc) of 98.2%, specificity (Sp) of 100%, sensitivity (Se) of 96.8%, positive predictive value (PPV) of 100%, negative predictive value (NPV) of 96.2%, and an impressive area under the curve (AUC) of 0.98, which are comparable to results achieved by other recent methods in the field.
3. Patients and Methods
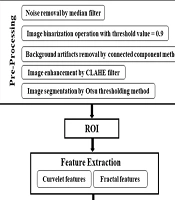
This section provides a detailed description of the various components of the proposed CAD system, with an overview of the overall block diagram illustrated in Figure 1.

Block diagram of proposed method
3.1. Mammographic Image Analysis Society Database
The MIAS database, established in 1994 by J. Suckling et al., was developed by British research groups and provides a comprehensive digital mammography resource. The collection contains a total of 322 images, all in portable gray map (PGM) format with a grayscale resolution of 50 microns and a size of 1024 × 1024 pixels (10). For this research, regions of interest (ROIs) were extracted from 113 mammography images sourced from the MIAS database. The background tissues of the images are categorized into three types: Fatty, Fatty-glandular, and Dense-glandular. Additionally, the abnormalities present in the images include Calcifications, Well-defined/circumscribed masses, Spiculated masses, other ill-defined masses, Architectural distortion, and Asymmetry, which are the focus of this study. Images of normal, healthy tissue were not considered.
3.2. Preprocessing
The preprocessing steps for mammograms are as follows:
(1) Original image: The initial mammogram image is shown in Figure 2A.
 filter; G, image segmentation result by Otsu threshold method.")
Preprocessing results of proposed method: A, original image; B, result of median filter; C, binary image with threshold value 0.9; D, background artifacts removal image using connected component method; E, the pectoral muscle extracted image using modified local seed region growing method; F, result of contrast limited adaptive histogram equalization (CLAHE) filter; G, image segmentation result by Otsu threshold method.
(2) Noise removal: A median filter is applied to remove noise. The median filter is effective in eliminating salt and pepper noise, as well as Gaussian noise, while preserving image sharpness. For optimal results in mammography, a 3 × 3 window size is used for the filter (Figure 2B).
(3) Artifact Removal: To remove background artifacts, threshold values ranging from 0.1 to 0.9 are tested. A threshold value of 0.9 is found to entirely eliminate background artifacts (Figure 2C). The connected component method is then used to extract the breast region from the binary image without the background (Figure 2D).
(4) Pectoral muscle removal: The pectoral muscle region, typically located in the corner of mammograms, does not affect the detection of abnormalities. It is necessary to separate the pectoral muscle from the breast region. A modified Local Seed Region Growing method, based on the position of the mammogram, is employed to extract the pectoral muscle. Since the MIAS database includes both left and right mammograms, the seed point for the extraction process is automatically determined by counting the number of non-zero pixels in each half of the image. This method identifies the breast's position in the mammogram based on the distribution of non-zero pixels on each side of the image (Figure 2E).
(5) Image Enhancement: The contrast-limited adaptive histogram equalization (CLAHE) algorithm, a widely used image enhancement technique, is applied to enhance the contrast and improve the quality of the mammograms (Figure 2F).
(6) Segmentation: Thresholding is employed to eliminate the background by assigning intensity values to pixels and classifying them as either object or background. Otsu's method, a commonly used global thresholding technique, is applied for image segmentation, which separates high-intensity regions from the original image and successfully segments the pectoral muscle (Figure 2G).
3.3. Feature Extraction Using Curvelet Transform
In the field of image processing, the presence of curved edges, as opposed to straight lines, presents challenges for certain transforms, such as the Ridgelet transform, in accurately detecting the structure of curved tissue textures (13, 16). The Curvelet transform, however, is a novel multi-resolution analysis tool that excels at representing edges and providing geometric information related to scale, location, and direction. It follows a scaling law where the width is approximately equal to the square of the length. The discrete Curvelet transform, proposed by Candes and Donoho, offers an optimal representation of objects with edges and is particularly suitable for image reconstruction. Unlike the 2D Wavelet transform, the Curvelet transform effectively represents 2D objects with a "dotted curved surface," overcoming the limitations of the Wavelet transform. Additionally, the Curvelet transform covers the entire frequency range, unlike other transforms, such as the Gabor Transform, which may lead to information loss (13, 14, 16).
In the proposed CAD system, the discrete Curvelet transform and fractal dimension parameters are utilized to extract features from mammograms. Additionally, seven statistical features (energy, entropy, mean, standard deviation, maximum probability, inverse difference moment, and uniformity) are computed for each sub-band. The Curvelet coefficients, as shown in Table 1, are directly calculated for each region of interest (ROI). Ultimately, a feature vector is constructed to classify abnormalities.
| Variables | Formula |
|---|---|
| Energy | |
| Entropy | |
| Mean | |
| Max probability | |
| Inverse difference moment | |
| Homogeneity | |
Abbreviations: STD, standard deviation; Max, maximum.
a STD:
3.4. Feature Selection and Classification
Following the image decomposition, a total of 575 features were extracted from 512 × 512 regions of interest (ROIs). This large number of extracted features poses challenges, as some may be ineffective, and there may be internal correlations within the feature set. Utilizing all features would result in a complex and time-consuming computational process. To address this, the algorithm generates a Pareto front, representing a set of solutions that simultaneously minimize two competing objectives: The number of effective features and the prediction error. Consequently, two fitness functions are considered. Fitness function 1 is associated with the number of effective features selected from the pool of 575 extracted features. Fitness function 2 is calculated based on formula:
The Pareto front obtained in this study is shown in Figure 3. The information derived from its analysis, including the number of optimal points, the number of selected features, and the prediction error, is presented in Table 2.
 for feature selection")
The Pareto front obtained using genetic algorithm-multi-objective optimization (GA-MOO) for feature selection
| Point Number | Number of Selected Features | Error of Prediction |
|---|---|---|
| 1 | 42 | 0.01743 |
| 2 | 28 | 0.01755 |
| 3 | 17 | 0.0177 |
| 4 | 12 | 0.06195 |
| 5 | 11 | 0.1416 |
| 6 | 7 | 0.177 |
| 7 | 6 | 0.2743 |
| 8 | 4 | 0.3097 |
| 9 | 3 | 0.4336 |
3.5. Statistical Analysis
To calculate the probability of abnormalities in each image, a three-layer feed-forward artificial neural network (ANN) was utilized. The hidden layer consisted of 6 neurons, while the output layer had one neuron. The number of neurons in the input layer was automatically determined by the GA-MOO-ANN method.
The ANN was evaluated using the 6-fold cross-validation method. The dataset was randomly divided into 6 subgroups, each containing 16 samples. Training and testing were repeated 6 times, with one subgroup reserved for testing and the remaining subgroups used for training in each iteration. Additionally, a subgroup of 17 samples was held for the final testing. This process was repeated 6 times to ensure that each subgroup was used exactly once for model testing. The results from these 6 repetitions were averaged to obtain the accuracy (Acc) of the ANN classifier.
The performance evaluation indicators of the ANN classifier included sensitivity (Se), specificity (Sp), accuracy (Acc), positive predictive value (PPV), and negative predictive value (NPV). These metrics were derived from the concepts of true positive (TP), true negative (TN), false positive (FP), and false negative (FN). The relationships between these performance indicators are presented in Table 3, and they were calculated based on the values obtained from the confusion matrix shown in Figure 4.
| Indices | Formula | Concept |
|---|---|---|
| Se | Give true positive rate | |
| Sp | Give true negative rate | |
| Acc | Closeness to the true value | |
| PPV | Give positive prediction rate | |
| NPV | Give negative prediction rate |
Abbreviations: Se, sensitivity; TP, true positive; FN, false negative; Sp, specificity; TN, true negative; FP, false positive; Acc, accuracy; PPV, positive predictive value; NPV, negative predictive value.

The confusion matrix of proposed method
4. Results
In this study, 113 images were selected from the MIAS database, comprising 62 benign and 51 malignant images. The preprocessing steps involved noise removal from mammograms and the application of masks to eliminate unnecessary parts of the images. ROI extraction was performed to remove unwanted regions such as image labels, pectoral muscles, and background using the connected component technique and a modified region growing method with automatic seed point selection. Subsequently, the CLAHE filter was applied for image enhancement, and the Otsu thresholding method was used for image segmentation to obtain accurate ROIs. Feature extraction from the ROIs involved applying the discrete Curvelet transform and fractal dimension parameters. Additionally, the seven statistical criteria listed in Table 1 were computed for each feature vector. As a result, 575 statistical parameters were extracted using the discrete Curvelet transform and fractal dimension parameters.
Tumor shape plays a crucial role in breast cancer diagnosis, and it has been medically established that malignant tumors tend to have sharp edges, indicating high-frequency content. The Curvelet transform, which has been used in recent studies, offers better definition of frequency content. By capturing texture information, the Curvelet transform is particularly effective in detecting the sharp edges or margins of tumors. Additionally, the fractal parameter is a highly accurate indicator of the level of disorder in the tumor region. To focus on the most significant set of features, the GA-MOO-ANN was employed, and its Pareto front is displayed in Figure 3, with the selected optimal point being point 3. From the results obtained from the Pareto front in Figure 3 and the information in Table 2 regarding the number of selected features, the percentage of prediction error at point 3 is 0.0177, with 17 features being chosen. According to Equation 1, this indicates that GA-MOO-ANN selected 17 features as the best among the 575 features, achieving an Acc of 98.23%.
Subsequently, performance indicators such as Se, Sp, Acc, PPV, and NPV of the ANN classifier were determined based on the values presented in the confusion matrix shown in Figure 4. Additionally, the receiver operating characteristic (ROC) curve was plotted in Figure 5. As most studies commonly evaluate the area under the curve (AUC), this criterion was employed for comparison. In the present study, the AUC is calculated to be 0.9814. Table 4 compares the performance indicators of the proposed method with those of recent published studies.
 curve of the proposed work")
Receiver operating characteristic (ROC) curve of the proposed work
Abbreviations: Acc, accuracy; Sp, specificity; Se, sensitivity; AUC, area under the curve; CSVM, cubic support vector machine; SVM, support vector machine; PSOWNN, particle swarm optimized wavelet neural network; GA-MOO-ANN, genetic algorithm based multi-objective optimization of an artificial neural network.
5. Discussion
The accurate detection and classification of breast cancer abnormalities remain a critical challenge in medical imaging. This study presents a novel approach that leverages the strengths of both the Curvelet transform and fractal analysis to enhance the analysis of breast cancer images. The Curvelet transform excels at representing edges and capturing geometric information related to scale, location, and direction, making it particularly suitable for analyzing complex medical images. By integrating this with fractal analysis, which provides insights into spatial heterogeneity and complexity, we aim to address some of the limitations of traditional transformation methods. This combined approach promises improved detection of abnormalities, potentially leading to more accurate diagnosis and treatment.
Our proposed method utilizes the GA-MOO-ANN algorithm to optimize feature selection while minimizing prediction error. By focusing on two key objectives—the selection of an effective feature set and the reduction of prediction error—we derived a Pareto front that balances these goals. The performance metrics obtained through 6-fold cross-validation were impressive, achieving an accuracy of 98.2%, specificity of 100%, sensitivity of 96.8%, positive predictive value (PPV) of 100%, negative predictive value of 96.2%, and an area under the curve of 0.98. These results are notably superior when compared to recent literature, as shown in Table 4, reinforcing the efficacy of our approach in accurately identifying abnormalities.
Despite the promising results, there are several limitations to consider. First, while the GA-MOO-ANN algorithm effectively selects features, it may still lead to redundancy or overlook critical features that could enhance the model's performance. Secondly, the study's evaluation was based on a 6-fold cross-validation method, which, while robust, may not fully represent all potential variations in the dataset. Future studies should incorporate larger and more diverse datasets to ensure the generalizability of the proposed model. Lastly, the complexity of implementing the Curvelet transform and fractal analysis may pose challenges in clinical settings, underscoring the need for user-friendly software solutions.
In conclusion, the combination of the Curvelet transform with fractal analysis represents a significant advancement in the classification of breast cancer abnormalities. The integration of these techniques with the GA-MOO-ANN algorithm not only enhances feature selection but also minimizes prediction errors, leading to high accuracy rates. Given the high AUC and other performance metrics, our proposed model demonstrates considerable promise as a reliable tool for aiding medical professionals in breast cancer detection. Further research is warranted to explore its application in clinical settings and assess its performance across varied datasets.
