1. Background
Breast cancer is the second most common cancer diagnosis globally, especially in women. It is estimated that more than 1.7 million new cases of breast cancer occurred among women worldwide in 2012 (1). X-ray mammography is commonly used in screening programs and reduces the mortality associated with breast cancer, but for younger women, sensitivity to ionizing radiation and its associated effects is a considerable risk (2, 3).
Unlike X-ray mammography, optical mammography is a non-invasive, non-ionizing and low-cost technique that requires little or no breast compression. This technique uses near-infrared (NIR) light in the wavelength range extended from 600 - 1000 nm to assess the optical contrast and related biological features of normal and cancerous breast tissue (4-9). The blood’s hemoglobin (Hb) concentration test is one of the most commonly performed tests; the normal Hb level in the human body ranges from 12 - 16 g/dL (10). Increasing Hb concentrations in younger pre-menopausal women are a good indicator of the involution of glandular tissue and also of its replacement by adipose in peri-menopausal and post-menopausal women (11).
The optical properties of a tissue affect both diagnostic and therapeutic applications of light. The ability of light to penetrate a tissue, interrogate its components, and then escape the tissue for detection is the key to its diagnostic applications. The amount of light that is absorbed depends on many physical properties of the studied material, such as its concentration and also the length of the light path in substance. Functional information on tissue components of water, milk, lipids, and oxy- and deoxy-Hb showed different optical characteristics, which provide optical breast imaging without the need for a contrast agent (4, 12).
In human blood, oxy or deoxy-Hb concentrations have different effects on the absorbance of red and infrared light; this is considered to be a function of oxygen saturation. In malignant tumors, the Hb concentration is directly related to angiogenesis, a factor that is required for tumor growth and metastases (13). In addition, changes in the proportions of oxy- and deoxy-Hb in such abnormal conditions and tumors are caused by alterations in metabolism (14). By measuring the concentrations of the breast components, diffuse optical imagine may allow discrimination between benign and malignant tumors.
The absorption contrast provided by differing concentrations of oxy- and deoxy-Hb in the blood of an abnormal breast is at shorter wavelengths (600 - 850 nm) of the diagnostic spectral window than that in normal breast tissue. Thus, a reduction of the illumination wavelength leads to an increase in both the absorption and scattering properties, which could provide better contrast and spatial resolution for optical imaging (15).
NIR optical spectroscopy is intrinsically sensitive to the principal components of the breast, including fat, blood, and water, as well as epithelial and connective tissues. In addition, NIR optical spectroscopy can reveal physiologic information that has been obtained noninvasively (16). The light-emitting diodes (LED) that produce NIR wavelengths are ordinarily used as a light source for optical mammography.
It is possible to determine the structure and function of the breast by utilizing information of the wavelength-dependent absorption and scattering behavior of breast components via analysis of diffusely transmitted light. Specifically, this process is accomplished by measuring two optical parameters that contain a scattering coefficient (μs), which expresses the magnitude and power of scattering, and the absorption coefficient (μa), which is a function of the absorber concentration in the breast. Researchers have used these optical parameters to determine differences between normal and abnormal tissue (17-20).
2. Objectives
In recent articles, normal breasts have been studied, but investigations that have considered normal and abnormal breast hemoglobin together in two types of vessels with different detectors via NIR transmission are rare.
In this study, optimum NIR wavelength for discrimination between breast components and blood concentrations, including normal or abnormal, was determined using spectrophotometry. Next, their absorption coefficients in major and minor vessels and their availability for presenting optical differentiation in different concentrations of breast blood were measured with a spectrometer (SM) and a powermeter (PM) for early detection of an abnormal breast.
3. Materials and Methods
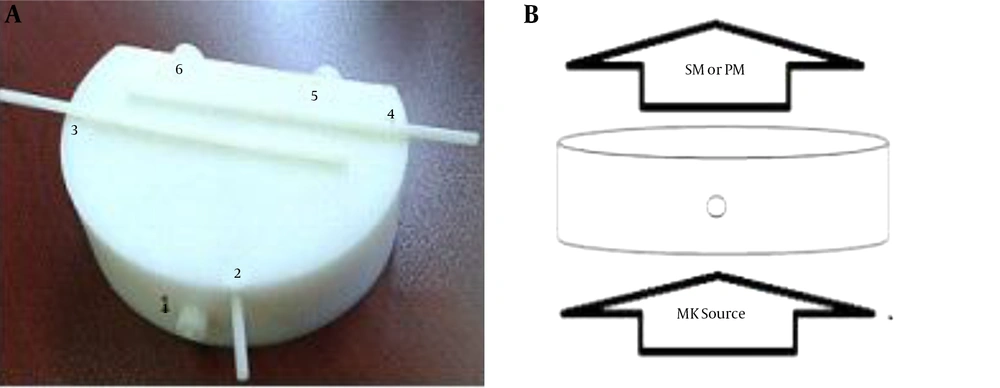
Three main references were studied, and a new breast phantom was designed and constructed at the department of medical physics at Tabriz University of Medical Sciences (21-23). The breast phantom is 18.5 × 12.5 cm2 with a thickness of 5 cm, which in phantom studies represents the dimensions of a normal breast size. The breast phantom is contrived within two major and minor vessels with diameters of 5 and 10 mm, respectively, as shown in Figure 1. The phantom was used as a valid simulator of normal breast tissue. The phantom was made of polyethylene. Polyethylene is a polymer that consists of long hydrocarbon chains, which showed approximate properties to breast tissue. During the initiation of the experiment, white and black cylinders were fit to major and minor vessels and used for calibration and also to test the phantom’s availability for NIR source by SM and PM recording data for determining the absorption coefficient. One-, two-, and four-fold concentrations of hemoglobin were obtained by centrifuging and diluting the blood with phosphate-buffered saline (PBS), which was obtained from the East Azerbaijan province blood transfusion headquarters. About 6 mL of each material were injected into major vessels, and 3.5 cc were placed in minor vessels of the breast phantom. The main materials included in breast components were water, milk, lipids, and 2× or 4× concentrations of hemoglobin, which were used for various values of absorption; oxygenated Hb was used as a contrast agent. An LED light source with a wavelength of 637 nm and 16 mW of power was used as a NIR-emitting source. The distance between the spectrometry recorder (fiber optic) and the PM to the infrared source was 11.8 cm, while the distance from the source to the phantom was 6.5 cm. The intensity of the light source for skin-safe purposes was 11 microwatts on the phantom.
The breast phantom from anterio-upper views. A, The breast phantom is made of polyethylene, which is contrived within major and minor vessels (numbers 2 to 6). Number 1 is the nipple. Numbers 2, 3, and 4 are minor vessels, with a 5-mm diameter and 1.5 and 4.5 cm deep from the surface of the phantom. Numbers 5 and 6 are major vessels with a 10-mm diameter that are 3.5-cm deep from the surface of the phantom. They are removable to allow for the insertion of exam materials. B, The presented position of the source to the phantom and detector. The field of infrared source (LED) exposure was limited to the phantom’s bottom surface by collimator, and spectrometry was used to record the output of the infrared source from the superior surface (opposite) of the phantom. All measurements were performed in a dark room to avoid the interference of external rays (SM, spectrometer; PM, powermeter).
The NIR output was recorded by a SM (USB4000 Fiber Optic Spectrometer, USA) and a PM (model PM100D, Manufacture THORLABS, GmbH, Dachau, Germany). Different concentrations of Hb and other breast components included water and lipids selected for recording the transmission values of NIR from breast phantom vessels and were performed in a dark room. The absorption coefficient was obtained using the following Formula 1:

T1, input power; T2, output power of NIR source; d, distance from NIR source to phantom.
For the first experiment, which was to determine the optimum wavelength for NIR by spectrophotometry, we had to dilute the material to 0.1 concentrations because the cell counter was calibrated to this value. A spectrophotometer (shimadzu, model UV-1800) was used for recording the absorbance value of materials without the breast phantom.
The data were analyzed using the statistical package for the social sciences (SPSS), ver. 16 (SPSS Inc., Chicago, Il, USA), and t-test was used for statistical comparison between groups. Significance level was considered at the level of 0.05. In minor vessels, white and black cylinders were used for the calibration of the light response when exposed to different contrast materials.
4. Results
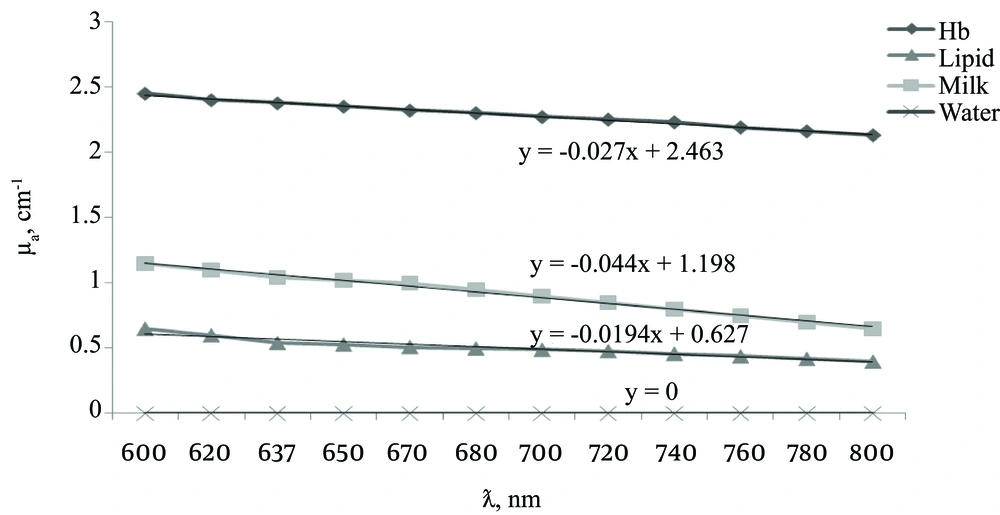
The linear relation between the absorption coefficient and the wavelength observed for water and concentrations of 0.1 of milk, lipids, and Hb using a spectrophotometer. Figure 2 shows good separation at a wavelength range of 600 - 800 nm for absorption characteristics of different materials without a phantom. The wavelength of 637 nm showed the best separation curves based on the relation between absorptions and wavelength. Therefore, 637 nm wavelengths can present smaller differences, such as Hb variations in abnormal or tumor breasts, by distinguishing between their absorption coefficients. The absorption coefficient values were in the range of zero to 0.5 (0.01 concentrations). All materials of the experiment showed correlation coefficients ranging from 0.934 - 0.994 (0.1 concentration), although water was μ = 0.
The ability to record the absorption coefficient for diagnosing normal and abnormal breast tissue was evaluated by carrying out a receiver operating characteristic (ROC) analysis. Sensitivity-specificity computations and ROC curve analyses were performed to quantify the overall performance of the diagnosis. The sensitivity-specificity values and the area under the curves (AUC) of the ROC were used to assess the accuracy of the diagnostic algorithms.
Sensitivity and specificity of SM in the diagnosis of normal and abnormal Hb in breast vessels was 89.4% and 100%, respectively, and the sensitivity and specificity of PM was 100% and 100%, respectively. Therefore, both devices’ measurements were reliable for the experiment.
The quality control procedures for the NIR source SM and PM were performed using a phantom with white and black cylinders. A significant difference between their contrast was also observed (P < 0.001).
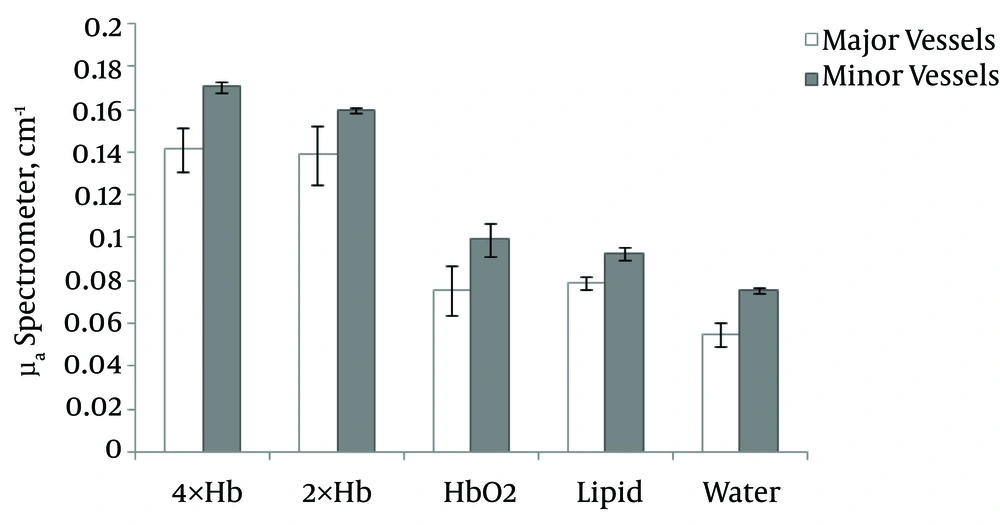
The collected results of absorption coefficients in the major and minor vessels of 2× and 4× concentrations of Hb were compared using spectrometry (Figure 3). At different concentrations of Hb, a high μa was observed for 4× Hb in minor (0.17 cm-1) and major (0.14 cm-1) vessels, while a lower μa belonged to Hbo2 in both minor (0.099 cm-1) and major (0.075 cm-1) vessels.
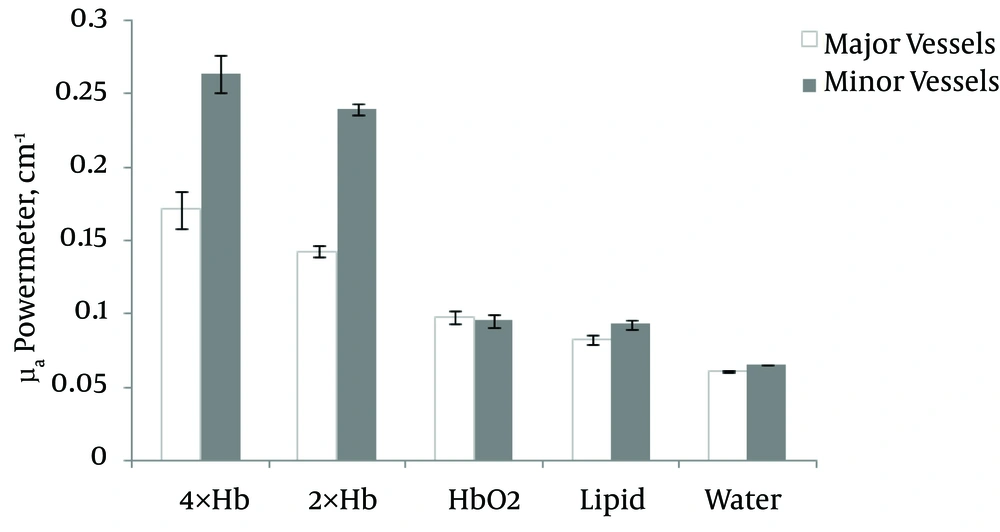
Also, a comparison of the absorption coefficient of NIR from 2× and 4× and oxy-hemoglobin by PM in major and minor vessels of a breast phantom are shown in Figure 4. At different concentrations of Hb, a high μa was found for 4× Hb in minor (0.26 cm-1) and major (0.17 cm-1) vessels, while a lower μa belonged to Hbo2 in minor (0.097 cm-1) and major (0.096 cm-1) vessels.
4.1. Comparison of Absorption Coefficient of Collected Data
Oxy-hemoglobin (Hbo2) had a normal breast Hb value, and the 2× or 4× Hb concentrations were abnormal breast Hb values. In the major vessels that were studied by spectrometry, the results of a comparison of the absorption coefficients of 4× Hb and Hbo2 were significant (P < 0.001) and were significantly different (P < 0.05) for water and lipids.
The comparisons between 2× Hb and 4× Hb in minor vessels with P = 0.05 showed a significant diversity, which indicates a better response in vascular differentiation. Also, for 2× Hb and oxy-hemoglobin, a significant difference was observed between water and lipids (P < 0.001). As a result, the major vessels in the powermeter differentiation were more pronounced.
In minor vessels, the distinction between Hb with 4× Hb and 2× Hb, (P < 0.05), oxy-hemoglobin, water, and lipids was significant (P < 0.001). The data showed that minor vessels had a higher accuracy than the major vessels. The differences between 2× Hb, water, and lipids were significant (P < 0.001). According to a statistical analysis of the results and using ROC curves, the study of the 2×, 4×, and oxy-hemoglobin with the NIR source may allow a more careful distinction to be made between normal and abnormal breast tissue.
A comparison of the data from the SM and the PM was not statistically significant. According to the present data, the differences between major and minor vessels showed that minor vessels were better differentiated; indicating that early detection of abnormal breast tissue may be possible in minor rather than major vessels.
| Materials | Spectrometer, Count | Powermeter, μw |
|---|---|---|
| White cylinder | 26,523.24 | 88 |
| Black cylinder | 8,720.42 | 55 |
| Major | ||
| Water | 22,412.97 | 81.5 |
| Lipids | 17,061.63 | 102 |
| HbO2 | 17,712.61 | 54 |
| 2× Hb | 8,560.51 | 32 |
| 4× Hb | 8,333.18 | 23 |
| Minor | ||
| Water | 17,778.42 | 81 |
| Lipids | 13,228.6 | 53 |
| HbO2 | 13,512.5 | 55 |
| 2× Hb | 6,713.24 | 10.5 |
| 4× Hb | 5,939.11 | 8 |
The Mean Raw Counted data Obtained by Spectrometer and Powermeter for White and Black Cylinders, Water, Lipids, 2×, 4× and Oxy-Hemoglobin Inside Major and Minor Vessels of the Breast Phantom
| Materials | μa (Spectrometer, cm-1) | μa (Powermeter, cm-1) |
|---|---|---|
| White cylinder | 0.040 ± 0.005 | 0.055 ± 0.003 |
| Black cylinder | 0.132 ± 0.017 | 0.096 ± 0.013 |
| Major | ||
| Water | 0.055 ± 0.013 | 0.060 ± 0.000 |
| Lipids | 0.079 ± 0.007 | 0.083 ± 0.003 |
| HbO2 | 0.075 ± 0.026 | 0.097 ± 0.004 |
| 2× Hb | 0.139 ± 0.030 | 0.143 ± 0.003 |
| 4× Hb | 0.141 ± 0.023 | 0.171 ± 0.013 |
| Minor | ||
| Water | 0.075 ± 0.003 | 0.065 ± 0.001 |
| Lipids | 0.093 ± 0.007 | 0.092 ± 0.003 |
| HbO2 | 0.099 ± 0.017 | 0.096 ± 0.005 |
| 2× Hb | 0.160 ± 0.003 | 0.239 ± 0.011 |
| 4× Hb | 0.171 ± 0.005 | 0.263 ± 0.015 |
The Absorption Coefficients Calculated for the Spectrometer and Powermeter Results Shown in Table 1 for White and Black Cylinders, Water, Lipids, 2×, 4× and Oxy-Hemoglobin Means ± standard deviation in the Major and Minor Vessels of the Breast Phantom
5. Discussion
Most studies have investigated normal breast Hb absorption coefficients, but some data indicated abnormal breast hemoglobin spectroscopy in two types of vessels via NIR light and its comparison with a normal breast. The present study suggests that assessing the absorption coefficient of Hb in major and minor vessels is a valuable method for the diagnosis of abnormal breast tissue.
Previous theoretical and software studies have revealed that the absorption coefficient increases significantly at shorter wavelengths following the Hb spectrum’s improved detection conditions generally being achieved during strong absorption (24). Thus, a reduction of the illumination wavelength, which leads to an increase in the absorption properties, could provide better contrast and spatial resolution for optical imaging. In addition, the amount of oxygen in the Hb plays an important role on the absorption coefficient.
The blood Hb absorption coefficient in healthy women was 0.04 ± 0.02 cm-1, while the Hb concentration of abnormal blood was two times as high in pre-menopausal women and four times as high in post-menopausal women than it was in healthy breasts (11). Therefore, the Hb concentration may effectively be used as a biomarker for the early detection of breast disease due to hormone variants in different age groups of women. The present study selected the 2× and 4× concentrations of Hb to express the susceptibility of data with this method in different ranges of women in age groups in both pre- and post-menopause. The results showed that the absorption coefficient at 2× and 4× Hb concentrations in abnormal breast blood were significantly distinguishable from normal Hb (P < 0.001).
In the study, the homogeneous phantom μa of oxy- and deoxy-Hb were 0.024 cm-1 and 0.21 cm-1, respectively (25), but the μa of oxy- and deoxy-Hb in our study were 0.075 cm-1 and 0.17 cm-1, respectively, in the major vessels.
In a review study, the mean absorption coefficient in oxy-Hb was 0.1 cm-1; at diffuse optical mammography (600 - 1100 nm), the range of normal breast tissue was 0.02 - 0.12 cm-1 (4). In the present study, the absorption coefficients in different components of healthy breast tissue (Hbo2, lipids, water) ranged from 0.05 - 0.099 cm-1.
A method used to integrate the sphere technique and inverse Monte Carlo simulations at 633 nm with a 98% oxygen saturation showed a 0.021 ± 0.002 cm-1 absorption coefficient (26). In this study, the absorption coefficients at 637 nm in oxy-Hb were 0.075 and 0.99 cm-1 in the major and minor vessels, respectively, which may have been due to the different oxygen saturations of the Hb. The aforementioned studies indicated that there is controversy in μa for oxy- and deoxy-Hb at different concentrations of Hb. There is no evidence of major or minor vessels.
The chromosphere materials, such as oxy- and deoxy-Hb, are at the origin of the absorbing structures since they account for the blood absorption coefficient. The studies on water and lipid absorption coefficients revealed μa that were ∼10-2 cm-1 (27, 28). In this study, the μa values for water and lipids were 0.055 and 0.079 cm-1, respectively.
A comparison between the components of the breast and the Hb absorption coefficients showed that the water μa was lower than that of lipids and also lower than Hbo2 and Hb (4, 29-31). In the present study with the SM, the water μa in minor vessels was 0.075 ± 0.003, while lipids were 0.093 ± 0.007 and Hbo2 were 0.099 ± 0.017. Almost all previous studies used only spectroscopy data for their absorption coefficient calculations, but this study determined the Hb concentration with SM and PM. As a result, we showed that there was no significant difference between data from SM and PM, and both data were significant for the separation of oxy- and deoxy-Hb in the breast. The simultaneous study of two types of vessels, major and minor, provided a different μa and showed the effectiveness of the diameter of vessels in the detection of normal and abnormal breast properties. In the previously mentioned studies, there were no investigations on the diameter of vessels or its effect.
The SM and PM had the ability to detect both normal and abnormal breast blood Hb absorption coefficients via NIR transmission. There is one application of optical imaging that can take advantage of its high sensitivity to the Hb concentration of cancerous tissue without suffering from the limited specificity of this measure. In fact, a non-ionizing and non-invasive technology, such as intrinsic-contrast-based diffuse optical imaging, which can be safely performed repeatedly on the same patient at regular time intervals, is particularly suited for monitoring individual responses to a cancer diagnosis in breast screening, especially for younger women.
The PM and SM are used for measuring the NIR light output of the breast blood vessel Hb and can differentiate between major and minor vessels and also between different concentrations of Hb and other fluids. One of this study’s novelties is its consideration of the diameter of vessels as an effective factor in early detection using spectrometry or PM assay. The NIR recording results were obtained from the right and left sides of the upper and lower parts of the breast. Therefore, any locations of variation on the breast are clear. The average differentiates can be investigated between water, lipids, 2×, 4×, and oxy-Hb using a SM. However, a PM showed obvious differences between 2×, 4×, and oxy-Hb in the major and minor vessels. SM sensitivity and specificity values in the diagnosis of normal and abnormal Hb were 89.4% and 85.7%, respectively, whereas the PM sensitivity and specificity values were 100% and 100%, respectively, which indicates a high diagnostic capability. This study showed a significant effect of the vessel diameter on μa Hbo2, 2× Hb, and 4× Hb in major and minor vessels. In addition, the usefulness of the data of different concentrations of Hb for the pre-or post-menopause age groups of women was ascertained.
Our data showed that the relations between absorption coefficients in measured fluids in a breast phantom containing major and minor vessels were as follows: water ≤ lipids < Hbo2 < 2× Hb < 4× Hb. Significant differences in NIR absorption properties have been found between normal (Hbo2) and abnormal (2× Hb or 4× Hb) breasts. Thus, the PM and the SM are both reliable devices for measuring different concentrations of Hb via NIR diffusion in a breast phantom.
Finally, assessment of the Hb absorption coefficient is a useful method for the non-invasive and early differentiation of healthy and abnormal breast tissue.


