1. Background
Computed tomography (CT) is one of the most commonly used medical imaging modalities that provides high-resolution three-dimensional (3D) tomography data of the anatomic structures based on different photon attenuation of tissues (1). CT benefits could be derived from easy availability, low cost, and usefulness in tumor detection (2, 3). Iodinated compounds with high X-ray absorption coefficient have been utilized for improving CT image contrast for many years (4). However, renal toxicity and speedy clearance by means of the kidney, which provides short imaging times after administration hampered their clinical application (5, 6). CT contrast agents based on nanoparticle like polyethylene glycol coated gold nanoparticles have been designed to beat these disadvantages and to produce even higher contrast properties (7, 8).
A successful imaging agent must change image signal in order to improve image contrast, have little toxicity and high uptake in the target issue and a prolonged bloodstream circulation time (9).
Nowadays, gold nanoparticles with unique properties can have many of these features as a contrast agent. Biocompatibility with biological tissues and high atomic number and density of gold nanoparticles compared to those of iodine compounds proved its possibility to use gold nanoparticles as a contrast agent in CT scan imaging (2).
One of the ways to enhance biocompatibility of gold nanoparticles is to coat them by coating materials such as polyethylene glycol (PEG). Increasing the biocompatibility increases the time nanoparticles spend in the circulatory system, which makes it possible to provide enough time to collect cellular nanoparticles in the vicinity of the cell (1).
There are several studies that proposed gold nanoparticles as a contrast agent for CT. For example, Kim et al. (10), investigated the contrast enhancement of gold nanoparticles and compared them with that of iodinated contrast agent in CT and they reported that gold nanoparticles provide 1.9 times contrast. Jackson et al. (11) reported that gold nanoparticles produce contrast many times greater than iodine based contrast agents.
2. Objectives
To our knowledge, no study has discussed applying lower CT imaging factors to reduce radiation dose while maintaining good image quality by using gold nanoparticles as the contrast media. In this study, we aimed to assess contrast enhancement performance of gold nanoparticles by measuring contrast to noise ratio (CNR) compared to clinically used iodinated contrast agents at same concentrations. Contrast enhancement was evaluated in different tube voltages and currents.
3. Materials and Methods
3.1. Gold Nanoparticles Synthesis
Sixty milligram chloroauric acid (HAuCl4) was dissolved in 20 mL of deionized water and stirred for 15 minutes at 90°C. After the solution temperature was fixed, 60 mg polyethylene glycol (2000 MW), 50 milligrams of oleic acid, 50 milligrams of oleylamine and 100 milligrams of sodium citrate were added. Then the resulting solution was stirred for two hours to cool at room temperature (12, 13).
3.2. Iodine Containing Contrast Media Commonly Used in CT
Visipaque: Iodixanol is an iso-osmolar, non-ionic and dimeric iodine-containing x-ray contrast media with the trade name of Visipaque. Visipaque is available at the concentrations of 150 mg/mL, 270 mg/mL and 320 mg/mL in glass vials in imaging centers, especially radiology and CT (14).
Meglumine Compound 76%: Meglumine compound is ionic iodine-containing x-ray contrast media. Each 20 mL Meglumine compound 76% contains 7.2 g iodine (14).
3.3. Material Characterization
After synthesizing gold nanoparticles, the concentration of gold nanoparticle solution was determined by ICP-OES (Spectro Arcos, Germany). Optical property of gold nanoparticles was evaluated by UV-visible spectrophotometry at wavelengths between 370 nm to 1000 nm.
3.4. Phantoms
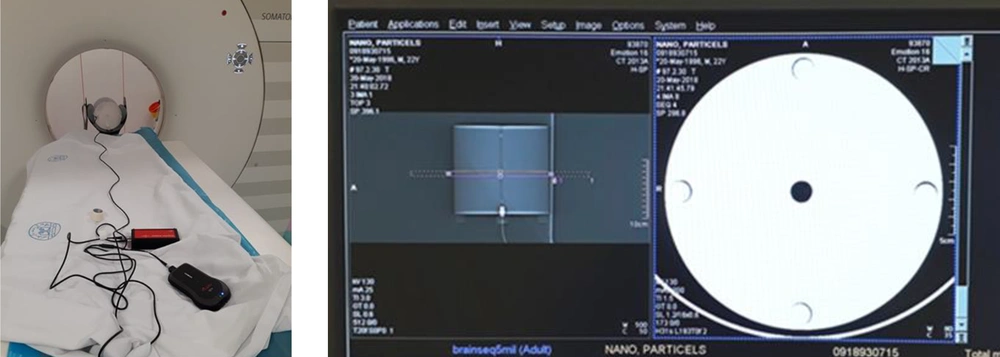
For CT dose index (CTDI) measurement, head CTDI phantom (RTI, Sweden) made of acrylic plastic (PMMA) was used. This phantom has 16 cm diameter and five holes (one in the center and four in the periphery) and 100 mm length pencil ion chamber would fit in these holes (Figure 1). First, CTDI100 was measured by 100 mm length pencil ionization chamber in each hole of the CTDI phantom. Then the pencil ionization chamber was inserted in the center (CTDIcenter) hole and at the periphery (CTDIperiphery) holes and weighted CTDI (CTDIW) was calculated by the following equation (15):
Finally, volume CTDI (CTDIv) was calculated with the following relationship (15):
Where pitch factor is the ratio of the distance the table travels per revolution to the total nominal beam collimation in spiral imaging mode (15).
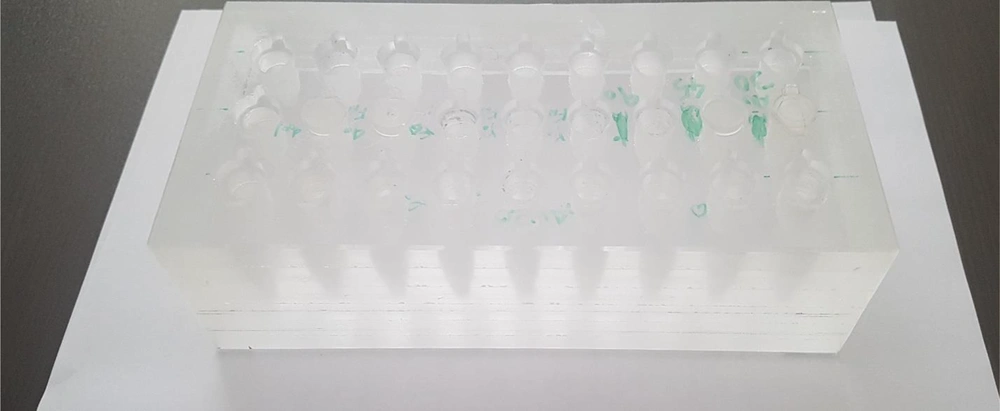
For CT imaging, a Plexiglas rectangular phantom was constructed. In this phantom, several places for accommodating 1.5 mL tube vials were considered (Figure 2).
3.5. Imaging Protocols
The gold nanoparticles and iodinated contrast agents were imaged using a 16-slice Somatom Sensation CT scanner (Siemens, Germany). The vials containing gold nanoparticle and iodinated contrast agent samples, all with the same concentration were placed in the imaging phantom.
Phantom containing gold nanoparticle and iodinated contrast agents, all in 0.7 mM concentration, were scanned with a tube voltage of 80, 110 and 130 kV, and the following tube currents: 50, 80, 110, 140, 170, and 200 mA, using a helical brain protocol. Images were reconstructed using the standard protocol.
3.6. Image and Statistical Analysis
After CT scanning, images were analyzed using syngo software (Siemens, Germany) by putting a region of interest (ROI) in three different slices in every vial and close to the background and getting an attenuation value in Hounsfield units (HU). Means and standard deviations of attenuation values for each vial were recorded and contrast was provided as the difference between the mean attenuation values of the ROI and that of the background. Consequently, CNR values were calculated by dividing contrast to standard deviation of attenuation values in background ROI (16). The variables were tube voltage and contrast media concentration. Statistical analysis was carried out by paired, one tail student’s t-test method by SPSS software version 22 and a value of P < 0.05 was considered statistically significant.
4. Results
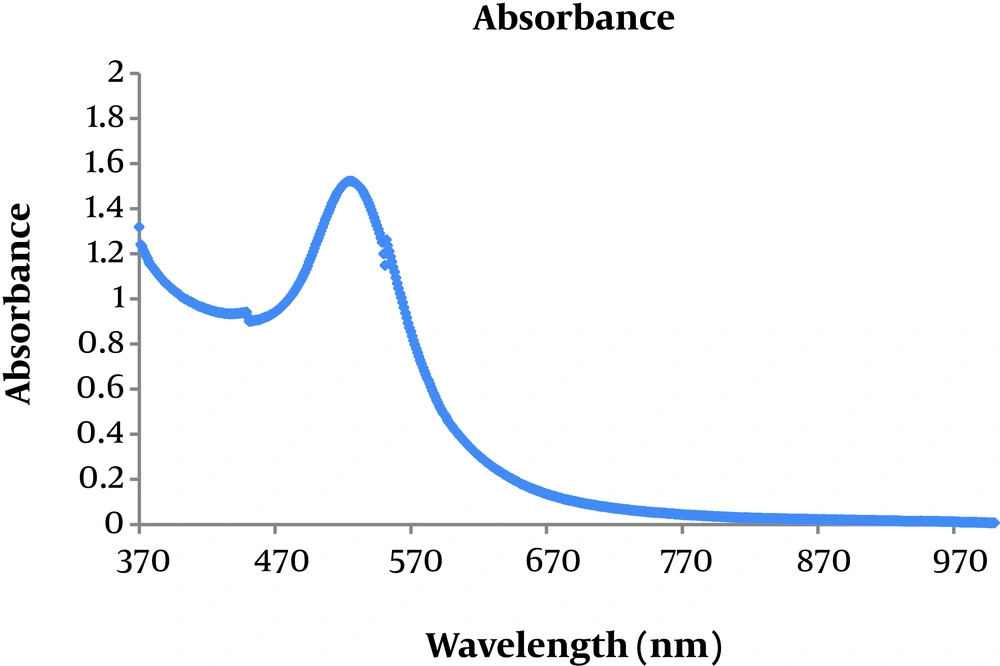
Figure 3 shows optical absorption of polyethylene glycol (PEG) -coated gold nanoparticles. It reveals that absorption peak related to them is located at 520 nm.
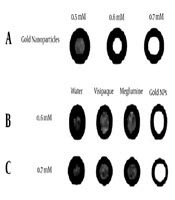
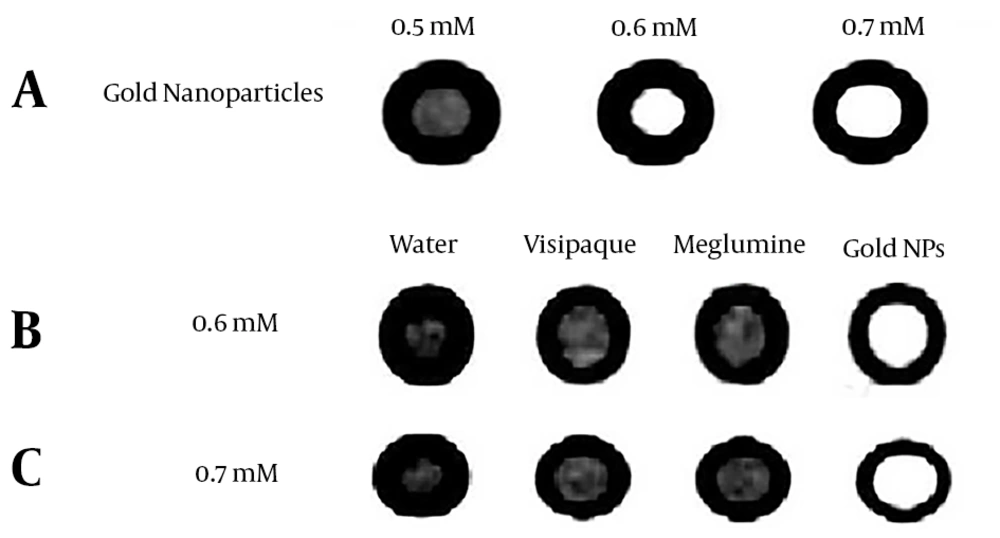
PEG-coated gold nanoparticles were synthesized in three concentrations of 0.5 mM, 0.6 mM, and 0.7 mM. Figure 4A shows an example of CT images of test vials with different concentrations. It can be seen that as the concentration of gold nanoparticles increases, attenuation increases.
Figure 4B and C show images obtained under the same exposure factors at concentrations of 0.6 mM and 0.7 mM, respectively. It clearly represents that in similar concentrations, gold nanoparticles show greater attenuation compared to iodinated contrast agents.
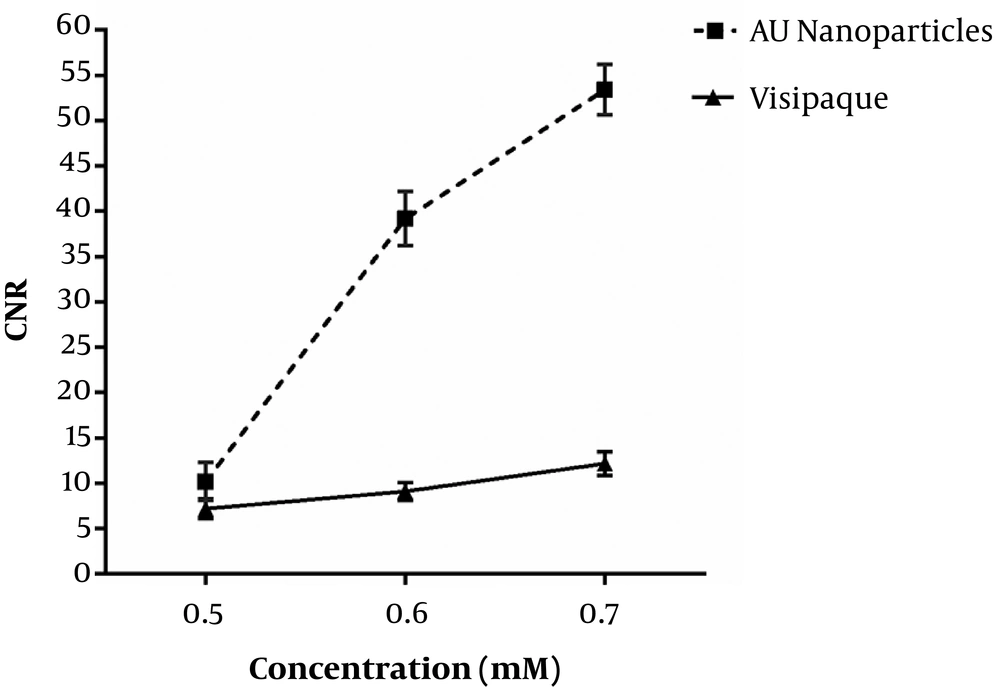
Figure 5 shows obtained CNR of gold nanoparticles and iodinated compound images as a function of concentration. By increasing the concentration of gold nanoparticles and iodinated compound, CNR increases. Increased CNR for gold nanoparticles compared to iodinated compounds was significant for concentrations of 0.6 and 0.7 mM (P < 0.05).
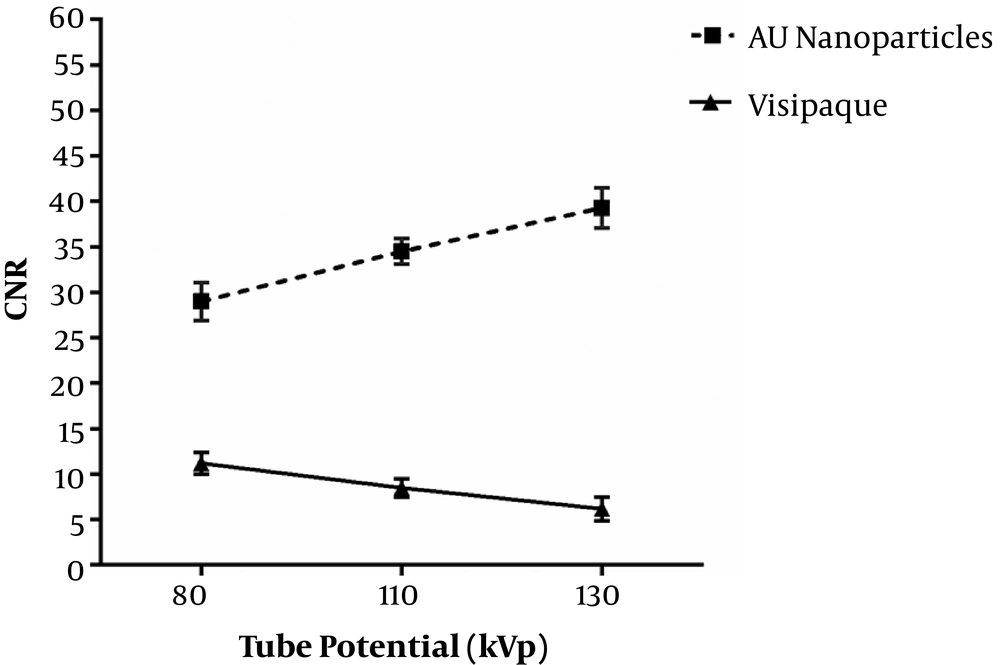
Figure 6 represents obtained CNR of images as a function of tube potential. By increasing kVp, CNR increases for gold nanoparticles, so that they have the highest CNR in 130 kVp. Iodinated compounds have the highest CNR in 80 kVp (K-edge of gold 80.7 keV and iodine 33.2 keV). Gold nanoparticles compared to iodinated compounds increased CNR significantly for all tube potentials (P < 0.05).
Table 1 shows CNR and CTDI values for gold nanoparticles and iodinated compounds in different kVp and mAs. CTDI and CNR increases by increasing in mAs and kVp. In each CTDI and concentration of 0.7 mM, CNR is significantly higher for gold nanoparticles than iodinated compound (P < 0.05).
| kVp | mAs | CNR AUNPs | CNR Visipaque | CTDIv, mGy |
|---|---|---|---|---|
| 130 | 50 | 56 ± 4.1 | 7.6 ± 1 | 12.05 |
| 130 | 110 | 60.1 ± 2 | 8.53± 1.1 | 26.22 |
| 130 | 200 | 70.8 ± 5 | 8.1 ± 1 | 47.48 |
| 110 | 50 | 43.5 ± 3 | 8 ± 1 | 8.25 |
| 110 | 110 | 50.3 ± 1.2 | 8.1 ± 0.3 | 17.96 |
| 110 | 200 | 53.9 ± 4.1 | 7.5 ± 1 | 32.52 |
| 80 | 50 | 44.1 ± 3.2 | 9.6 ± 1 | 3.67 |
| 80 | 110 | 44.6 ± 3.3 | 14 ± 2.1 | 7.98 |
| 80 | 200 | 46.2 ± 2 | 17 ± 1.8 | 14.45 |
Abbreviations: AUNPs, gold nanoparticles; CNR, contrast-to-noise ratio; CTDIv, volume CT dose index; SD, standard deviation.
aValues are expressed as mean ± SD.
5. Discussion
In this study, we have shown that gold nanoparticles in concentrations higher than 0.5 mM and energies 80 - 130 kVp display higher image CNR than iodinated contrast media. Image CNR for gold nanoparticles increased by increasing kVp and mAs. The CNR value is maximum for iodinated compounds at voltage of 80 kVp and 200 mAs in the same concentration with gold nanoparticles. The CNR value at 130 kVp and 200 mAs is approximately five times higher than that of iodinated compounds.
Jackson et al. (11) compared the energy dependency of the contrast produced by gold nanoparticles and same concentration of iodinated contrast media. Their results showed that the kVp has remarkable impact on the contrast enhancement of the two contrast agents. At a concentration of 0.5077 M, no significant difference in contrast enhancement was reported at energies routinely utilized for angiography (around 80 kVp) probably because of the k-edge effect for iodine (11). At the highest tube voltages usually used in computed tomography, CNR for gold nanoparticles was about 114% greater than that produced by iodine at 140 kVp.
In 2012, Galper et al. compared the contrast enhancement of gold nanoparticles with iodinated compounds. They revealed that the contrast enhancement of gold nanoparticles at 120 kVp is 1.9 times higher than that of iodinated compounds (17).
Kim et al. (10) assessed the contrast enhancement of gold nanoparticles with that of iodine contrast agent in the range of 1 to 3 M. Their results showed that gold nanoparticles provide 1.9 times better contrast. Our results are consistent with all the above-mentioned studies.
Computed tomography is one of the most important sources of ionizing radiation in medical applications (18). A bedrock of radiation protection is to hold radiation exposure “as low as reasonably achievable” (ALARA principle) (19). ALARA states that the optimal quality of diagnostic image must be obtained at the lowest possible radiation dose. As shown in Table 1, increasing the mAs significantly increases the absorbed dose. However, this increase does not result in noticeable contrast enhancement. At 130 kVp, increasing the tube-current product from 50 to 200 mAs resulted in approximately 3.8 fold increase in radiation dose, whereas the corresponding contrast enhancement was not noticeable (1.2 fold). In all CTDI values, the contrast enhancement obtained by gold nanoparticles are much higher than that of iodinated contrast media. Therefore, gold nanoparticles would reduce radiation dose in CT examination by lowering related mAs, while enhancing the contrast of CT images.
In summary, this study represents that better contrast enhancement could be provided using gold nanoparticles compared to iodinated contrast media. The CNR values obtained by gold nanoparticles increases by increasing kVp and mAs. Gold nanoparticles could be a good candidate for optimizing CT imaging by lowering radiation dose as low as possible while enhancing the image contrast. In biological environments, contrast enhancement could be more successful by modifying gold nanoparticles with targeted ligands.
