


1. Background
Patients with angina, evidence of ischemia but without obstructive coronary atherosclerotic disease (CAD), are increasingly recognized and termed as ischemia and no obstructive coronary artery disease (INOCA) (1). Most of INOCA patients have objective myocardial ischemia or limited coronary flow reserve consistent with cardiac microvascular disease (CMVD) (2). Epicardial adipose tissue (EAT) has proved to play a vital role in the progression of CMVD given its special localization and potential for regional secretion of inflammatory cytokines, and is increasingly recognized as metabolically active and associated with adverse cardiovascular outcomes (3). Therefore, we assume that EAT may also be a predictor of INOCA. Several studies (4-6) have demonstrated that the adipose tissue around the myocardium could be precisely evaluated by computed tomography (CT), magnetic resonance imaging (MRI), or ultrasound with different measurement techniques (volume or thickness). However, CT achieves a much more precise quantification of EAT because of its higher spatial resolution in comparison with MRI and ultrasound.
2. Objectives
In this retrospective study, we explored EAT volume and thickness by cardiac computed tomography angiography (CCTA) in patients suspected with CMVD, and excluded myocardial ischemia for hemodynamic dysfunction of coronary arteries by CT derived fractional flow reserve (CT-FFR).
3. Patients and Methods
The Institutional Review Board of our hospital approved the study. Written informed consent was obtained from all individuals.
3.1. Study Population and Data Collection
From January 2017 to October 2018, a total of 254 consecutive patients suspected of coronary atherosclerotic disease (CAD) and no history of coronary stenting or bypass surgery underwent CCTA (Figure 1). Exclusion criteria included: myocardial infarction or revascularization, arrhythmia, reduced kidney function, and contra-indication to iodinated contrast agent. There were 195 (76.8%) patients diagnosed of no- to moderate- coronary stenosis by CCTA. Among the 195 patients, 44 (44/195, 22.6%) were excluded for obstructive CAD, which was defined as ≥ 50% diameter stenosis of epicardial coronary arteries and fractional flow reserve ≤ 0.80 demonstrated by CT-FFR (Figure 2A). Among the 151 patients without obstructive CAD, 72 (47.7%) had the risk factors for CMVD (female, or male with metabolic syndrome), and provided a response consistent with definite or probable angina using the Rose angina questionnaire. Because of the lack of objective evidence of CMVD, these patients could not be diagnosed as CMVD and classified as INOCA group.

Patient flow diagram. A total of 72 of 254 patients met the inclusion criteria. Abbreviations; CCTA: coronary computed tomographic angiography. CT-FFR: CT derived fractional flow reserve; CAD: coronary artery disease; INOCA: ischemia and no obstructive coronary artery disease; CMVD: cardiac microvascular disease.
The definition of CMVD is as follows: angina, no obstructive CAD plus objective evidence of coronary microvascular dysfunction (abnormal response to intracoronary acetylcholine [Ach] and/or systemic adenosine [coronary flow reserve (CFR) and/or index of microcirculatory resistance (IMR)]). The definition of INOCA is as follows: syndrome of patients with either symptoms and /or signs of ischemia but found to have no obstructive coronary artery disease. CCTA images of those patients were retrospectively analyzed. Forty-eight patients without symptom of angina and risk factors for CMVD were recruited as the control group. They all underwent CCTA for physical examination without angina, and obstructive coronary artery disease was ruled out by CCTA analysis and CT-FFR.
3.2. CCTA Examination
All CCTA examinations were performed by the same CT scanner (Revolution CT, GE Healthcare, Milwaukee, WI) using prospectively electrocardiography (ECG)-triggered in one cardiac cycle. The range of CT scan was from the level of the tracheal bifurcation to the cardiac apex. Scanning parameters were: collimation, 256×0.625; reconstruction slice thickness, 0.625 mm; slice interval, 0.625 mm; gantry rotation speed, 0.28 s; automatically selected tube voltage, 100 or 120 kV; smart-mA on the basis of the scout image of the participant; field of view (FOV), 25 cm.
An 18-G intravenous catheter was placed through the antecubital vein in all participants, and 50 to 60 mL of the contrast medium iopromide (370 mg iodine/mL; Bracco, Italy) was injected at 4.5 to 5.5 mL/s on the basis of body mass index (BMI) and the vein condition. After injection of the contrast medium, a 30 or 40 mL saline flush was given at the same injection rate. Then, we manually placed the region of interest (ROI) in the ascending aorta, and image acquisition automatically started once the selected threshold (120 HU) was reached by bolus tracking. When further reduction of motion artefacts was required, we used the optimum phase of heart rate reconstruction and the SSF (SnapShot Freeze) motion correction algorithm (7).
All patients had the optimum diastolic phase for EAT measurements reconstructed. Window settings were regulated to properly observe the pericardium and EAT. All measurement parameters were assessed by an investigator (Dr. Cheng Li) blinded to grouping, with 15 years of experience in CCTA reconstruction and analysis. The recorded dose-length product (DLP, mGy cm) was used to approximate the effective dose (ED) as reported previously (8).
3.3. Epicardial Fat Volume and Thickness
EAT was determined as the adipose tissue between myocardial surface and the visceral pericardium, and measured with the GE AW4.7 workstation processing and analysis software. EAT was measured in the most motionless phase of the cardiac cycle (mid-diastolic phase), with prospective cardiac gating at 70-80% of the R-R interval (9). The EAT range was defined from the pulmonary artery bifurcation to the cardiac apex. Structures outside the visceral pericardium were manually removed, including the mediastinal fat, thorax and lung. Then, the threshold determination method was used to isolate EAT from other structures with a CT value range of - 200 to – 30HU. Finally, EAT volume was automatically calculated by the volume measurement function of the software (Figure 2B-D).
EAT thickness was assessed on the surface of the right ventricle’s free wall at middle diastole on the reconstructed short-axis image, for this area was regarded as simultaneously having relatively thicker EAT layer and the least motion artifact. In order to avoid overestimation of EAT due to obliquity, EAT thickness was measured on axial sections that were perpendicular to the surface of the myocardium of the right ventricle. Average EAT thickness was calculated from three different measurements at 7 o’clock, 9 o’clock, and 11 o’clock in the free wall of the right ventricle. Each measurement line was perpendicular to the myocardial surface (Figure 2E).
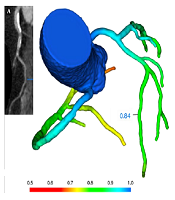
 analysis demonstrates the absence of coronary hemodynamically significant stenosis (> 0.80). Epicardial adipose tissue (EAT) volume and thickness measurement by computed tomography. B, EAT is defined as the adipose tissue between myocardial surface and the visceral pericardium (green scope). C, Then the method of threshold determination is used to isolate EAT from other structures with CT value range of - 200 to – 30HU. D, EAT volume measurement at the middle level of ventricles. E, EAT thickness is measured on the free wall of the right ventricle at middle diastole on the reconstructed short-axis image on the basal level of ventricles. Average EAT thickness was calculated from three different measurements at 7 o’clock, 9 o’clock, and 11 o’clock in the free wall of the right ventricle (short white lines numbered 1, 2, 3). Each measurement line was perpendicular to the myocardial surface. RV: right ventricle, LV: left ventricle, RA: right atrium, LA: left atrium.")
A, CT derived fractional flow reserve (CT-FFR) analysis demonstrates the absence of coronary hemodynamically significant stenosis (> 0.80). Epicardial adipose tissue (EAT) volume and thickness measurement by computed tomography. B, EAT is defined as the adipose tissue between myocardial surface and the visceral pericardium (green scope). C, Then the method of threshold determination is used to isolate EAT from other structures with CT value range of - 200 to – 30HU. D, EAT volume measurement at the middle level of ventricles. E, EAT thickness is measured on the free wall of the right ventricle at middle diastole on the reconstructed short-axis image on the basal level of ventricles. Average EAT thickness was calculated from three different measurements at 7 o’clock, 9 o’clock, and 11 o’clock in the free wall of the right ventricle (short white lines numbered 1, 2, 3). Each measurement line was perpendicular to the myocardial surface. RV: right ventricle, LV: left ventricle, RA: right atrium, LA: left atrium.
3.4. CT-FFR Algorithm
CT-FFR calculation (DEEPVESSEL FFR V1.0, Beijing Curacloud Technology Co., Ltd.) consisted of two main steps. The first step was to form a 3D coronary artery tree and automatically generate its centerline. A modified 3D U-Net like model was used to extract a preliminary coronary artery tree, and then a global optimization approach was applied to refine the boundaries of coronary arteries. Then we used a centerline similar to the minimum path extraction filter and calculated the measurement value at each point along the centerline. In the second step, the FFR values were predicted by a novel path-based model of deep learning named deep FFR, which included the neural networks based on each point of the vascular pathways, receiving structural and functional characteristics of each point as input on the vascular paths, and finally predicting FFR of each point as output.
3.5. Statistical Analysis
Statistical analysis was performed by SPSS 22.0 software (IBM SPSS Statistics, Armonk, NY, USA) and GraphPad Prism (Prism for Windows, Version 8.0; Graph-Pad Software, Inc., La Jolla, CA, USA). After testing the normality of variables using Shapiro-Wilk test, values were described with either mean ± standard deviation (SD) or median with interquartile range (IQR). Then those data between CMVD and control groups, diabetes mellitus (DM) and non-DM groups were compared by using Pearson chi-squared test, two-sample t test, and Mann-Whitney U Test for categorical variables, continuous variables with normal distribution, and continuous variables with skewed distribution, respectively.
Correlations between age, gender, current smoking, BMI, hypertension, DM and blood lipid level with EAT volume and thickness were analyzed using Pearson’s or Spearman’s correlation, depending on distribution. Logistic regression analysis was performed to examine the influence of the following variables on CMVD: age, gender, current smoking, BMI, hypertension, DM, blood lipid level, EAT volume and thickness. The odds ratios with 95% confidence intervals (CIs) were calculated. Receiver operating characteristic (ROC) analysis was used to calculate a cutoff value of EAT volume and thickness for predicting CMVD. A P value of less than 0.05 was considered significant.
4. Results
4.1. Baseline Characteristics
The 72 CMVD patients included 36 men and 36 women. The median age was 63 years, and body mass index (BMI) averaged 24.8. The characteristics of the CMVD and control groups are depicted in Table 1. There were no significant differences in age, gender, smoking history, BMI, and total cholesterol and LDL-cholesterol levels between the CMVD and control groups.
| Variable | INOCA group (n=72) | Control group (n=48) | P value |
|---|---|---|---|
| Age (years) | 63 ± 9 (56-69) | 63 ± 7 (59-66) | 0.946 |
| Male, No. (%) | 36 (50) | 20(41.7) | 0.456 |
| Current smoking, No. (%) | 42 (58.3) | 22 (45.8) | 0.196 |
| Body mass index (median value with interquartile range, kg/m2) | 24.80 ± 2.26 (23.60-27.32) | 24.22 ± 3.04 (23.40-27.07) | 0.265 |
| Hypertension, No. (%) | 42 (58.3) | 11 (22.9) | < 0.001 |
| Diabetes mellitus, No. (%) | 35 (48.6) | 8 (16.7) | < 0.001 |
| Total cholesterol (median value with interquartile range, mmol/l) | 4.35 ± 1.25 (3.19-4.78) | 3.90 ± 0.92 (3.50-4.39) | 0.376 |
| Triglycerides (median value with interquartile range, mmol/l) | 1.50 ± 0.83 (1.20-2.70) | 1.50 ± 1.01 (0.90-1.60) | 0.015 |
| HDL-cholesterol (median value with interquartile range, mmol/l) | 1.13 ± 0.36 (0.84-1.34) | 1.28 ± 0.53 (1.03-1.50) | 0.017 |
| LDL-cholesterol (median value with interquartile range, mmol/l) | 2.11 ± 0.63 (1.44-2.60) | 2.25 ± 0.71 (1.54-2.41) | 0.51 |
| EAT thickness (median value with interquartile range, mm) | 3.32 ± 0.42 (3.04-3.65) | 3.06 ± 0.37 (2.98-3.24) | < 0.001 |
| EAT volume (median value with interquartile range, mm3) | 195.40 ± 16.35 (183.40-211.10) | 183.40 ± 12.12 (178.60-189.40) | < 0.001 |
Baseline Characteristics and Comparison between INOCA Group and Control Group
Despite similar BMI values, EAT thickness and volume were significantly increased in CMVD patients compared with controls (EAT thickness, 3.32 mm vs. 3.06 mm; EAT volume, 195.4 cm3 vs. 183.4 cm3, both P < 0.001) (Figure 3A-B). Blood triglyceride levels were higher in CMVD patients compared with controls (P < 0.05) (Figure 3C), while HDL-cholesterol levels were lower (P < 0.05). There were more patients with hypertension and DM in the CMVD group compared with controls (hypertension, 58.3% vs. 22.9%; DM, 48.6% vs. 16.7%; both P < 0.001).
ROC analysis for identifying CMVD demonstrated a higher area under the curve (AUC) for EAT volume (0.773, 95% CI 0.616-0.930) compared with EAT thickness (0.692, 95%CI 0.597-0.786) (Figure 3D). The cut-off value of EAT thickness was 3.2 mm (sensitivity, 60%; specificity, 25%). The cut-off value of EAT volume was 179.6 cm3 (sensitivity, 87.5%; specificity, 36.8%).
4.2. Associations of INOCA with Other Factors
Multivariate logistic regression analysis was employed to explore whether EAT was independently and significantly associated with INOCA (Table 2). In model 1, which included age, gender, smoking status, BMI, presence/absence of hypertension and/or DM, blood lipid levels, and EAT thickness, age, presence of hypertension, blood levels of triglycerides and LDL-cholesterol amounts, in addition to EAT thickness, emerged as significant and independent factors associated with INOCA (odds ratio [OR] of EAT thickness=0.07, 95%CI 0.01-0.47). Model 2, in which EAT thickness was replaced with EAT volume, demonstrated that EAT volume was also an independent factor (OR= 0.93, 95%CI 0.89-0.98) (Figure 2B-E). In model 3, all of these items were analyzed as single predictive factors, and hypertension, DM, triglyceride levels, EAT thickness, and volume were independent predictive factors. In the three models, presence of hypertension, triglyceride levels, and EAT thickness and volume were significantly associated with CMVD and minimally affected by other factors.
| Variable | Model 1 | Model 2 | Model 3 | |||
|---|---|---|---|---|---|---|
| OR | 95% CI | OR | 95% CI | OR | 95% CI | |
| Age | 0.93 | 0.87-0.99 | 0.92 | 0.87-0.99 | 1 | 0.97-1.05 |
| Gender | 0.33 | 0.09-1.14 | 0.23 | 0.06-0.81 | 0.71 | 0.34-1.49 |
| Current smoking | 0.64 | 0.24-1.76 | 0.58 | 0.21-1.62 | 0.6 | 0.29-1.26 |
| Body mass index | 0.3 | 0.77-1.09 | 0.91 | 0.76-1.08 | 0.93 | 0.81-1.06 |
| Hypertension | 0.23 | 0.07-0.78 | 0.19 | 0.05-0.68 | 0.21 | 0.09-0.48 |
| Diabetes mellitus | 0.34 | 0.09-1.26 | 0.43 | 0.11-1.71 | 0.21 | 0.09-0.51 |
| Total cholesterol | 0.23 | 0.09-0.58 | 0.29 | 0.12-0.68 | 0.84 | 0.60-1.17 |
| Triglycerides | 0.3 | 0.14-0.66 | 0.38 | 0.17-0.88 | 0.48 | 0.29-0.81 |
| HDL-cholesterol | 2.71 | 0.24-30.36 | 4.05 | 0.30-54.60 | 3.13 | 0.92-10.65 |
| LDL-cholesterol | 5.88 | 1.66-20.90 | 4.1 | 1.23-13.66 | 0.99 | 0.64-1.55 |
| EAT thickness | 0.07 | 0.01-0.47 | 0.14 | 0.04-0.45 | ||
| EAT volume | 0.93 | 0.89-0.98 | 0.94 | 0.91-0,97 | ||
Multivariate Logistic Regression Analysis of the Association Between CMVD and Other Factors
4.3. Associations of Epicardial Fat with Other Factors
Correlation analyses performed for EAT and other factors in 120 patients in the CMVD and control groups demonstrated that hypertension, DM and total cholesterol levels were positively associated with EAT thickness (coefficient of variation [CV] and P-value: 0.25, P = 0.01; 0.44, P < 0.001; 0.19, P = 0.04, respectively), while age, sex, smoking status, BMI and other blood lipid markers were not associated with EAT thickness. Age, BMI, hypertension, DM and blood triglyceride levels were positively associated with EAT volume (CV and p-value: 0.18, P = 0.04; 0.24, P < 0.001; 0.18, P = 0.04; 0.5, P < 0.001; and 0.33, P < 0.001, respectively) (Table 3). Presence of DM was apparently associated with both of EAT thickness and volume (P < 0.001). When the 120 patients were divided according to DM presence/absence, medians and IQR values of EAT thickness in the DM and non-DM groups were 3.57 (3.16-3.87) and 3.07 (2.98-3.30) mm, respectively (P < 0.001); EAT volumes in both groups were 209.4 (193.4-217.2) and 183.4 (180.3-189.7), respectively (P < 0.001) (Figure 3E-F).
| Variable | EAT thickness | EAT volume | ||
|---|---|---|---|---|
| CV | P value | CV | P value | |
| Age | -0.08 | 0.38 | 0.18 | 0.04a |
| Gender | 0.17 | 0.06 | -0.01 | 0.89 |
| Current smoking | 0.03 | 0.76 | 0.02 | 0.85 |
| Body mass index | 0.18 | 0.05 | 0.24 | <0.001b |
| Hypertension | 0.25 | 0.01a | 0.18 | 0.04a |
| Diabetes mellitus | 0.44 | <0.001b | 0.5 | <0.001b |
| Total cholesterol | 0.19 | 0.04a | -0.17 | 0.06 |
| Triglycerides | 0.12 | 0.18 | 0.33 | <0.001b |
| HDL-cholesterol | -0.04 | 0.64 | -0.03 | 0.73 |
| LDL-cholesterol | -0.01 | 0.88 | -0.09 | 0.33 |
Correlation Analyses Between EAT and Other Factors
 and volume (B) of epicardial adipose tissue (EAT) (P < 0.001), blood triglycerides level (C) (P < 0.05) were significantly increased in ischemia and
no obstructive coronary artery disease (INOCA) patients compared to controls. D, Receiver operating characteristic
(ROC) analysis for identifying INOCA demonstrated the higher area under the curve for the EAT volume (0.773, 95% CI, 0.616-0.930) than the EAT thickness (0.692, 95% CI, 0.597-0.786). E and F, EAT volume and thickness and volume were significantly increased in patients with diabetes mellitus (DM) compared to patients without DM. (P < 0.001).")
A-C, Box and violin figures show that thickness (A) and volume (B) of epicardial adipose tissue (EAT) (P < 0.001), blood triglycerides level (C) (P < 0.05) were significantly increased in ischemia and no obstructive coronary artery disease (INOCA) patients compared to controls. D, Receiver operating characteristic (ROC) analysis for identifying INOCA demonstrated the higher area under the curve for the EAT volume (0.773, 95% CI, 0.616-0.930) than the EAT thickness (0.692, 95% CI, 0.597-0.786). E and F, EAT volume and thickness and volume were significantly increased in patients with diabetes mellitus (DM) compared to patients without DM. (P < 0.001).
5. Discussion
EAT is the fatty tissue located between the visceral and parietal layers of the serous pericardium. It surrounds and directly contacts the coronary arteries, and is mainly located in the atrioventricular and interventricular grooves. It is directly supplied by the coronary arteries and has no fascia separated from myocardial tissue.
Angina without hemodynamically significant stenosis of coronary arteries has been associated with high risk of major adverse cardiovascular events (MACE). Indeed, CMVD is increasingly considered a crucial contributor in the pathophysiologic course of ischemic heart disease (1, 10), and is also an important disease category of INOCA. Under the condition of increased demand of oxygen and decreased CFR, even lack of obstructive CAD can cause downstream myocardial ischemia due to disordered supply-demand relationship, which may injure the myocardium and aggravate overall ventricular mechanics and dysfunction (11). A recent review assessing INOCA suggested prospective directions of studies, including detection with noninvasive imaging modalities (1). Increased adipose tissue, especially EAT, was suggested to possibly influence the myocardium by directly secreting adipokines near or through the vesa vasora, where adipokines may interact with the myocardium leading to downstream endothelial abnormality and ventricular remodeling (12), and causing metabolic and hemodynamic dysfunctions in the body (13, 14). A few biomolecular studies in humans have demonstrated that EAT is active in metabolism and may act as a crucial source of inflammatory mediators (15, 16). Due to the high spatial resolution of CT images, fibrous pericardium could be easily visualized for a precise measurement of EAT (3). Unlike stenosis of epicardial coronary arteries, the coronary microcirculation cannot be directly displayed by coronary angiography. However, EAT, which is associated with atherosclerosis and metabolic dysfunction, may be a good predictor of INOCA and CMVD as an indicator that can be precisely measured by coronary CT angiography. To our knowledge, this is the first comprehensive study that quantified EAT thickness and volume in INOCA patients excluding coronary hemodynamic dysfunction by CT-derived FFR. All the participants in our case group had risk factors of CMVD; therefore, the quantitative difference in EAT measurements between the two groups may be related to CMVD.
In this study, average BMI was similar in INOCA and healthy patients. Nevertheless, the thickness and volume of EAT were significantly increased in INOCA patients compared with controls, corroborating a previous study (17). A plausible explanation is that BMI is an evaluation of the entire fat situation and fails to acquire information regarding the distribution of body adipose tissue. However, it remains unclear whether EAT is a cause or an effect of INOCA, or even just an inculpable bystander. Further researches are needed to clarify this point.
Van Woerden et al. (17) explored the association of EAT with CMVD by CT angiography, demonstrating that only EAT thickness, but not EAT volume, is independently associated with decreased myocardial flow reserve, and ROC curves displayed a superior performance of EAT thickness compared with EAT volume. Different from these findings, we found that EAT volume displayed a higher AUC compared with EAT thickness, and both EAT indexes were significantly increased in CMVD patients compared with controls. The reasons for such discrepancy may be that in the above study, the CMVD patient size was small (n=26), and non-obstructive CAD (< 50% luminal diameter stenosis) was excluded by coronary CT angiography. Meanwhile, in the present study, we excluded non-obstructive CAD according to hemodynamically significant coronary stenosis by CT-FFR.
Type 2 DM is associated with EAT and visceral fat (18, 19), and may be an early marker of atherosclerosis and epicardial CAD (16). Ng et al. (20) reported that both increased EAT volume and insulin resistance are independently associated with elevated myocardial fat accumulation. Our findings that EAT was increased in INOCA patients and DM apparently associated with EAT thickness and volume support this notion.
Enhanced cardiac CT imaging allows for precise measurement of EAT, and the reasons are as follows: 1) the fibrous pericardium can be easily visualized due to the high spatial resolution of CCTA; 2) EAT quantification using CCTA images is highly reproducible compared to other methods; 3) CCTA images can provide clear anatomical structures of the heart, which is helpful for the measurement of EAT thickness and volume; after enhancement of the myocardium, the density difference increases between the myocardium and EAT; 4) CCTA examination can simultaneously evaluate the epicardial coronary artery and myocardium diseases (9).
Risk factors for INOCA comprise but are not limited to gender and metabolic syndrome (3). In the present study, associations of several factors were explored, including age, gender, smoking status, BMI, presence/absence of hypertension and/or DM, blood lipid levels, and EAT thickness and volume. As shown above, hypertension, blood triglyceride levels, and EAT thickness and volume were significantly associated with INOCA, and not significantly affected by other factors in multiple logistic regression analysis. Age, gender, DM, total cholesterol and LDL-cholesterol may be risk factors for INOCA but were likely affected by other factors in multiple logistic regression analysis.
In conclusion, this study had a few limitations. First, the scale of our study was relatively small, which may lead to elevated odds of false-positive outcomes. Second, due to the cross-sectional, retrospective nature of this study, we failed to explore the diagnostic accordance of EAT by different imaging modalities such as MRI and ultrasound. The present findings suggest that EAT is a marker of INOCA or CMVD with direct adverse effects on myocardial microcirculation, and may be a target for pharmacological therapy and serve as a prognostic indicator. Future studies should focus on the potential cause-effect relationship between EAT and INOCA, as well as myocardial microcirculation changes upon EAT volume reduction, developing a universal definition for diagnosing INOCA by non-invasive techniques.
