


.png)


1. Background
Severe acute respiratory syndrome-coronavirus 2 (SARS-CoV2), a betacoronavirus, was first detected in late December 2019 in Wuhan, Hubei Province, China (1, 2). Although a long time has passed since the emergence of coronavirus disease 2019 (COVID-19), the prevalence of this disease still continues to increase in most countries. By May 24, 2020, a total of 5,204,508 confirmed cases of COVID-19 and more than 337,000 deaths were reported in 203 countries (3). In a retrospective study, R0, which refers to the mean number of new infections from an infected person to a naive population, was apprised to be 3.28 as opposed to 1.4 - 2.5, estimated by the World Health Organization (WHO) (4). Other studies have reported that R0 can be as high as 5.7 (5).
The majority of patients with lower respiratory tract infections, induced by COVID-19, have myalgia, dyspnea, cough, and fever (6). Also, 17% to 29% of cases suffer from acute respiratory distress syndrome (ARDS) (7, 8). Because the clinical presentations of COVID-19 pneumonia are non-specific, distinct testing methods need to be utilized. Besides, initial diagnosis by separating and treating the patients in a timely manner can be of significance in preventing the spread of the disease, improving prognosis, and reducing fatality. Therefore, early diagnosis of COVID-19 pneumonia is of major importance.
Detection of viral nucleic acids using real-time polymerase chain reaction (RT-PCR) has been the benchmark testing method for diagnosing COVID-19 pneumonia (9). However, waiting for viral detection via RT-PCR can result in a delayed pneumonia diagnosis. Besides, the result of RT-PCR may be negative at the onset of COVID-19 pneumonia (9). The interval between an initial negative PCR result and a positive result is often 4 - 8 days. Therefore, thoracic radiology for suspected cases of COVID-19 pneumonia is a crucial diagnostic factor. Chest X-rays have a highly valuable function in identifying the involvement of pathologies affecting the lungs (10). However, small abnormalities may not be identified, and the higher resolution of computed tomography (CT) imaging is especially important for the initial diagnosis of patients who are highly suspicious of COVID-19, but are negative on chest X-ray.
2. Objectives
This study aimed to present a retrospective evaluation of the CT scan characteristics of hospitalized patients with COVID-19 pneumonia in our center and to compare the results of discharged patients with the expired ones.
3. Patients and Methods
3.1. Study Design and Participants
This case-control study was performed on 115 consecutive COVID-19 patients, admitted to Shahid Modarres Hospital (Tehran, Iran) between April 30, 2020 and May 15, 2020. Shahid Modarres Hospital is a tertiary hospital and a referral center for COVID-19 cases during the COVID-19 pandemic. Of 115 patients, 53 were discharged, and 62 were allocated to the expired group. Among discharged patients, 24 required intensive care unit (ICU) admission, and 29 remained in the respiratory ward. The patients were admitted based on the clinical criteria for COVID-19, developed by the WHO (11).
The inclusion criteria were as follows: positive RT-PCR for COVID-19 and chest CT scan during hospital admission. Patients, who were still hospitalized and their final status was not determined (either discharged or expired), were excluded from the study. All patients had a positive test result for the viral RNA of 2019-nCoV in their throat swab samples, based on RT-PCR, using the standard RT-PCR protocol by the Center for Disease Control and Prevention (CDC) (9). This study was approved by the ethics institutional review board of Shahid Beheshti University of Medical Sciences, Tehran, Iran. The requirements for obtaining written informed consent were waived.
3.2. Data Collection
Two experienced researchers collected the demographic, clinical, and laboratory data from the patients’ electronic medical records and nurses’ notes and reports; the data were double-checked independently. Two experienced radiologists and a pulmonologist also assessed the imaging findings separately, and the final result was approved by unanimous agreement if there was a discrepancy.
3.3. Imaging Evaluation and Definitions
The CT findings included lobar and segmental involvement, air bronchogram, consolidation, ground glass opacity (GGO), morphology of subpleural reticulation, crazy-paving pattern, reversed halo, and pleural effusion. Consolidations were described as homogeneous opacities, obfuscating the underlying vessels. Also, GGO was described as an area of hazy opacification or increased attenuation, without concealment of the underlying vessels. Besides, air bronchograms were described as patterns of air-filled bronchi (low attenuation) in the opaque lungs (high attenuation).
The peripheral location of the lesions was determined when the outer 1/3 of the lungs was involved. The central location of the lesion was defined when the inner 2/3 of the lungs were involved. Moreover, radiological reporting was based on the suggested reporting protocols by the Radiological Society of North America (RSNA) (12). Therefore, the chest CT findings of COVID-19 patients were each classified into four categories of typical, intermediate, atypical, and negative for COVID-19.
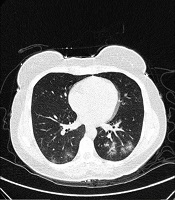
Typical findings were described by the presence of a reverse halo sign; multifocal GGO with/without consolidation or a crazy-paving pattern; peripheral or bilateral GGO with/without consolidation or a crazy-paving pattern; or other results indicative of organized pneumonia (Figures 1A-D, 2, 3A, 3B, and 4). Intermediate findings were described by the absence of typical characteristics and the presence of unilateral, perihilar, diffuse, or multifocal GGO, with/without consolidation without a particular distribution (not peripheral or rounded); or small GGO with no peripheral or rounded distribution (Figures 5A and B). Besides, atypical findings were described by the absence of indeterminate or typical characteristics; thickening of the interlobular septum and pleural effusion; lung cavitation; discrete small nodules; and lobar/segmental consolidations with no GGO (Figures 6-8). Finally, the negative findings were described as the absence of CT features suggesting pneumonia.
 shows peripheral and multifocal ground glass opacity (GGO) with consolidation.")
Typical CT imaging features of COVID-19. Unenhanced thin-section axial image of the lungs in a patient with a positive RT-PCR result (A-D) shows peripheral and multifocal ground glass opacity (GGO) with consolidation.
 with rounded morphology, with or without consolidation or a crazy paving pattern.")
Typical CT imaging features of COVID-19. Unenhanced thin-section axial image of the lungs in a patient with a positive RT-PCR result shows multifocal ground glass opacity (GGO) with rounded morphology, with or without consolidation or a crazy paving pattern.
, with or without consolidation or visible intralobular lines (crazy paving pattern).")
Typical CT imaging features of COVID-19. Unenhanced thin-section axial image of the lungs in a patient with a positive RT-PCR shows peripheral ground glass opacity (GGO), with or without consolidation or visible intralobular lines (crazy paving pattern).
 with a crazy paving pattern and reverse halo sign.")
Typical CT imaging features of COVID-19. Unenhanced thin-section axial image of the lungs in a patient with a positive RT-PCR shows peripheral ground glass opacity (GGO) with a crazy paving pattern and reverse halo sign.
 with consolidation, without a specific distribution (non-rounded or non-peripheral) associated with bilateral pleural effusion.")
A and B, Indeterminate CT imaging features of COVID-19. Unenhanced thin-section axial image of the lungs in a patient with a positive RT-PCR shows bilateral ground glass opacity (GGO) with consolidation, without a specific distribution (non-rounded or non-peripheral) associated with bilateral pleural effusion.
.")
Atypical CT imaging features of COVID-19. Unenhanced thin-section axial image of the lungs in a patient with a positive RT-PCR shows segmental consolidation without ground glass opacity (GGO).
 and bilateral pleural effusion.")
Atypical CT imaging features of COVID-19. Unenhanced thin-section axial image of the lungs in a patient with a positive RT-PCR result shows consolidation without ground glass opacity (GGO) and bilateral pleural effusion.

Atypical CT imaging features of COVID-19. Unenhanced thin-section axial image of the lungs in a patient with a positive RT-PCR shows subsegmental consolidation and reticulation with pleural effusion.
3.4. CT Imaging Setting
All CT images were acquired using a 64-slice multi-slice CT scanner (Brilliance TM64; Philips Medical Systems, Netherlands). The acquisition parameters were as follows: tube voltage: 120 kVp; tube current: 50 - 90 mAs, and slice thickness = 1.4 mm. No contrast materials were used during CT imaging. The images were acquired when the patient was in a supine position, holding breath after an inspiration. The images were acquired with parenchymal (width: 1500 HU; level: -600 HU) and mediastinal (width: 350 HU; level: 40 HU) window settings.
3.5. Statistical Analysis
Categorical variables are presented as number (%) and compared using Fisher’s exact test or Chi-square test. Continuous variables with a normal distribution are described as mean (standard deviation [SD]) and compared using Mann-Whitney U-test, as necessary. A two-sided alpha of less than 0.05 was considered as statistically significant. All statistical analyses were performed in SPSS version 25.0 (SPSS, Chicago, IL, USA).
4. Results
Of 115 patients evaluated in this study, 53 were discharged, and 62 expired (expired group). Of 53 patients who were discharged, 24 required ICU admission, and 29 remained in the respiratory ward. As indicated in Table 1, the mean age of the patients, as an effective factor, was 50.5 and 63.5 years in the ward-admitted and ICU-admitted subgroups, respectively, while it was 67.9 years in the expired group. The mean age of the patients was significantly higher in the expired group as compared to the discharged group (P < 0.0001).
| Discharged (n = 53) | Expired (n = 62) | P-valueb | ||
|---|---|---|---|---|
| Ward admission (n = 29) | ICU admission (n = 24) | |||
| Age, y | 50.5 ± 13.2 | 63.5 ± 10.6 | 67.9 ± 10.3 | < 0.0001 |
| Male gender | 17 (58.6) | 17 (70.8) | 46 (74.2) | 0.24 |
| Smoking status, packs/y | 3.7 ± 5.8 | 5.8 ± 8.6 | 5.7 ± 7.2 | 0.36 |
| History of close contact with a suspected COVID-19 patient | 7 (24.1) | 10 (41.7) | 18 (29.0) | 0.72 |
| Comorbidities | ||||
| Comorbidity | 14 (48.3) | 18 (75) | 49 (79.0) | 0.028 |
| Hypertensive disorder | 7 (24.1) | 12 (50) | 24 (38.7) | 0.75 |
| Ischemic heart disease | 5 (17.2) | 9 (37.5) | 28 (45.2) | 0.037 |
| Diabetes | 3 (10.3) | 13 (54.2) | 25 (40.3) | 0.26 |
| Chronic obstructive pulmonary disease | 2 (6.9) | 7 (29.2) | 12 (19.3) | 0.74 |
| Chronic kidney disease | 1 (3.4) | 3 (12.5) | 7 (11.3) | 0.49 |
| Chronic hepatitis or cirrhosis | 1 (3.4) | 4 (25) | 7 (11.3) | 0.74 |
| Cerebral infarction | 0 (0) | 2 (8.3) | 8 (12.9) | 0.08 |
| Malignancies | 1 (3.4) | 5 (20.8) | 6 (9.6) | 0.77 |
| Acute respiratory distress syndrome | 0 (0) | 19 (79.2) | 60 (96.8) | < 0.0001 |
| Clinical presentations | ||||
| Fever, °C | ||||
| > 37.3 | 23 (79.3) | 24 (100) | 62 (100) | 0.021 |
| 37.3 - 38 | 16 (55.2) | 10 (41.7) | 38 (61.3) | 0.22 |
| 38 - 39 | 6 (20.7) | 10 (41.7) | 14 (22.6) | 0.35 |
| > 39 | 1 (3.4) | 4 (25) | 10 (16.1) | 0.28 |
| Oxygen saturation | 90 ± 1.7 | 85 ± 2.2 | 84 ± 2.4 | 0.001 |
| Cough | 22 (75.9) | 19 (79.2) | 55 (88.7) | 0.10 |
| Dyspnea | 23 (79.3) | 24 (100) | 61 (98.3) | 0.029 |
| Myalgia | 10 (34.5) | 16 (66.7) | 25 (40.3) | 0.35 |
| Anosmia | 7 (24.1) | 9 (37.5) | 10 (16.1) | 0.72 |
| Rhinorrhea | 3 (10.3) | 1 (4.2) | 5 (8.1) | 0.91 |
| Sputum | 6 (20.7) | 6 (25) | 15 (24.2) | 0.26 |
| Sneezing | 0(0) | 1 (4.2) | 1 (1.6) | 0.91 |
| Ageusia/dysgeusia | 2 (6.9) | 0 (0) | 4 (6.4) | 0.51 |
| Diarrhea | 7 (24.1) | 9 (37.5) | 12 (19.3) | 0.17 |
| Vomiting | 7 (24.1) | 5 (20.8) | 10 (16.1) | 0.78 |
| Anorexia | 0 (0) | 2 (8.3) | 2 (3.2) | 0.87 |
| Laboratory findings | ||||
| Leukocyte count, × 109/L | 5.9 ± 3.9 | 7.2 ± 4.2 | 9.2 ± 7.5 | 0.037 |
| ≥ 11 | 2 (6.9) | 9 (37.5) | 28 (45.2) | 0.005 |
| Lymphocyte count, × 109/L | 1.3 ± 1.5 | 1.0 ± 1.1 | 0.7 ± 0.6 | 0.032 |
| < 1.0 | 5 (17.2) | 16 (66.7) | 53 (85.5) | < 0.0001 |
| Platelet count, × 109/L | 156.3 ± 31.9 | 168.5 ± 43.7 | 166.8 ± 64.2 | 0.53 |
| ≥ 450 | 0 (0) | 4 (16.7) | 8 (12.9) | 0.82 |
| CRP, mg/L | 35.8 ± 18.8 | 70.9 ± 29.6 | 66.8 ± 22.6 | 0.002 |
| D-dimer, mg/L | 2.8 ± 0.3 | 4.4 ± 0.6 | 5.0 ± 1.1 | < 0.0001 |
| Lactate dehydrogenase, U/L | 293 ± 31.3 | 316 ± 36.6 | 317.9 ± 50.2 | 0.39 |
Demographic, Clinical, and Laboratory Data of COVID-19 Patients Upon Hospitalizationa
As shown in Table 1, 48.3% and 75% of cases in the ward-admitted and ICU-admitted subgroups had at least one comorbidity, respectively, while this rate for the expired group was 79.0% (P = 0.028). The prevalence of ischemic heart disease (P = 0.037) and acute respiratory distress syndrome (P < 0.0001) was markedly high in the expired group. As shown in Table 1, a comprehensive list of clinical presentations was evaluated for the patients in this study. Fever, as one of the major COVID-19 manifestations, was observed in 79.3% and 100% of patients in the ward-admitted and ICU-admitted subgroups, respectively. Also, in all expired patients, fever was dominant, suggesting a significant difference between the two main study groups (P = 0.021).
Oxygen saturation level, as an indicative factor for prognosis, was significantly lower in the expired group (P = 0.001). It was measured to be 90±1.7 and 85±2.2 in the ward-admitted and ICU-admitted subgroups, respectively, while it was 84±2.4 in the expired group. Dyspnea, as another major COVID-19 manifestation, was markedly more prevalent in the expired group as compared to the other groups (P = 0.029). As shown in Table 1, among different laboratory features, the mean leukocyte count was reported to be 5.9× 10⁹/L and 7.2× 10⁹/L in the ward-admitted and ICU-admitted patients, respectively, whereas the mean count was 9.2× 10⁹/L in the expired group, underlining a significant difference between the groups (P = 0.037).
Considering a cutoff WBC count of 11× 109/L for leukocytosis, a significantly larger number of expired patients, compared to the other groups, had WBC counts above the cutoff point (P = 0.005). On the other hand, the mean lymphocyte count was significantly lower in the expired group. The mean lymphocyte count was 1.3× 10⁹/L and 1.0× 10⁹/L in the ward-admitted and ICU-admitted subgroups, respectively, while it was 0.7× 10⁹/L in the expired group (P = 0.032). Also, in a significantly larger number of expired patients, compared to the other groups, WBC counts lower than the lymphopenia cutoff point (1.0× 10⁹/L) were obtained (P < 0.0001).
C-reactive protein (CRP), as another paraclinical finding, was found to be significantly higher in the expired group. The mean CRP levels were 35.8 mg/L and 70.9 mg/L in the ward-admitted and ICU-admitted subgroups, whereas it was 66.8 mg/L in the expired group, highlighting a significant difference between the two main study groups (P = 0.002). The average D-dimer level was also shown to be significantly higher in the expired group. The mean D-dimer level was 2.8 mg/L and 4.4 mg/L in the ward-admitted and ICU-admitted subgroups, respectively, while it was 5.0 mg/L in the expired group (P < 0.0001). However, platelet count and lactate dehydrogenase level did not show a significant difference between the two groups (P = 0.53).
The radiological findings of the patients in our study are presented in Table 2. The average time from the symptom onset until CT imaging was significantly longer in the expired group; this time interval was 5.6 and 6.8 days for the ward-admitted and ICU-admitted subgroups, respectively, while it was 9.8 days for the expired group (P < 0.001). Based on the standard RSNA reporting protocols, typical findings were markedly more prevalent in the expired group. Reportedly, 44.8% and 70.8% of cases in the ward-admitted and ICU-admitted subgroups had typical findings, respectively, while the corresponding rate was 77.4% in the expired group (P = 0.017). Negative findings were only reported in the discharged group, meaning that 10.3% and 8.3% of ward-admitted and ICU-admitted patients had negative findings, respectively, while none of the expired patients had negative results (P = 0.018).
| Discharged | Expired (n = 62) | P-valueb | ||
|---|---|---|---|---|
| Ward admission (n = 29) | ICU admission (n = 24) | |||
| Symptom onset before CT imaging | 5.6 ± 2.4 | 6.8 ± 2.7 | 9.8 ± 3.8 | < 0.001 |
| RSNA standard reporting | ||||
| Typical | 13 (44.8) | 17 (70.8) | 48 (77.4) | 0.017 |
| Intermediate | 8 (27.6) | 3 (12.5) | 10 (16.1) | 0.52 |
| Atypical | 5 (17.2) | 2 (8.3) | 4 (6.4) | 0.21 |
| Negative | 3 (10.3) | 2 (8.3) | 0 (0) | 0.018 |
| Involved lobes | 2.1 ± 1.4 | 2.7 ± 1.2 | 3.2 ± 2.4 | 0.032 |
| 0 - 1 | 9 (31.0) | 3 (12.5) | 6 (9.7) | 0.56 |
| 2 - 3 | 16 (55.2) | 16 (66.7) | 28 (45.2) | 0.10 |
| 4 - 5 | 4 (13.8) | 5 (20.8) | 28 (45.2) | 0.001 |
| Lobar involvement | ||||
| Right upper | 19 (65.5) | 18 (75) | 62 (100) | < 0.0001 |
| Right middle | 14 (48.3) | 16 (66.7) | 46 (74.2) | 0.047 |
| Right lower | 21 (72.4) | 22 (83.3) | 42 (67.7) | 0.10 |
| Left upper | 23 (79.3) | 21 (87.5) | 50 (80.6) | 0.61 |
| Left lower | 25 (86.2) | 23 (95.8) | 51 (82.2) | 0.19 |
| Involved segments | 8.1 ± 5.7 | 12.1 ± 5.0 | 12.7 ± 5.8 | 0.010 |
| < 10 | 18 (62.1) | 9 (37.5) | 20 (32.2) | 0.042 |
| 10 - 15 | 7 (24.1) | 6 (25) | 19 (30.6) | 0.46 |
| > 15 | 4 (13.8) | 9 (37.5) | 23 (37.1) | 0.14 |
| Anatomic side involvement | ||||
| Unilateral | 8 (27.6) | 4 (16.7) | 2 (3.2) | 0.001 |
| Bilateral | 21 (72.4) | 20 (83.3) | 60 (96.8) | 0.001 |
| Predominant distribution pattern | ||||
| Peripheral | 25 (86.2) | 24 (100) | 62 (100) | 0.11 |
| Central | 17 (58.6) | 22 (91.7) | 55 (88.7) | 0.036 |
| Ground glass opacification (GGO), > 50% | 11 (37.9) | 14 (58.3) | 35 (56.4) | 0.32 |
| Consolidation, > 50% | 12 (41.4) | 8 (33.3) | 21 (33.9) | 0.66 |
| Mixed GGO and consolidation | 6 (20.7) | 2 (8.3) | 6 (9.7) | 0.37 |
| Subpleural reticulation | 7 (24.1) | 10 (41.7) | 16 (25.8) | 0.45 |
| Crazy paving pattern | 3 (10.3) | 6 (25) | 7 (11.3) | 0.37 |
| Reverse halo | 4 (15.4) | 6 (25) | 19 (30.1) | 0.14 |
| Air bronchogram | 8 (27.6) | 11 (8.8) | 39 (62.9) | 0.038 |
| Pleural effusion | ||||
| Unilateral | 3 (10.3) | 7 (29.2) | 22 (35.5) | 0.047 |
| Mild | 1 (3.4) | 1 (4.2) | 5 (8.1) | 0.34 |
| Moderate | 2 (6.9) | 5 (20.8) | 6 (9.7) | 0.55 |
| Severe | 0 (0) | 1 (4.2) | 11 (17.7) | 0.005 |
| Bilateral | 1 (3.4) | 1 (4.2) | 2 (3.2) | 0.87 |
Comparison of Radiological Findings Between Discharged and Expired Groupsa
For evaluating the lung lobes, the mean number of involved lobes was 2.1 and 2.7 in the ward-admitted and ICU-admitted subgroups, respectively, while it was 3.2 in the expired group; therefore, there was a significant difference between the two main groups (P = 0.032). The involvement of 4 - 5 lobes was specially more common in the expired group (P = 0.001). Comparison of lobar involvement showed some significantly different results between the two groups; the right upper lobe was reported to be involved in 65.5% and 75% of cases in the ward-admitted and ICU-admitted subgroups, respectively, while all cases in the expired group showed the right upper lobe involvement (P < 0.0001). Also, the right middle lobe was involved more commonly in the expired group (P = 0.047).
It should be noted that the mean number of involved lung segments, similar to the frequency of lobar involvement, significantly increased in the expired group (P = 0.010). Moreover, involvement of less than ten segments was markedly less common in the expired group; reportedly, 62.1% and 37.5% of ward-admitted and ICU-admitted patients had < 10 segments involved, respectively, while 32.2% of expired cases had < 10 segment involvement (P = 0.042). The prevalence of segmental involvement did not show a significant difference between the ward-admitted and ICU-admitted subgroups (10 - 15 and > 15 segments involved with P = 0.46 and P = 0.14, respectively).
According to Figures 9 and 10, as the time gap between the onset of symptoms and the first imaging day increased, the involvement of lobes and related segments increased, as well; this was significantly associated with the increased risk of mortality in our patients. Regarding bilateral involvement, the results revealed that unilateral involvement was significantly less frequent in the expired group (P = 0.001). On the contrary, bilateral involvement was significantly more frequent in the expired group (96.8%) (P = 0.001). As shown in Table 2, concerning the distribution patterns, central distribution was significantly predominant in the expired group (P = 0.036). However, the peripheral distribution pattern was not significantly different between the two groups (P = 0.11).

Relationship between lobar involvement and onset of symptoms in discharged and expired groups. The number of involved lobes increased in both groups as the interval between the onset of symptoms and CT imaging increased. The trend of increase was almost similar between the two main study groups; however, a certain number of involved lobes were detected slightly earlier in the discharged group compared to the expired group. Therefore, patients, whose lobar pathological findings are detected sooner by CT imaging, may have a lower risk of mortality.

Relationship between segmental involvement and onset of symptoms in discharged and expired groups. The number of involved segments increased in both groups as the interval between the symptom onset and CT imaging increased; the trend of increase was almost similar between the two main study groups. However, a certain number of involved segments were detected considerably earlier in the discharged group, compared to the expired group. Therefore, patients, whose segmental pathological findings are detected sooner by CT imaging, may face a lower risk of mortality.
Evaluation of GGO and consolidation, once independently and once combined, was conducted in the present study; however, the results of statistical analyses revealed no significant difference between the two main study groups (P = 0.32 and P = 0.37, respectively). As shown in Table 2, air bronchogram was markedly more prevalent in the expired group (P = 0.038). In contrast, assessment of other specific radiological findings, including subpleural reticulation (P = 0.45), crazy paving pattern (P = 0.37), and reverse halo (P = 0.14), did not yield any significant differences; nonetheless, the prevalence of crazy paving pattern and reversed halo sign increased as the clinical status of the patient deteriorated. Statistical analysis of pleural effusion showed that unilateral pleural effusion was significantly more common in the expired group (P = 0.047). The severe form of unilateral pleural effusion was also significantly more common in the expired group; none of the ward-admitted cases and 4.2% of ICU-admitted patients showed severe unilateral effusion, while 17.7% of expired cases showed severe unilateral effusion (P = 0.005).
5. Discussion
Before the emergence of COVID-19 pandemic caused by SARS-CoV-2, outbreaks caused by two other betacoronaviruses were reported in 2002 (SARS-CoV-1) and 2012 (MERS-CoV), with high fatality rates of 10% and 37%, respectively (13). While the COVID-19 fatality rate is far lower than that of MERS-CoV and SARS-CoV-1 infections (14), COVID-19 pneumonia poses a major threat to public health because of its rapid propagation and high incidence (15, 16). In line with recent evidence, our findings showed that SARS-CoV-2 tends to infect the elderly with chronic comorbidities due to their weaker immune functions (17-19). Consistently, 79% (49/62) of expired patients in our study had at least one comorbidity (20). Moreover, in our study, leukocytosis (≥ 11 × 109/L) was detected in 33.9% (39/115) of the patients. The concentrations of CRP and D-dimer also increased in most patients; this finding is consistent with the data related to previous betacoronavirus infections (18, 21, 22). Decreased levels of lymphocytes, which were found to be significantly more common in the expired group, have been also reported as a possible independent prognostic factor for fatality in COVID-19 patients (18, 20).
Considering the availability and high sensitivity of chest CT imaging, this method is commonly used to detect and diagnose COVID-19 patients (23). In our study, the initial chest CT scan did not reveal any lesions suggesting a viral infection in five out of 115 patients, based on the RSNA reporting protocols, while the CT findings of the remaining 110 patients showed that most cases presented with bilateral lung involvement; they were peripherally located lesions in most cases. The cardinal pattern of affected lungs was also GGO, with air bronchograms and indistinct margins (24). Preeminently, 67.8% (78/115) of the patients were classified in the typical RSNA category. These imaging characteristics were non-specific and somehow resembled the radiological features of MERS-CoV and SARS-CoV-1 infections (25, 26).
SARS-CoV-1 commonly manifests as a unilateral single lesion involvement and septal thickness within the following 10 - 20 days (26); these manifestations are more common in severe cases of H1N1 influenza pneumonia (27). It is worth mentioning that consolidations, large distributions, air bronchogram, and multiple lobe involvement were more frequent in the expired group, suggesting a pathological association with diffuse alveolar impairment and a more serious clinical course (24, 28). Also, these radiological changes may be correlated with the collapse of the alveolar wall, sending exudates into the alveoli or by-products of other epithelial cells in pulmonary diseases (29). Critically ill patients also showed lesions with central patterns, besides peripheral subpleural involvement. These findings possibly support the higher prevalence of alveolar impairment in ICU-admitted and expired patients, besides the increased incidence of organized viral infection patterns and pneumonia in discharged cases who were routinely admitted to the hospital wards.
We observed that if a lobe is involved, almost all related segments are affected non-distinguishably, probably due to the small compact size of virions, which tend to collect and deposit into the lobules of the lungs, impair the epithelium of alveoli, and involve other nearby lobules (30). In our study, chest CT scans indicated the low incidence of central lesions; however, high peripheral densities, such as halo sign patterns, were present in some COVID-19 patients, which is not a specific imaging feature and can be also seen in cryptococcosis, paracoccidioidomycosis, pneumocystis pneumonia, and tuberculosis (31). Also, some other patients showed crazy paving patterns and a discernible vascular wall thickness (32).
A reticulation pattern related to bronchiectasis, besides irregular thickness of interlobular spaces, also increased in severely ill ICU-admitted and expired patients. This characteristic possibly shows the emergence of interstitial irregularities, underlining progression to fibrosis (33). However, since the detailed pathophysiology of COVID-19 pneumonia has not been completely determined, it is too soon to consider the mentioned findings as irreversible or unrepairable fibrosis. Moreover, in ICU-admitted and expired patients, the incidence of pleural effusion, particularly with a unilateral pattern, was significantly higher. This unspecific finding has been also reported in some other studies at different prevalence rates (34).
Similar to our finding that pleural effusion was more common in expired COVID-19 patients, another study reported that pleural effusion and pneumothorax were more frequent in non-surviving patients with MERS-CoV infection (35). In the future, large-scale studies, systematic reviews, and prolonged follow-ups are needed to assess the prognostic factors, based on primary chest CT scan findings, which are significantly associated with ICU admission and mortality due to COVID-19. Also, chest CT findings can improve the screening of highly susceptible patients with an influenza-like illness during the pandemic, as appropriate (36).
The present study had some limitations. First, since a large number of patients did not have a definite final clinical status during the study, the mortality rate could not be estimated in the patients. Second, due to the limited number of patients included in this study, the results of chest CT scans may be different from the results of COVID-19 patients. Finally, since the biopsy specimens of the lungs were not available during the study, the relationship between histopathological and imaging findings was not investigated. Therefore, other possible etiologies of GGO, considering edema or pulmonary hemorrhage, could not be evaluated.
In conclusion, the increased number of involved lung lobes and segments, bilateral and central distribution patterns, air bronchogram, and severe pleural effusion in the initial chest CT scan can be related to the increased severity and poor prognosis of COVID-19.
