


1. Background
During late December 2019, there was an outbreak of pneumonia caused by a novel zoonotic coronavirus in Wuhan (Hubei Province, China). This virus rapidly spread to other parts of China and then throughout the world, causing a serious public health problem (1). The World Health Organization (WHO) officially named this disease “coronavirus disease 2019” (COVID-19) on February 11, 2020 (2). COVID-19 is a serious pulmonary disease caused by infection with severe acute respiratory syndrome coronavirus 2 virus (SARS-CoV-2). Patients may also experience digestive, circulatory, neurological, and other systemic damages (3), and SARS-CoV-2 has efficient human-to-human transmission.
Early and accurate diagnosis is important because it allows timely isolation and treatment of patients. However, the timing of the COVID-19 outbreak (late winter and early-spring in China) is similar to that of community-acquired pneumonia (CAP) caused by other pathogens. More specifically, Mycoplasma Pneumonia (MP, caused by Mycoplasma pneumoniae) accounts for 20.7% of all adult cases of CAP in China (4) and 22.9% of all adult outpatient cases with CAP in Asia (5). Early diagnosis of MP is hampered by non-specific symptoms and the lack of rapid responding laboratory measures. Moreover, MP may often aggregate within families, which complicate the early differential diagnosis with COVID-19 pneumonia.
Chest computed tomography (CT), especially high-resolution CT, plays a significant role to detect the distribution, density and morphology of lesions caused by either COVID-19 or MP (6, 7). To our knowledge, there have been no report focusing on the differences between COVID-19 and MP.
2. Objectives
We summarized the initial clinical manifestations, laboratory results and chest CT findings of a series of patients infected with COVID-19 and MP from COVID-19 epidemic areas to identify the value of chest CT in the differential diagnosis of these two diseases in early stage.
3. Patients and Methods
3.1. Patients
This retrospective case-control study consisted of group of cases infected with COVID-19 (COVID-19 group) and controls infected with MP (MP group). Records for patients diagnosed with COVID-19 pneumonia and MP were reviewed retrospectively for the period from 20 January to 28 February 2020 in three hospitals in Jining city, Shandong Province, China. All of the three hospitals were located in areas of COVID-19 epidemic. The diagnostic criteria for COVID-19 were established by the National Health Commission of the People’s Republic of China (diagnostic guideline for COVID-19, trial version 7) (7). The diagnostic criteria for MP were established by Chinese society of respiratory diseases (8).
Inclusion criteria for COVID-19 group were: (1) First-presented adult outpatients; (2) the RT-PCR results of throat swabs or sputum were positive for SARS-CoV-2.
Inclusion criteria for MP group were: (1) First-presented adult outpatients; (2) serologic tests demonstrated a positive specific IgM of MP, or a four-fold or greater increase in specific serum antibody of MP for at least 2 weeks after presentation (8).
Exclusion criteria for both groups were: (1) Cases who were confirmed to have mixed infections; (2) patients who were taking antibiotics or antivirals prior to presentation; (3) cases with normal CT findings; (4) cases with incomplete clinical or chest CT image data.
The research ethics board at each participating hospital approved the study. Informed consent for this retrospective study was waived.
3.2. Examinations
All patients of both groups underwent laboratory tests and chest CT examinations at the initial presentation. Laboratory tests included routine blood parameters, and measurements of C-reactive protein (CRP), erythrocyte sedimentation rate (ESR), and procalcitonin. Three CT scanners were used for imaging (uCT 760, United Imaging, China; GE Bright Speed, U.S.; GE Revolution HD, U.S.). In all cases, the tube voltage was 100 to 120 kV, tube current was 120 to 200 mA (with or without automatic tube current modulation), slice thickness was 5 mm, and pitch was 1.0875 to 1.375. All CT images were reconstructed at slice thicknesses of 1.25 mm and reviewed independently by two cardiothoracic radiologists (10 and 15 years of experience).
3.3. Clinical Indicators
The initial clinical manifestations, laboratory results, and chest CT findings of the two groups were compared. The clinical manifestations were the onset symptoms, such as fever, cough, pharyngalgia, dizziness, headache, nausea, vomiting, abdominal pain, diarrhea, muscle ache, and fatigue. The laboratory results were leukocyte count, lymphocyte count, and levels of CRP, ESR, and procalcitonin. The following features of the chest CT were examined: the distribution, density and morphology (e.g. consolidation, ground glass opacities, and centrilobular nodules), internal structure of lesions (e.g. “crazy-paving” patterns and air bronchogram signs), the presence of generalized bronchial wall thickening with luminal stenosis, bronchial mucus impaction (only large airways with diameter of more than 2 mm), and the presence of pleural effusion or mediastinal lymphadenopathy.
3.4. Statistical Analysis
All statistical analyses were performed using SPSS software (version 20.0, IBM Corp., Armonk, NY). Categorical variables of the two groups were reported as counts and percentages, and were compared using Pearson’s chi-square test, the continuity corrected chi-square test, Fisher’s exact probability test, or the Mann-Whitney U-test. The diagnostic efficacy of the clinical and CT parameters was analyzed using a logistic regression equation with receiver operating characteristic (ROC) curve analysis. A P value below 0.05 was considered significant.
4. Results
4.1. Patient Information
According to the inclusion criteria, a total of fifty patients infected with COVID-19 and sixty-two patients infected with MP were screened out. Based on exclusion criteria, patients with co-infection of bacteria (n = 1), normal CT findings (n = 3), or incomplete clinical data (n = 1) were excluded from COVID-19 group, and patients with co-infection of bacteria (n = 2), prior antibiotic treatment (n = 2), normal CT findings (n = 2), or incomplete clinical data (n = 1) were excluded from MP group. Finally, there were 45 adult patients infected with COVID-19 (16 women, 29 men; mean age: 42.71 ± 13.65 years) and 55 patients infected with MP (32 women, 23 men; mean age: 36.47 ± 13.40 years) were enrolled in present study.
Of the 45 patients with COVID-19 infection, two cases had diabetes, two had hypertension, and one had chronic obstructive pulmonary disease. The median time from the onset of symptoms to presentation was 3 days (interquartile range [IQR]: 1 to 6).
Of the 55 patients with MP infection, two cases had diabetes, one case had hypertension, and one case had chronic liver disease. The median time from the onset of symptoms to presentation was 4 days (IQR: 2 to 7).
4.2. Clinical Symptoms
A comparison of symptoms of patients in the two groups indicated muscle aches and fatigue were more common in the COVID-19 group (P = 0.009 and 0.029, respectively), but the two groups had no significant differences in the prevalence of fever, cough, pharyngalgia, dizziness/headache, nausea/vomiting, and diarrhea/abdominal pain (P = 0.505, 0.837, 0.776, 0.888, 0.752, and 0.200, respectively) (Table 1).
| Symptom | COVID-19 (N = 45), No. (%) | MP (N = 55), No. (%) | χ2 | P |
|---|---|---|---|---|
| Fever | 40 (88.89) | 52 (94.55) | 0.45 | 0.505a |
| Cough | 29 (64.44) | 34 (61.82) | 0.07 | 0.837b |
| Pharyngalgia | 7 (15.56) | 7 (12.73) | 0.16 | 0.776b |
| Dizziness/headache | 7 (15.56) | 8 (14.55) | 0.02 | 0.888b |
| Nausea/vomiting | 5 (11.11) | 4 (7.27) | 0.10 | 0.752a |
| Diarrhea/abdominal pain | 2 (4.44) | 0 (0.00) | - | 0.200c |
| Muscle ache | 13 (28.89) | 4 (7.27) | 6.74 | 0.009a |
| Fatigue | 10 (22.22) | 3 (5.45) | 4.76 | 0.029a |
Abbreviations: COVID-19, coronavirus disease 2019; MP, Mycoplasma Pneumonia.
aData were analyzed using continuity corrected chi-square test.
bData were analyzed using Pearson’s chi-square test.
cData were analyzed using Fisher’s exact probability test.
4.3. Laboratory Results
A comparison of laboratory results of patients in the two groups indicated that more patients in the MP group had increased procalcitonin levels (P = 0.001), but the two groups had no significant differences in the percentages of patients with abnormal leukocyte count, lymphocyte count, CRP level, and ESR level (P = 0.177, 0.166, 0.641, and 0.489, respectively) (Table 2).
| Laboratory Results | COVID-19 Group (N = 45), No. (%) | MP Group (N = 55), No. (%) | Z/χ2 | P |
|---|---|---|---|---|
| Leukocyte count | -1.36 | 0.177a | ||
| Increased | 3 (6.67) | 14 (25.45) | ||
| Normal | 38 (84.44) | 38 (69.09) | ||
| Decreased | 4 (8.89) | 3 (5.46) | ||
| Lymphocyte count | 2.28 | 0.166b | ||
| Normal | 37 (82.22) | 38 (69.09) | ||
| Decreased | 8 (17.78) | 17 (30.91) | ||
| CRP | 0.32 | 0.641b | ||
| Elevated | 33 (73.33) | 43 (78.18) | ||
| Normal | 12 (26.67) | 12 (21.82) | ||
| ESR | 0.66 | 0.489b | ||
| Elevated | 32 (71.11) | 43 (78.18) | ||
| Normal | 13 (28.89) | 12 (21.82) | ||
| Procalcitonin | 11.26 | 0.001b | ||
| Elevated | 7 (15.56) | 26 (47.27) | ||
| Normal | 38 (84.44) | 29 (52.73) |
Abbreviations: CRP, C-reactive protein; COVID-19, coronavirus disease 2019; ESR, erythrocyte sedimentation rate; MP, Mycoplasma Pneumonia.
aData were analyzed using Mann-Whitney U-test.
bData were analyzed using Pearson’s chi-square test.
4.4. Chest CT Findings
Analysis of the distribution of lung lesions indicated that bilateral lung involvement was more common in the COVID-19 group (P < 0.001), and that single lobe involvement was more common in the MP group (P < 0.001). However, there was no significant difference between the two groups in the incidence of unilateral multi-lobe involvement (P = 0.180) (Table 3).
| Infected Lung Lobe/Finding | COVID-19 Group (N = 45), No. (%) | MP Group (N = 55), No. (%) | χ2 | P |
|---|---|---|---|---|
| Distribution of lung lesions | ||||
| Both lungs | 31 (68.89) | 8 (14.55) | 30.72 | < 0.001a |
| Unilateral multi-lobe | 2 (4.44) | 8 (14.55) | 1.80 | 0.180b |
| Single lobe | 12 (26.67) | 39 (70.91) | 19.39 | < 0.001a |
| CT characteristics | ||||
| Ground glass opacities | 40 (88.89) | 18 (32.73) | 32.05 | < 0.001a |
| Pulmonary consolidations | 12 (26.67) | 42 (76.36) | 24.61 | < 0.001a |
| Centrilobular nodules | 7 (15.56) | 39 (70.91) | 30.53 | < 0.001a |
| Crazy-paving patterns | 20 (44.44) | 2 (3.64) | 21.70 | < 0.001b |
| Air bronchogram signs | 17 (37.78) | 6 (10.91) | 10.09 | < 0.001a |
| Bronchial wall thickening | 1 (2.22) | 38 (69.10) | 43.75 | < 0.001b |
| Bronchial mucus impaction | 0 (0) | 36 (65.45) | - | < 0.001c |
| Pleural effusion | 4 (8.89) | 2 (3.64) | 0.46 | 0.498b |
| Mediastinal lymphadenopathy | 1 (2.22) | 2 (3.64) | 0.00 | 1.000b |
Abbreviations: CT, computed tomography; COVID-19, coronavirus disease 2019; MP, Mycoplasma Pneumonia.
aData were analyzed using Pearson’s chi-square test.
bData were analyzed using continuity corrected chi-square test.
cData were analyzed using Fisher’s exact probability test.
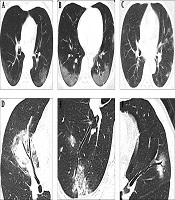
Analysis of lung lesions indicated that COVID-19 was typically characterized by involvement of subpleural areas (41/45, 91.11%), that appeared as band-shaped, round, or nodular ground glass opacities (Figure 1). In contrast, MP was typically characterized by lesions distributed along the bronchi (46/55, 83.64%), that appeared as patchy opacities with a radial distribution from the hilum to the periphery of the lung (Figure 2).

Typical chest CT images of patients with COVID-19. A, A 43-year-old woman who presented with fever and cough for 2 days. The CT image shows subpleural ground glass opacities parallel to the pleura in bilateral lower lobes; B, A 31-year-old women who presented with fever for 5 days. The CT image shows subpleural ground glass opacities combined with "crazy-paving" patterns parallel to the pleura in bilateral lower lobes; C, A 36-year-old woman who presented with fever for 3 days. The CT image demonstrates multiple centrilobular ground glass opacities scattered in the subpleural lung regions; D, A 36-year-old woman who presented with fever for 3 days. The CT image shows pulmonary consolidation in the middle lobe of the right lung with slight thickening of the involved airway wall, but the bronchial mucosa appeared smooth, and no generalized bronchial stenosis noted; E, A 42-year-old man who presented with cough for 3 days. The CT image shows subpleural ground glass opacities in the right lower lobe without generalized bronchial wall thickening; F, A 27-year-old woman who presented with fever for 4 days. The CT image shows ground glass opacity in the upper lobe of the left lung with slight bronchiectasis in the opacity.

Typical chest CT images of patients with Mycoplasma pneumonia. A, A 33-year-old man who presented with fever for 5 days. The CT image shows the “tree-in-bud” sign and centrilobular nodules distributed along the bronchus with generalized bronchial wall thickening in the left lower lobe; B, A 30-year-old woman who presented with fever for 3 days. The CT image shows radial pulmonary consolidations from the hilus to the periphery in the upper lobe of the right lung, with generalized thickening of the bronchial wall and the formation of bronchial mucus impaction; C and D, A 26-year-old man who presented with fever and pharyngalgia for 5 days. The CT images show patchy ground glass opacities in the left lower lobe of the lung, with generalized thickening of the bronchial wall and the formation of bronchial mucus plugs; E, A 45-year-old man who presented with fever and cough for 4 days. The CT image shows radial pulmonary consolidations in the upper lobe of the right lung, with generalized thickening of the bronchial wall and the formation of bronchial mucus impaction; F, A 27-year-old woman who presented with fever for 2 days. The CT images show centrilobular nodules in the left lower lobe, with generalized thickening of the bronchial wall and the formation of bronchial mucus plugs.
Analysis of the different types of CT abnormalities indicated that ground glass opacities, “crazy-paving” patterns, and air bronchogram signs were more common in the COVID-19 group (P < 0.001 for all). The proportions of pulmonary consolidations, centrilobular nodules, generalized bronchial wall thickening with luminal stenosis, and bronchial mucus impaction were more common in the MP group (P < 0.001 for all). However, the two groups had no significant difference in the incidence of pleural effusion and mediastinal lymphadenopathy (P = 0.498, 1.000) (Table 3).
Twelve parameters with statistical differences in single factor analysis, including symptoms, laboratory results and chest CT findings, were analyzed by using logistic regression analysis, and only 4 CT parameters were screened out as independent variables that could be used to differentiate COVID-19 from MP. They were bilateral lung involvement (X1), ground glass opacity (X2), centrilobular nodules (X3), and generalized bronchial wall thickening (X4) (Table 4). We used these data to develop a logistic regression equation (CT model) for the differential diagnosis of COVID-19 and MP:
P = 1/[1+e-(-0.703+2.392X1+1.714X2-2.011X3-3.582X4)]
| Parameter | Logistic Regression Equation | ROC Curves | ||||||
|---|---|---|---|---|---|---|---|---|
| B | SE | P | OR (95% CI) | AUC (95% CI) | Sensitivity, % | Specificity, % | Accuracy, % | |
| Bilateral lung involvement (X1) | 2.392 | 0.805 | 0.003 | 10.936 (2.256, 52.022) | 0.783 (0.687, 0.878) | 71.1 | 85.5 | 79.0 |
| Ground glass opacities (X2) | 1.714 | 0.814 | 0.035 | 5.550 (1.126, 27.351) | 0.781 (0.688, 0.874) | 88.9 | 67.3 | 77.0 |
| Centrilobular nodules (X3) | -2.011 | 0.832 | 0.016 | 0.134 (0.026, 0.684) | 0.777 (0.683, 0.871) | 84.4 | 70.9 | 77.0 |
| Bronchial wall thickening (X4) | -3.582 | 1.217 | 0.003 | 0.028 (0.003, 0.302) | 0.834 (0.752, 0.916) | 97.8 | 69.1 | 82.0 |
| Constant term | -0.703 | 0.708 | 0.321 | 0.495 | ||||
Abbreviations: AUC, area under the curve; B, partial regression coefficient; CI, confidence interval; COVID-19, coronavirus disease 2019; CT, computed tomography; MP, Mycoplasma Pneumonia; ROC, receiver operating characteristic; OR, odds ratio; SE, standard error; X, parameter of CT.
where P is prediction value and e is the natural logarithm. This CT model had a predicted diagnostic value of 0.393. When the value was greater than 0.393, COVID-19 was more likely to be diagnosed than MP.
We also performed receiver operating characteristic (ROC) analysis using each individual parameter and all 4 parameters together with the CT model (Figure 3). The area under the curve (AUC) of each single CT parameter was less than the AUC of the CT model, although generalized bronchial wall thickening had the largest AUC among individual parameters. The CT model had good or excellent sensitivity (93.3%), specificity (89.1%), accuracy (90.0%), positive predictive value (89.5%), and negative predictive value (93.0%). Overall, the CT model had excellent diagnostic performance (AUC = 0.951, 95% CI: 0.908 to 0.995).
 curves based on individual CT parameters and a CT model that considered all four CT parameters together.")
Receiver operating characteristic (ROC) curves based on individual CT parameters and a CT model that considered all four CT parameters together.
5. Discussion
Previous studies of COVID-19 and MP indicated there are many similarities in the initial clinical manifestations of these two diseases (9, 10). This present study indicated that most patients of both groups presented with fever and cough, and smaller numbers complained of muscle aches and fatigue. Notably, the incidence of muscle aches and fatigue was greater in the COVID-19 group, a finding that may be useful in the differential diagnosis of these diseases.
The laboratory results of patients in the two groups were similar, in that most patients had normal leukocyte and lymphocyte counts, slightly to moderately elevated CRP levels, and slightly increased ESR, thus indicating limited value of these parameters in the differential diagnosis. However, nearly half of the patients with MP had a high level of procalcitonin, and this level was normal in most patients with COVID-19, suggesting that procalcitonin level may be used to distinguish these diseases. Overall, the clinical features and laboratory results of patients with COVID-19 and MP were similar, and none of the measured parameters could be used for definitive differential diagnosis.
Our chest CT results indicated that the proportion of patients with bilateral involvement was greater for those with COVID-19, but the proportion of patients with single lobe involvement was greater for those with MP. These results are consistent with previous studies (11, 12). Previous studies of COVID-19 indicated that the main pathological manifestations in patients with early-stage disease were interstitial edema, vascular congestion and infiltration of inflammatory cells, and prominent proteinaceous exudates (13). As COVID-19 progresses, the pathological features include acute-phase diffuse alveolar damage, degeneration of alveolar epithelial cells (necrosis or apoptosis), and ultimately pulmonary consolidation and focal fibrosis (14). Most chest CT images of patients with newly diagnosed COVID-19 appear as bilateral subpleural ground glass opacities, often accompanied by “crazy-paving” patterns and air bronchogram signs; pulmonary consolidations, significant generalized thickening of the large airways, and intraluminal bronchus mucus impaction are rare.
Our COVID-19 group had one elderly male patient with chronic obstructive pulmonary disease (COPD) whose chest CT indicated generalized bronchial wall thickening in and surrounding the affected areas, possibly due to COPD or chronic inflammation. The COVID-19 guideline (trial version 7) description of the pathological characteristics of this condition indicates that part of the epithelium of involved bronchial mucosa have a shedding appearance and the formation of mucous plugs (7). In addition, an autopsy study of a patient with severe COVID-19 found a large amount of viscous secretions overflowed from the alveoli of the affected section of the lung, and a jelly-like mucus in the bronchi (15). However, we observed no bronchial mucus impaction in the CT images of our 45 COVID-19 patients. This may be because all of our COVID-19 patients had mild or common disease, rather than severe or fatal disease, and because we only evaluated the large airways (diameter greater than 2 mm). COVID-19 is mainly characterized by deep airway and alveolar damage (15), and subsequent airway mucus plugs might be formed mostly at the small airways.
In contrast to our chest CT images of COVID-19 patients, most of our images of newly diagnosed MP patients had pulmonary consolidations or centrilobular nodules, usually accompanied by generalized bronchial wall thickening and bronchial mucus impaction, similar to previous results (16). After Mycoplasma Pneumoniae invades the lungs, there is typically congestion of the bronchial mucosa and surrounding interstitial region, edema, and infiltration of polymorphonuclear macrovesicles, and these can lead to alveolar serous exudative inflammation (17). Therefore, the chest CT images of most of our MP patients indicated radial infiltration distributed from the hilar to the peripheral areas of lung parenchyma, and most also had wall thickening of the large airways, generalized narrowing of the bronchial lumen, and the formation of mucus plugs.
We identified four independent CT parameters that were valuable for differentiating COVID-19 and MP. Bilateral lung involvement and ground glass opacity are valuable for the diagnosis of COVID-19; centrilobular nodules and generalized bronchial wall thickening are valuable for the diagnosis of MP. A mathematical model established based on these CT parameters had excellent performance in the differential diagnosis of these two diseases.
According to our findings, most patients with COVID-19 had as bilateral subpleural ground glass opacities, most of which were close or parallel to the pleura, “crazy-paving” patterns, and air bronchogram signs might be found in the opacities. CT results indicating the presence of radially segmental distributed multifocal patchy consolidations or central lobular nodules, combined with generalized bronchial wall thickening with luminal narrowing, and formation of mucus plugs are not support the diagnosis of COVID-19. Recognition of the key CT findings of these two diseases can decrease the misdiagnosis and overdiagnosis of COVID-19, and provide important reference for early detection, observation, and disease evaluation.
There are several limitations in our study. First, the sample size was relatively small, thus limiting the strength of our statistical analyses. Second, as a cross-sectional study, all patients in both groups were newly diagnosed, and follow-up data were not analyzed. Third, all the patients with COVID-19 had mild or common disease, so our results are not applicable to patients with severe disease.
In conclusion, COVID-19 and MP have similar clinical manifestations and laboratory results in early stage. However, the chest CT findings are valuable in the differential diagnosis of these two diseases, particularly in patients from COVID-19 epidemic areas.
