


1. Context
The infection caused by SARS-CoV-2, called coronavirus disease 2019 (COVID-19) by the World Health Organization (WHO), was first reported in December 2019 in Wuhan, China. On January 30, 2020, the WHO Emergency Committee warned that the rate of this infection was on the rise in China and other countries. Finally, the WHO declared it as a pandemic on March 11, 2020 (1). COVID-19 has a highly contagious nature and is easily transmitted from one individual to another, leading to a respiratory system dysfunction (2). According to the sixth trial of Chinese government guidelines for COVID-19 management, reverse transcription-polymerase chain reaction (RT-PCR) and gene sequencing for respiratory or blood specimens are the reference tools for diagnosing COVID-19 and hospitalization of infected cases. Nonetheless, the non-negligible rate of false-positive (FP) results undermines the reliability of these tests (3).
Other medical tools that are used to monitor the disease progression include chest radiography and computed tomography (CT) scan, as the virus targets the respiratory system (4). However, today, the importance of CT imaging is being discussed as a more efficient diagnostic and tracking tool as opposed to RT-PCR (2, 5). This paper reviewed the efficiency of CT imaging in diagnosis and tracking of COVID-19 progression compared to RT-PCR and to study the CT imaging features of this disease. Moreover, the CT image acquisition parameters, affecting image quality and patient dose, were discussed to emphasize the important contribution of CT scan to disease diagnosis and control.
2. Diagnosis of COVID-19
The timely diagnosis of a disease can play an important role in its control and treatment. Diagnosis becomes even more important in contagious diseases, such as COVID-19 due to its high prevalence and absence of symptoms several days after infection. Besides, by rapid diagnosis and isolation of the patient, the spread of the disease can be prevented (3, 4). Various studies have used laboratory tests, chest imaging, and RT-PCR of respiratory secretions for diagnosis of this infection. Also, isolation of COVID-19 and genetic sequences can be used for detecting the virus (6).
2.1. RT-PCR Assay
Since January 11, 2020, upon isolation of the viral strain of COVID-19 and establishment of its whole genome sequences, RT-PCR has been used to diagnose this infection. Soon later, contact history, clinical manifestations, and imaging evidence of pulmonary lesion were considered as the main factors for disease identification; however, RT-PCR is still being used for some suspected cases (7-10). To perform this test, respiratory secretions are obtained from the bronchoalveolar lavage, endotracheal aspirate, nasopharyngeal swab, or oropharyngeal swab (1). This test has a high specificity for COVID-19 (11). In other words, it can identify the virus subgroup, as Middle East respiratory syndrome (MERS)-CoV, SARS-CoV, and SARS-CoV-2 have similar clinical symptoms and effects on the respiratory system (1, 3, 12).
Despite its advantages, RT-PCR has some limitations. The low sensitivity of RT-PCR for identification of COVID-19 has been reported in various studies (1, 3). The time-consuming nature of this test and insufficient RT-PCR kits are other major issues during this pandemic. Likewise, lack of standard operating procedures for SARS-CoV-2 nucleic acid detection, improper sampling, insufficient viral material in the specimen (depending on the stage of the disease), sample handling, storage, and processing, and kit efficiency should be addressed, as well (4). Previous SARS studies show that RT-PCR lacks sensitivity within the first five days of the disease (13). Therefore, when the specimen tests are negative, the possibility of a false-negative (FN) result should be considered in the context of a patient’s recent exposure and clinical signs and symptoms consistent with SARS-CoV-2 infection (1, 3, 5).
2.2. CT Imaging
CT imaging, as a routine imaging tool which is available and relatively easy to perform, can be used to screen patients for rapid diagnosis and is more effective in detection of pneumonia caused by SARS-CoV-2. The majority of previous studies have reported that high-resolution computed tomography (HRCT) of the chest can identify infection in the respiratory system of COVID-19 patients (7, 11).
2.2.1. CT Imaging Features
According to a study by Wu et al., pneumonia was the main finding in chest CT images (76/80, 95%) at 7 ± 4 days after the onset of COVID-19 (5). Several studies have reported ground glass opacities (GGOs) or mixed GGOs, as well as patchy consolidations (sometimes oval rather than patchy) in the patients’ lungs after infection (3, 7, 8, 14). In a study by Xie et al., the CT imaging features attributed to COVID-19 included GGOs, consolidations, mixed GGO with consolidation, traction bronchiectasis, bronchial wall thickening, reticulation, subpleural bands, and vascular enlargement (15). The percentages of CT image features are presented in Table 1. The most common pattern was GGO in CT scans. The percentage of each feature was calculated based on the ratio of all patients having a given feature to all patients investigated for that feature in all studies of interest (1-3, 5, 8, 9, 11, 12, 14-54).
| Features | Percentage |
|---|---|
| Bilateral lung involvement | 70.0 |
| Peripheral distribution | 67.5 |
| Multifocal involvement | 67.3 |
| GGO | 66.1 |
| Mixed GGO and consolidation | 49.9 |
| Thickened interlobular septa | 43.3 |
| Rounded opacities | 41.8 |
| Air bronchogram | 41.5 |
| Linear opacities | 39.1 |
| Reticular pattern | 37.7 |
| Multiple mottling and GGO | 30.0 |
| Central + peripheral distribution | 27.8 |
| Consolidation | 26.4 |
| Subpleural line | 24.6 |
| Spider web sign | 22.3 |
| Crazy-paving pattern | 19.1 |
| Bronchiectasis | 18.5 |
| Pulmonary nodules | 16.0 |
| Unifocal involvement | 14.1 |
| Bronchial wall thickening | 13.8 |
| Normal CT | 9.9 |
| Underlying pulmonary fibrosis | 9.4 |
| Diffuse distribution | 8.8 |
| Lymphadenopathy | 6.4 |
| Pericardial effusion | 5.5 |
| Pleural effusion | 4.9 |
| “Reverse halo” sign | 3.8 |
| Central distribution | 3.7 |
| Enlarged mediastinal nodes | 2.9 |
| Lung cavitation | 0 |
The Percentage of Each Lesion Category Caused by COVID-19 in CT Images
Atypical CT manifestations can be particularly seen in the elderly or severe cases, including multiple patchy consolidations or large patches of consolidation in both lungs, with limited grid-like or honeycomb-shaped interlobular septal thickening, especially in the middle and lower lobes; single or multiple solid nodules; or consolidated nodules in the center of lobule, surrounded by GGOs (8, 15, 40, 55).
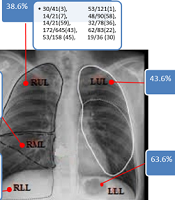
The location of lesions is another interesting topic in COVID-19 management. A recent study reported that lesions mostly occurred in the peripheral area under the pleura, although they might extend toward the center in larger lesions, as observed in severe and critically severe cases. In these patients, 4 - 5 lobes, and most significantly, bilateral lower and upper lobes, were mostly involved. Nonetheless, the 4- to 10-day follow-up CT scans indicated improvements in the lungs, including the reduced extent of lesions, decreased density, and formation of fibrotic stripes (4). Figure 1 summarizes the lesion sites in the lungs, according to various studies reporting the lesion sites in detail.
. For each lobe, the number of infected cases is separately presented in each study.")
As can be seen in Figure 2, bilateral lower lobes and the right middle lobe were the most and the least infected lung areas, respectively. The percentages of infected cases with different numbers of lobes involved are shown in Figure 2. Patients with the involvement of all lobes comprised the largest group. According to Figure 2, only 7.2% (85/1177) of the patients had no involved lobes, and 35% of the infected population had 4 - 5 lobes involved, indicating that COVID-19 quickly spreads over the lung tissue. The total number of patients was 1177 in studies investigating the number of involved lobes (Figure 2).
.")
Despite the similarity of COVID-19 symptoms and other types of coronavirus, definite epidemical history-taking and viral nucleic acids can be used to differentiate between pneumonia caused by COVID-19 and pneumonia caused by other viruses, such as influenza virus, parainfluenza virus, adenovirus, and SARS-CoV, or other microorganisms, including Mycoplasma, chlamydia, and bacteria. Large diffuse lesions of GGO in both lungs, accompanied by interlobular septa, are common in these infections (4).
Liu et al. suggested that in the clinical treatment of COVID-19, patients with a small amount of pleural effusion or pleural thickening may have a serious condition and need to be actively treated. Besides, lung lesions may still exist after the negative detection of SARS-CoV-2 nucleic acids, and follow-up may be needed (14). Pulmonary thromboembolism (PTE) caused by COVID-19, with a prevalence of up to 40% based on CT angiography, has been reported in several studies (59, 60). In this regard, Cavagna et al. investigated 101 patients infected with COVID-19 and found that PTE involved segmental and subsegmental venous systems more commonly and was more likely to be bilateral or have a right lobe involvement pattern. They also reported that consolidations were more dominant in the PTE-involved lung segments as compared to other segments (61). Besides, Zitzmann et al. reported that subpleural consolidations were related to PTE. They suggested that patients with a high D-dimer level and subpleural consolidations should be examined in terms of PTE (61).
2.2.2. Performance of CT Imaging for Diagnosis of COVID-19
The higher sensitivity and specificity of a test compared to other available tests are the main factors in test selection, as they are associated with more reliable results and less uncertainty of diagnosis. However, other factors, such as cost, risks, and the time needed for preparing the results, should be also considered (1, 7, 11, 23). Although chest CT findings are non-specific for COVID-19 detection, some studies suggested that CT could be used as an alternative diagnostic tool (7, 18, 47). Recent reports show that chest CT imaging can demonstrate pneumonia, even if multiple RT-PCR tests of nasopharyngeal or throat swabs are negative (3). Since several factors, resulting in FN values, can intervene in the RT-PCR results (1, 3, 8, 56), and the CT results are evaluated based on RT-PCR, it can be concluded that the FP values of CT are overestimated, and subsequently, the specificity of this tool is underestimated (3). Considering the mentioned advantages and disadvantages of RT-PCR and CT imaging, their comparison for COVID-19 diagnosis is summarized in Table 2.
| References | Total No. of positive RT-PCR cases | No. of cases with abnormalities in CT scan | Percentage of detected cases by CT per total true positive cases | Percentage of initially positive cases per total true positive cases by RT-PCR | CT parameters | Estimated effective dose (mSv) [male/female] | Explanation | ||
|---|---|---|---|---|---|---|---|---|---|
| KVp/mAs | Pitch | Slice thickness (mm) | |||||||
| (6, 11, 14, 15, 17-20, 26, 27, 31, 33, 39, 44, 46, 49, 51, 53, 58) | 1095 | 1095 | 100% | 86% (6, 31) | 100-120 kVp and varying mAs in different studies | 1-1.5 (11) and 1.2 & 1.37 (18) | 1-1.5 mm in all studies, but one (10 mm) (6) | 5.19 (M) & 6.58 (F) (6) and 4.67(M) & 6.44(F) (11) | Fifteen out of 81 patients had positive results in CT scans before the onset of symptoms (6). The study by Du et al. only included fatal cases (31). |
| (62) | 135 | 134 | 99% | – | – | – | – | – | – |
| (9, 23, 29) | 146 | 143 | 98% | 71% (9) | – | – | 5 mm (9) | – | |
| (3, 30, 40, 45) | 787 | 760 | 97% | 60% (3, 30) | 120/100-250 (45) and 100 kV/10-240 (40) | 0.99-1.22 (3) and 0.98 (45) | 10 (3), 1.25 (45), and 5 (40) | 3.17 (M) & 4.04 (F) (3) | Sensitivity, specificity, PPV, and NPV were calculated as 97%, 25%, 65%, and 83%, respectively. CT scan follow-ups showed health improvement in 42% of cases earlier than RT-PCR (3). |
| (28, 34, 57, 63) | 400 | 384 | 96% | – | 120/320 (57) and 100-120/110 - 280 (34) | 1.375 (34) and 1 - 1.5 (57) | 1.2 (22), 1.25, and 2.5 (34) | – | For patients with a severe condition, a high pitch was used (57). |
| (28, 35, 55, 64) | 412 | 391 | 95% | 97% (55) | – | 1.35 (28) | 1 (28) and 2 - 5 (35) | 3.7 (M) & 3.87 (F) (28) | |
| (25, 32, 38) | 267 | 251 | 94% | – | – | – | – | – | |
| (12, 21, 22) | 244 | 225 | 92% | – | 120/100 - 200 (12) and 120/150 (22) | 0.75 - 1.5 (12) and 1.35 (22) | 0.625 - 5 (12) and 1 (22) | – | |
| (7, 65) | 1,033 | 936 | 91% | Not reported | – | – | 1 | – | |
| (8, 34, 37, 43, 66, 67) | 902 | 801 | 89% | Not reported | – | – | – | – | There were 17 cases with negative CT results, five of whom had positive CT results after ten days, and 12 of whom showed no signs in CT scans until the end of the study (8). |
| (57) | 21 | 18 | 86% | Not reported | – | – | 1, 8 & 5 | 6.1 (M) & 2.24 (F) | |
| (42, 48, 54) | 54 | 45 | 83% | 83% | – | – | – | – | |
| (4) | 50 | 41 | 82% | Not reported | 120/automatic (40 - 250 mA) | 0.984 | 5 mm, reconstructed at 0.625 | 3.42 (M) & 6.23 (F) | Negative CT results were obtained in patients with a mild disease. |
| (2, 52) | 110 | 89 | 81% | Not reported | 120/adaptive tube current (52) | – | 1.5 (2) and 1.25 (52) | 4.73 (M) & 9.62 (F) (2) | Only four out of 24 cases had normal CT images, all of which were reported within 0 - 4 days after the onset of clinical symptoms (2). Due to the large number of patients, the following CT parameters were sometimes used: 5 mm section thickness, 5 mm gap, 120 kVp, and adaptive tube current (52). |
| (1) | 121 | 94 | 78% | 88% | 120/automatic tube current modulation | – | 8 & 1 | – | Normal CT scans were reported in 56%, 9%, and 4% of patients in the subgroups of 0 - 2, 3 - 5, and 6 - 12 days from the symptom onset until the time of scanning. |
| (56) | 90 | 69 | 77% | Not reported | 120/210 mA | – | 1 | 4.08 (M) & 6.66 (F) | The baseline chest CT data did not show any abnormalities in 21 (23%) patients, but three patients showed bilateral GGO on the second CT after 3 - 4 days. |
| (65) | 1099 | 840 | 76% | Not reported | – | – | – | – | Chest CT scans and X-ray images were employed to identify the patients. Performance differences between the two modalities were 61.7%, 64.7%, and 61.1% for the total patient population, severe cases, and non-severe cases, respectively. |
| (68) | 24 | 17 | 71% | – | – | – | – | – | |
| (36, 69) | 158 | 109 | 69% | 89% (36) | – | – | – | – | |
| (70) | 248 | 163 | 67% | Not reported | |||||
| Total | 7,396 | 6,605 | 89% | 57% | |||||
A Comparison of the Performance of RT-PCR and CT Scan as Diagnostic Tools for COVID-19 in Different Studies
Despite the CT imaging advantages, this modality can increase the risk of cancer due to the use of ionizing radiation. Based on the International Society of Ultrasound in Obstetrics and Gynecology (ISUOG) guidelines, chest imaging, especially CT scan, is essential for evaluating the clinical status of pregnant women with COVID‐19. The radiation dose to the fetus is 0.01-0.66 mGy from a single chest CT scan, which is negligible without any complications (63).
In a study by Ai et al., RT-PCR was used as the reference. The results of RT-PCR were negative in 35% of patients diagnosed with COVID-19 based on CT scans; the high number of FP values in CT was the reason for this finding. However, it should be noted that the sensitivity of RT-PCR was lower than expected. Besides, the negative predictive values (NPVs) indicated that the rate of misdiagnosis of patients as healthy cases by CT was 17% (3). Ai et al. also found that 147 out of 308 (48%) patients with FP values were more likely to be infected. Based on this assumption, the sensitivity, specificity, and positive predictive value (PPV) would be 97.5%, 64%, and 93%, respectively. In other words, the FP values of CT imaging were higher than the real FP values based on the first RT-PCR. With RT-PCR repetition and patient follow-up, it was found that only 7% of cases with positive CT results had negative RT-PCR results. As explained earlier, the FP value of CT was estimated to be 35%, based on the first results of RT-PCR without this correction.
According to studies described in Table 2, the percentage of non-detected cases by CT was 10% (692/6867). This result might be due to the fact that the patients were probably in the early stages of the disease, and subsequently, there were no lesions in the lung tissue. Similarly, a study by Guan et al. showed that chest CT scan could identify 91.3% of patients with a severe condition and 73.3% of patients with a non-severe condition (65). Similar results have been reported in some other studies (1, 2, 4), summarized in Table 2. These findings demonstrated that COVID-19 had a gradual impact on the lung tissue. Observation of these lung alterations relatively depended on the time interval between the symptom onset and CT image acquisition, as illustrated in Figure 3. Similar results were obtained for 73 SARS-infected cases, as the CT results were normal in patients with mild symptoms (13).
.")
The percentage of COVID-19 patients with normal CT results in each interval between the onset of symptoms and CT image acquisition. Each circle represents the number of patients with normal CT results in a specific interval. For instance, patients with CT scans acquired at 11, 13, and 18 days after the onset of symptoms were combined into one group; there were no patients with normal CT results in this group. The total number of patients with the reported time interval between the symptom onset and CT image acquisition was 2,751 (1, 2, 5-10, 15, 17, 22-27, 29-34, 37, 39, 40, 42, 44, 46, 51-54, 58, 71, 72).
As can be seen in Figure 3, the percentage of patients with normal CT scans decreased as the time interval increased from the onset of symptoms. In other words, the probability of COVID-19 manifestation on CT scan was low before the symptom onset or in early stages of the disease, although it increased due to gradual disease progression. It should be noted that the middle point of this interval was considered as the time of CT image acquisition in studies reporting the intervals between the symptom onset and CT image acquisition, whereas in other studies, the mean or median of intervals was considered as the time of CT image acquisition. In contrast, abnormal CT findings with the initial FN results of RT-PCR have been documented (1, 3, 30). Also, Shi et al. reported that CT images could identify early changes in the respiratory system of asymptomatic cases because of COVID-19 (6).
In previous studies examining the sensitivity of RT-PCR, the rate of positive results was 70% in the first test. Nonetheless, CT could identify 93% of cases in the first exposure, as reported in multiple studies (1, 3, 6, 7, 15, 16, 37, 39, 42, 65, 72-75) (Table 2). Interestingly, a similar percentage (67%) was reported for identification of SARS for the first time using RT-PCR (74). Unlike RT-PCR that can only diagnose COVID-19, CT imaging can diagnose the infection and show the disease progression. CT can also demonstrate whether there are still lesions in the lung tissue in the absence of clinical symptoms. Therefore, it is suggested that chest CT follow-ups be performed after patient discharge and during prescribed drug consumption intervals (3, 7, 14, 26, 28).
Artificial intelligence (AI) technologies, such as deep learning, can contribute to image feature extraction and subsequently, to rapid clinical diagnosis. Wang et al. assessed the performance of deep learning algorithms for COVID-19. A total of 453 CT images of definite cases were included in their study. The results demonstrated that the algorithm provided an accuracy of 82.9%, specificity of 80.5%, and sensitivity of 84% as compared to RT-PCR. The measured sensitivity is compatible with the mean sensitivity that we calculated based on different studies reviewed. Therefore, it can be concluded that assessment of image features using deep learning algorithms significantly facilitates timely and accurate diagnosis of the disease, particularly when dealing with a heavy workload (76).
2.2.3. Acquisition Parameters
Image quality is one of the most important factors in the interpretation of CT images and has a direct impact on clinical diagnosis. Different acquisition parameters influence the quality of CT images; therefore, the results of CT depend on the protocols, particularly in the early stages of COVID-19. However, even by using proper parameters, some studies reported the negative results of chest CT imaging when the RT-PCR results were positive (8, 57, 65). Their findings revealed that a normal chest CT scan could not be interpreted as the absence of infection in suspected cases. Moreover, the possibility of FN results of RT-PCR should be considered regarding the patient's exposure history, typical CT imaging features, the presence of clinical symptoms, and dynamic changes similar to COVID-19 (3).
Wong et al. conducted a study to investigate the lesion size in the lung tissue due to SARS (13). They acquired two CT images of 149 SARS-infected patients. The first scans were the conventional CT scans of the thorax with a 7-mm slice thickness and a pitch of 1.5. The second scans were acquired via HRCT with a 1-mm slice thickness and a 6-mm gap for a better assessment; the kVp and mAs were almost the same in the two CT series. The results revealed that small lesion sizes were better observed in small slice thicknesses. Therefore, it can be concluded that for COVID-19 diagnosis, a smaller slice thickness and a lower pitch were associated with the higher sensitivity of CT scans, as there are similar characteristics between COVID-19 and SARS.
Moreover, in a study by Bernheim et al., the patients were scanned with different slice thicknesses. However, it was not discussed what slice thickness was used for patients with normal CT scans; therefore, we could not discuss this study. Nonetheless, it can be concluded that CT scans have a lower sensitivity in patients who are in early stages of the disease (1). A similar conclusion was made by Xu et al.; the imaging parameters are shown in Table 2. The width/level of 2000/-600 HU for the lung window and 350/40 HU for the mediastinal window were adjusted in their study, as well (4). The CT results were normal for all patients with mild symptoms. Since slice thickness plays a key role in determining spatial resolution and image reconstruction, one of the reasons for negative CT results could be the large slice thickness, causing problems in image reconstruction. However, the disease might not cause lesions in some cases; these cases had normal CT results, even in HRCT (4), and RT-PCR was crucial for diagnosis.
Besides, Pan et al. investigated the CT scan changes of COVID-19 during the recovery process (2). The initial CT images of 4/21 (19%) patients did not indicate any lung lesions in the time interval of 2 ± 2 days after the symptom onset. However, lung involvement increased within ten days after the symptom onset, followed by a decreasing trend thereafter. According to the disease classification by Bernheim et al. (1), in which patients are categorized into three groups of early (0 - 2 days), intermediate (3 - 5 days), and late (6 - 12 days) according to the interval between the initial onset of symptoms and the subsequent chest CT scan, patients in the study by Pan et al. were in the early stage of the disease. However, the sensitivity of CT scan was reported to be 95%, which is higher than the percentage reported by Bernheim et al. for this group. The image acquisition parameters were as follows: slice thickness of 1.5 mm with an increment of 1.5 mm and a repetitive reconstruction algorithm with a B70F kernel and a B30F lung kernel; therefore, the smaller slice thickness could be the cause of sensitivity differences between these two studies. It is recommended to perform CT imaging with small slice thicknesses to acquire chest images in cases with mild symptoms.
Moreover, Wu et al. reported that the average time between hospital admission and CT imaging was 7 ± 4 days (5). The disease was categorized into intermediate and late stages according to the classification by Bernheim et al. (1). In other words, the patients had symptoms, including pneumonia, as indicated by CT with high sensitivity. It should be noted that they used a B80f reconstruction kernel (a sharp kernel) and a high-resolution algorithm in their study. It is suggested to conduct CT imaging with a high pitch to accelerate CT image acquisition and decrease the workload for patients with severe respiratory problems. Also, for these patients, it is possible to increase the slice thickness, which is most beneficial during this epidemic due to high requests for CT scans.
Previous studies have indicated that a chest CT examination delivered a dose, which was 100 - 500 times higher than conventional chest X-ray on average, thereby increasing the risk of cancer (73, 75). Since radiation exposure in CT imaging can increase the risk of cancer and CT scans are commonly performed in patients with COVID-19, a compromise between image quality and effective dose seems necessary (77). Besides, in this review, using the International Commission on Radiological Protection (ICRP013) weighting factors and ImpactDose v. 2.2 (CT Imaging GmbH, Erlangen, Germany), we evaluated the effective dose, based on the image acquisition parameters mentioned in several studies (2-6, 11, 56, 57). Different parameters, including gender, age, kVp, mAs, scan length, CT dose index (CTDI), scanner type, and patient’s anterior and posterior lengths, were considered in the estimations. Also, PCXMC v. 2 (STUK, Helsinki, Finland) was used (78) to calculate the cancer risk, using categorized tables in the National Academy of Sciences Biologic Effects of Ionizing Radiation (BEIR) VII report.
For effective dose estimations, the image acquisition parameters of 1,420 patients, including 667 men and 753 women, were examined. The mean age of this population was 47 ± 3.8 years. In the male group, the mean effective dose was measured to be 4.38 mSv. Also, most effective doses were reported for the heart (13.54 mSv), lungs (12.93 mSv), and thyroid (9.8 mSv). On the other hand, in the female group, the mean effective dose was 5.71 mSv. Most effective doses were estimated in the heart (13.27 mSv), lungs (11.33 mSv), breasts (8.23 mSv), and thyroid (6.63 mSv), respectively.
Additionally, the cancer risk was estimated to be higher in the female group compared to the male group (36%) in this review, which is compatible with previous studies in the literature (79). Therefore, due to the COVID-19 outbreak and the necessity of repeated CT image acquisition at admission or in follow-ups, it is highly recommended to optimize the image acquisition parameters. Different studies have investigated the influential parameters in the effective dose. A large slice thickness, high pitch, automated tube current modulation technique, iterative reconstruction algorithm, precise adjustment of scan range, and correct patient positioning are the main factors in dose reduction. However, they should be adjusted to achieve a reasonable image quality (78, 80).
3. Conclusion
COVID-19 imposes a serious economic burden on governments and healthcare systems, including heavy workloads and high costs of diagnosis and treatment due to its rapid outbreak in a limited period. In the absence of effective treatments, the most applicable strategy to deal with the SARS-CoV-2 epidemic is appropriate and fast screening of suspected cases. By using this strategy, not only infected cases are quarantined and receive proper medical care, but also the possibility of disease spread decreases significantly. However, since 89% of infected cases are hospitalized after five days of disease onset (72), identification and isolation of suspected cases in the earlier stages of the disease seems difficult.
In CT imaging as a diagnostic tool, spatial resolution plays a decisive role in finding lesions caused by COVID-19. Besides image quality, another important aspect of CT scan is the effective dose; therefore, a compromise between image quality and effective dose seems necessary. Slice thickness and pitch were effective parameters in both spatial resolution and the dose received by the patients. Based on various studies, a small slice thickness and a pitch < 1 led to a better detection of lesions in patients in the early stage of the disease. Along with disease progression, and subsequently, lesion enlargement, a larger slice thickness and pitch > 1 could be used (81).
For dose estimations, 1,420 patients, consisting of 667 men and 753 women, were examined in this review. Using ImpactDose software, the estimated effective doses were 4.38 and 5.71 mSv for males and females, respectively. The cancer risk was also estimated to be 36% higher in women than men, based on the PCXMC results. The most common findings in CT images were GGOs and consolidations. Most COVID-19 patients had multifocal and bilateral lesions; nevertheless, the amount of damage to the lung tissue changed rapidly. COVID-19 can target any lobe of the lungs, although lower lung lobes are mostly affected by COVID-19. It seems that lung damage observed in CT scans is more serious than clinical manifestations. Therefore, attention to CT images can significantly contribute to COVID-19 diagnosis, as well as monitoring of patients during treatment.
Among patients with positive RT-PCR for COVID-19, but normal CT results, 93.4% were definitely in the early stages of the disease in the reviewed studies (no information for the rest) (1, 2, 4, 65, 71). In other words, misdiagnosis by CT imaging might be related to the early stages of the disease when the lesions are not discernible in the lung tissue, even by HRCT scans. The estimated CT sensitivity was 90% in all studies reviewed. The highest and lowest CT sensitivities were 100% and 67%, respectively.
In conclusion, for an optimized diagnosis of COVID-19, essential factors, including speed and accuracy of diagnosis, cost, ionizing radiation dose, and workload imposed on the healthcare system, should be considered. The findings of the present review revealed that diagnostic tools should be employed based on the time from the onset of symptom. In a study by Pan et al. (2), the sensitivity of CT was 81% in the first period of the study (2 ± 2 days after the symptom onset), which is in line with the present findings (79.1% for 0 - 3 days after the symptom onset).
Within 0 - 3 days after the onset of symptoms (any symptom), the sensitivity of CT scan was estimated at 79.1%. Although this sensitivity is higher than the total calculated sensitivity of RT-PCR (70%), CT imaging showed the lowest sensitivity in this interval. Within 4 - 8 days after the onset of symptoms, the sensitivity of CT scan was estimated at 91.3%, which seems to depend on the image acquisition parameters affecting image quality. Finally, nine days after the symptom onset, the sensitivity of CT scan was estimated at 95.1%, regardless of imaging protocols. Therefore, a normal CT result in this interval indicates that suspected cases are not infected with COVID-19. However, the manifestation time and severity of COVID-19 were significantly different in various populations. Therefore, a combination of repeated swab tests and CT scanning can be used for highly suspected cases with negative results of RT-PCR.
