

1. Background
Gliomas are the most common malignant tumors of the central nervous system (CNS). The prognosis of gliomas, especially in patients with high-grade gliomas (HGGs), remains poor despite maximal therapy. Consequently, preoperative assessment of the grade and degree of glioma malignancy is crucial in these patients (1-4). Gliomas are often accompanied by peritumoral brain edema (PTBE). In this regard, a previous study implicated the degree of PTBE as an independent prognostic factor in patients with gliomas (5).
In the last decade, isocitrate dehydrogenase (IDH) mutations have been considered as the most important genetic alterations in gliomas. These mutations are found in almost 80% of lower-grade gliomas (LGGs; grades I-II), 85% of secondary glioblastomas (GBMs), and only 5% of primary GBMs (6). On the other hand, Ki-67 is a nuclear non-histone protein, which was identified by Gerdes et al. (7) in the early 1980’s at the University of Kiel, Germany. This protein is universally expressed in proliferating cells, while it has not been detected in quiescent cells; therefore, it can be suggested as a promising tumor proliferation biomarker (7, 8). Also, the Ki-67 expression level seems to be significantly higher in patients with gliomas compared to normal individuals (9).
According to previous studies, although Ki-67 expression and IDH1 mutation status are important prognostic markers of gliomas, pathological tissues must be collected via biopsy or surgery, which in turn limits the clinical value of these markers. On the other hand, PTBE, as an independent prognostic factor for gliomas, is an easily estimated index in clinics. The present study aimed to investigate the association of PTBE with the degree of glioma malignancy and certain pathological parameters.
2. Objectives
By using T2-weighted imaging (T2WI), T2 fluid-attenuated inversion recovery (T2-FLAIR), and T1-weighted contrast-enhanced imaging (T1W-CE) sequences, we aimed to investigate whether the grade of malignancy, IDH1 mutation status, and Ki-67 expression level of glioma were correlated with the extent of PTBE.
3. Patients and Methods
3.1. Study Population
The present study was conducted among 126 patients with gliomas, who underwent routine preoperative MRI from July 2017 to May 2020 in our institutions after the institutional ethics committee clearance. The requirement to obtain informed consent was waived for this retrospective study. The inclusion criteria were as follows: grade I-IV gliomas; no history of preoperative radiotherapy or chemotherapy; diagnosis of glioma via postoperative pathological examinations, based on the 2016 World Health Organization (WHO) classification of CNS tumors; and undergoing a routine preoperative cerebral MRI examination within one week of surgery.
On the other hand, poor-quality images and those in which the tumor and edema boundaries were difficult to distinguish were excluded from the study. Also, patients with recurrence of glioma and those undergoing preoperative biopsy were eliminated. Finally, 82 eligible cases were included in this study (Figure 1). Some pathological parameters, such as the grade of glioma, Ki-67 expression level, and IDH1 mutation status, were selected and examined in this study.

The flow diagram of patient selection
3.2. MRI Scanning Parameters
All 82 patients recruited in this study underwent imaging based on a multi-sequence imaging protocol on a 3.0T MRI system (Discovery 750, GE Healthcare, Milwaukee, WI, USA) with an eight-channel head coil (GE Healthcare, Milwaukee, WI, USA). The following four sequences were selected in this study: T1-weighted spin-echo (T1WI-SE), T2WI, T2-FLAIR, and contrast-enhanced T1-weighted (T1W-CE) sequences. The acquisition parameters in the T1WI-SE sequence were as follows: repetition time/echo time (TR/TE): 1,750/25.4 msec, matrix size: 512 × 512, field of view (FOV): 220 × 220, slice thickness: 5 mm, gap: 1.5 mm, and acquisition time: 1 min, 29 sec. Also, in the T2WI sequence, the acquisition parameters were as follows: TR/TE: 4600/102 msec, matrix size: 224 × 320, FOV: 220 × 220, layer thickness: 6 mm, layer spacing: 1 mm, layer number: 18, and excitation number: 1. Finally, the T1W-CE imaging was performed by repeating T1WI (described above) after a bolus injection of 0.1 mmol/kg of gadodiamide (Omniscan, GE Healthcare, Cork, Ireland).
3.3. Calculation of PTBE Area and Edema Index
After MRI, the T1W-CE and T2WI or T2-FLAIR images were selected for measuring the edema area. The delineation of tumor core was referenced to the T1W-CE sequence, while no obvious cystic regions were included. Also, PTBE was referenced to the T2WI or T2-FLAIR sequence, and the boundaries of LGGs with no enhancement were determined on T2WI images, as they are widely accepted for identifying hyperintense signals representing the tumor regions (10). Next, the tumor contours of T2WI or T2-FLAIR images were mapped onto the T1W-CE images. For gliomas with enhancement, the tumor boundaries were determined on T1W-CE images, and PTBE regions were delineated on T2WI or T2-FLAIR images. Next, the tumor contours in T1W-CE images were mapped onto T2WI images, and the parenchymal and edematous areas of the tumor were separated on T2WI or T2-FLAIR images.
The images were delineated by two senior neuroimaging diagnosticians with more than 10 years of work experience, using a double-blind method; each diagnostician delineated each image separately. In case of disagreement on the position of tumor borders, a consensus was reached by discussion, especially if positional variations resulted in a discrepancy. Next, the edema index (EI) of PTBE was calculated, according to the following formula:
EI = V2/V1
Where V1 represents the tumor volume, and V2 represents the tumor + PTBE volume. The volumes were determined as follows:
V = 4πABC/3
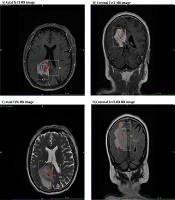
where A and B denote two radial lines with the largest cross-sections of tumor or edema tissue, perpendicular to each other during axial scanning; and C is the maximum height on the coronal or sagittal plane (Figure 2). The EI can generally reflect the degree of PTBE. Overall, EI = 1 indicates no PTBE, whereas EI > 1 suggests the presence of PTBE (11). PTBE was also graded as follows: El = 1, no edema around the tumor (grade 0); El = 1-1.5, mild edema around the tumor (grade I); El = 1.5-3, moderate edema around the tumor (grade II); and EI > 3, severe edema around the tumor (grade III). Besides, the A1, B1, and C1 and A2, B2, and C2 measurements represent the maximum diameters in the axial, sagittal, and coronal planes of tumor itself and tumor + PTBE, respectively (Figure 2).
 and tumor + peritumoral brain edema (PTBE) (C and D); tumor region is referenced to the T1-CE image, while PTBE is referenced to the T2WI or T2-FLAIR image. A1, B1, and C1 represent the maximum diameters of the measured tumor volume in the axial, sagittal, and coronal aspects of the tumor, respectively. A2, B2, and C2 represent the three maximal diameters of tumor core + PTBE, respectively.")
A-D, Delineation and calculation of the volume of tumor (A and B) and tumor + peritumoral brain edema (PTBE) (C and D); tumor region is referenced to the T1-CE image, while PTBE is referenced to the T2WI or T2-FLAIR image. A1, B1, and C1 represent the maximum diameters of the measured tumor volume in the axial, sagittal, and coronal aspects of the tumor, respectively. A2, B2, and C2 represent the three maximal diameters of tumor core + PTBE, respectively.
3.4. Statistical Analysis
All statistical analyses were performed in SPSS version 22.0 (released in 2013, IBM SPSS Statistics for Windows, IBM Corp., Armonk, NY, USA). Kolmogorov-Smirnov test was used to examine the normal distribution of data. The demographic data with a normal distribution are expressed as mean ± standard deviation (SD) and compared using t-test. Data without a normal distribution were also compared using a rank sum test (Mann-Whitney U-test), and P < 0.05 was considered statistically significant.
Moreover, Spearman’s rank correlation coefficient was measured to determine the correlations between different parameters and the degree of EI. A multivariate logistic regression analysis was also performed for the correlation analysis between IDH1 and related variables at a significance level of 0.05. Besides, a receiver operating characteristic (ROC) curve analysis was performed to evaluate the independent predictive value of EI in differentiating HGGs from LGGs.
4. Results
The mean age of the participants was 50.8 ± 14.4 years (age range: 12 - 84 years). Overall, 48 patients were male, and 34 were female. Based on the pathological examination of all 82 tumors, 29 were classified as LGGs and 53 as HGGs. Also, 26 tumors were in the IDH1 mutant group, while 56 were in the IDH1 wild-type group.
The median EI of the patients was 2.300 (1.525 - 3.230) (Table 1). Overall, the Spearman’s correlation coefficients for the association of EI with the expression level of Ki-67 and age (P < 0.05) were 0.740 and 0.466, respectively, indicating that the degree of EI increased with an increase in the Ki-67 expression and age. (Table 2); however, no significant difference was found between the patient’s gender and the degree of EI (z = -0.497, P = 0.619). Based on the results, the degree of EI was higher in the HGG group compared to the LGG group, and the difference was significant (z = -7.018, P < 0.05). The degree of EI also had a significant difference between the IDH1 wild type and mutant groups (z = -4.116, P < 0.05), and the difference was statistically significant (Table 2).
| Numbers | Mean ± SD | Minimum | Maximum | Percentiles | |||
|---|---|---|---|---|---|---|---|
| 25th | 50th (median) | 75th | |||||
| EI | 82 | 2.711 ± 1.537 | 1.00 | 7.65 | 1.525 | 2.300 | 3.230 |
The Index of PTBE
| Parameters | Mean ± SD | Numbers | Mean rank | Sum of ranks | Mann-Whitney U-test | Z | P-value |
|---|---|---|---|---|---|---|---|
| Gender | 766.000 | -0.497 | 0.619 | ||||
| Female | 4.07 ± 3.07 | 34 | 40.03 | 1361.00 | |||
| Male | 4.70 ± 5.96 | 48 | 42.54 | 2042.00 | |||
| Glioma grade | 83.500 | -7.018 | < 0.01 | ||||
| LGG | 2.79 ± 3.23 | 29 | 17.88 | 518.50 | |||
| HGG | 5.51 ± 5.72 | 53 | 54.42 | 2884.50 | |||
| IDH1 | 337.000 | -4.116 | < 0.01 | ||||
| Wild-type | 3.19 ± 1.65 | 56 | 48.48 | 2715.00 | |||
| Mutant-type | 2.05 ± 1.09 | 26 | 26.46 | 688.00 |
Differences in the EI of PTBE with Gender, Glioma Grade, and IDH1 Mutation Status
The multivariate logistic regression model indicated that the grade of glioma was an independent factor for predicting the status of IDH1 (P < 0.05) (Table 3). Also, EI and IDH1 could differentiate LGGs from HGGs (P < 0.05 for both) (Table 4). By considering EI as an independent index and the grade of glioma as a dependent variable, a logistic regression analysis was conducted, and a ROC curve analysis was performed (Figure 3). The area under curve (AUC) of EI was measured to be 0.822 (cutoff value: 1.722, sensitivity: 95.8%, specificity: 70.0%, 95% CI: 0.718-0.899), which shows that PTBE has a potential predictive value for differentiating LGGs from HGGs.
| Variables | B | Std. Error | OR (95% CI) | P-value |
|---|---|---|---|---|
| Age | 0.002 | 0.022 | 1.002 (0.960 to 1.046) | 0.934 |
| Gender | -0.505 | 0.600 | 0.604 (0.186 to 1.957) | 0.400 |
| Grade | 2.096 | 0.921 | 8.131 (1.336 to 49.474) | 0.023 |
| Ki-67 | -0.022 | 0.028 | 0.978 (0.926 to 1.034) | 0.436 |
| EI | -0.044 | 0.595 | 0.957 (0.298 to 3.071) | 0.942 |
Multivariate Logistic Regression Analysis Identifying Independent Factors Associated with the IDH1 Mutation Status
| Variables | B | Std. Error | OR (95% CI) | P-value |
|---|---|---|---|---|
| Age | 0.012 | 0.034 | 1.012 (0.947 to 1.083) | 0.718 |
| Gender | 1.318 | 1.101 | 3.737 (0.432 to 32.358) | 0.231 |
| Ki-67 | 0.096 | 0.050 | 1.100 (0.997 to 1.215) | 0.058 |
| EI | 3.381 | 0.982 | 29.405 (4.292 to 201.464) | 0.001 |
| IDH1 | 2.086 | 1.020 | 8.050 (1.091 to 59.377) | 0.041 |
Multivariate Logistic Regression Analysis Demonstrating Independent Factors Associated with Glioma Grade (LGG vs HGG)
![The receiver operating characteristic (ROC) curve analysis of edema index (EI) for predicting the glioma grade [low grade glioma (LGG) or high grade glioma (HGG)]](https://services.brieflands.com/cdn/serve/3157e/a47ddb9499fc9966b13baf5d73278b2d6f115292/iranjradiol-18-3-109181-i002-preview.png "The receiver operating characteristic (ROC) curve analysis of edema index (EI) for predicting the glioma grade [low grade glioma (LGG) or high grade glioma (HGG)]")
The receiver operating characteristic (ROC) curve analysis of edema index (EI) for predicting the glioma grade [low grade glioma (LGG) or high grade glioma (HGG)]
5. Discussion
Glioma is one of the most common malignant brain tumors, accounting for more than half of intracranial tumors. PTBE is a common complication of gliomas. The mechanism of PTBE is very complex, although most studies have implicated changes in vascular permeability, increased aquaporins, and cytotoxic factors as significant etiological factors (12, 13). Some scholars (5, 14) have observed that the degree of PTBE is positively related to the malignancy grade of glioma; in other words, the degree of PTBE often increases with the malignancy grade of tumor.
Tumor cells often infiltrate into the area of PTBE, probably because the presence of PTBE loosens the peritumoral tissue, which is beneficial for the growth and diffusion of tumor (15). In this regard, a previous study revealed that the degree of glial PTBE in the human brain was associated with the pathological grade and Karnofsky score, while it was independent of tumor size or shape (14). Therefore, further elaboration of the relationship between the pathological type of glioma and PTBE can be helpful for clinical diagnosis and treatment.
Some studies have revealed that the degree of PTBE in patients with gliomas is associated with the tumor grade. A previous study showed that the PTBE of patients with grade III-IV gliomas was significantly higher than that of patients with grade I-II gliomas (16). In other words, the more malignant the tumor cells are, the more immune-related and inflammatory factors, such as vascular endothelial growth factor, prostaglandin, vascular endothelial growth factor, nitric oxide synthase, and arachidonic acid, are secreted, changing the permeability of the blood-brain barrier and aggravating brain edema. Simultaneously, HGGs grow faster, and the presence of PTBE further compresses the surrounding brain tissue and blocks the venous reflux of the surrounding tissue, aggravating the degree of PTBE (17, 18).
In recent years, some scholars have suggested that neovascularization lacks a complete blood-tumor barrier and that some neovascularization may derive from the transformation of tumor stem cells (19, 20). By evaluating the relationship between preoperative edema degree and benign and malignant gliomas through MRI, the present study proved that the difference in the degree of EI between benign and malignant gliomas was significant and that the degree of PTBE was positively correlated with the malignant degree of glioma. Overall, our study provided an imaging reference for rapid preoperative differentiation of benign and malignant gliomas.
In the present study, we calculated EI as our main objective rather than the edema volume to determine whether the malignancy grade of tumor can be determined by the volume of PTBE rather than only the volume of tumor; the present results confirmed the value of this parameter. Other studies of glioma grading suggest age as an individual differentiating factor between LGGs and HGGs, unlike gender (21, 22). However, in the present study, the value of age was not significant, we look forward to a multicenter and big sample research to further confirm it.
Ki-67 is a proliferating cell-associated nuclear antigen, which is involved in all active stages of the cell cycle, but not in the resting stage. Ki-67 has been used as a biomarker for expressing the proliferative activity of tumor cells (16) to provide information on the tumor biological behavior, therapeutic response, and prognosis (23). In this regard, Su et al. (24) observed that the Ki-67 expression in LGGs was significantly lower than that of HGGs. Therefore, the degree of malignancy increased with the grade of glioma. Moreover, Bai et al. (25) observed that Ki-67 can distinguish between not only HGGs and LGGs, but also between grade III and IV gliomas. However, Skjulsvik et al. (9) argued that Ki-67 has limited potential to distinguish between LGGs and HGGs. Therefore, it cannot be used as an independent marker of glioma grading and should be combined with histological features. Nevertheless, it was confirmed that Ki-67 can be useful for grading gliomas.
Although Ki-67 is useful for grading and malignancy assessment of gliomas, its measurement requires either biopsy or surgical resection and is affected by errors of heterogeneous tumor sampling, limiting its diagnostic accuracy, especially in small samples, such as stereoscopy (9). Therefore, non-invasive prediction of Ki-67 expression in different tumor regions is of great importance. In our study, evaluating the relationship between the degree of PTBE and the preoperative Ki-67 expression, the degree of PTBE was positively correlated with the Ki-67 expression level. Therefore, Ki-67 not only can evaluate the proliferative activity of gliomas, but also has some correlations with imaging parameters, which is significant for the non-invasive evaluation of malignancy.
The IDH1 mutation status is significant in the occurrence and progression of gliomas and is expected to be a key target in future therapies (26). The IDH1 mutant tumor cells are susceptible to oxidative damage during radiotherapy and chemotherapy, making the treatment more effective and increasing the patient survival (27, 28); therefore, predictive IDH1 typing is crucial for clinical decision-making. The present study demonstrated that the degree of PTBE has a significant difference between IDH wild and mutation type, but it was not a independent factor for prediction of IDH1 statue (P > 0.05), indicating that PTBE might not be used as a predictive factor for patients' survival.
MRI has become the main imaging modality for the non-invasive evaluation of the malignant grade of gliomas. Multimodal MRI sequences can further improve the accuracy of predictions. Although our study exhibited a correlation between PTBE and certain glioma characteristics, it had some limitations. First, because the sample size was not large enough, more patients from multiple centers were needed to confirm the generalizability of our model to overcome the limitation of population bias in this retrospective study. Second, measurement of edema was not accurate enough, and more advanced technologies and tools are needed to refine it.
Third, not all preoperative sequences were considered for every patient, and other important MRI sequences, such as diffusion-weighted imaging and diffusion-tensor imaging, were not included; therefore, further research with prospective multi-parametric MRI scan is needed. Finally, it is difficult to distinguish reactive and infiltrative edemas by MRI, and more attention must be paid to this limitation.
In conclusion, the degree of PTBE can be valuable for differentiating HGGs from LGGs and may be associated with the IDH1 mutation status and Ki-67 expression level. Moreover, the degree of PTBE was positively correlated with the patient’s age, and Ki-67 expression level. Overall, with the introduction of multimodal sequences and parameters, PTBE may be considered a vital, novel, and non-invasive evaluation method of gliomas in the future.
