


1. Background
Breast cancer is the most common female malignancy around the world. According to the GLOBOCAN report, this cancer accounted for 24.2% of 8.6 million newly diagnosed cancer cases in 2018 worldwide. The incidence of breast cancer has increased steadily in most countries (1). With a rapid increase in the aging population around the world, there has been a surge in the number of elderly breast cancer patients. According to the World Health Organization (WHO), 43.9% of newly diagnosed breast cancer patients (917,704 out of 2,088,849) were 60 years or older in 2018 (2).
With the increasing number of breast cancer patients, magnetic resonance imaging (MRI) has been actively used for preoperative assessments. MRI plays an important role is lesion size measurements for breast cancer patients. Generally, the results of MRI are important for preoperative staging, surgical planning, and response monitoring (3-5). However, there has been no consensus on the accuracy of tumor size measurements by MRI. In this regard, Pop et al. (6) reported that MRI measured tumor size more accurately than ultrasound (US) or mammography (MG). Katz et al. (7) reported that MRI and US were both strongly correlated with the pathological tumor size overall and within grades in invasive ductal and lobular carcinomas. Leddy et al. (8) reported that preoperative MRI significantly overestimated the tumor size, while US and MG provided more accurate measurements, irrespective of the breast density.
The populations of the mentioned studies included patients of all ages, and there were only few studies in the literature targeting the elderly (9, 10). Considering the increased use of breast MRI for elderly breast cancer patients, it is necessary to study the accuracy of tumor size measurements by breast MRI in these patients.
2. Objectives
This study aimed to evaluate the accuracy of tumor size measurements on breast MRI in elderly breast cancer patients and to compare the results with conventional MG and US findings. We also investigated the predictors that influenced the accuracy of tumor size measurements in imaging studies.
3. Patients and Methods
3.1. Study Population
This retrospective study was reviewed and approved by the institutional review board, and the requirement for informed consent was waived. From January 2012 to December 2019, a total of 201 patients underwent surgery for invasive breast cancer, 141 of whom were 50 years or older. Patients who had not undergone MG (n = 6) or had received neoadjuvant chemotherapy (n = 1) were excluded. Finally, 134 patients (137 breasts with cancer) were included in this study. All of the patients had undergone MG and US, and MRI was performed for 122 patients (125 breasts with cancer).
3.2. Imaging Modalities
For MG, the craniocaudal (CC) and mediolateral oblique (MLO) views of both breasts were acquired using a Selenia Full-Field Digital Mammography Unit (Hologic Inc, Danbury, CT, USA). US was performed using an IU22 system (Philips Medical Systems, Bothell, WA, USA), equipped with a 5 - 12 MHz linear array transducer. All breast images were acquired by a specialist. MRI was also performed using a 3.0T Magnetom Skyra Suite (Siemens Healthineers, Erlangen, Germany) with a four-channel breast coil.
The MRI protocols were as follows: Axial T1W and T2W turbo spin-echo (TSE) and T2W images with/without fat suppression; seven subtraction sequences from one pre-contrast image and seven post-contrast images with axial, fat-suppressed, T1W 3D gradient-echo (GRE) sequences (TR/TE: 4.3/1.7; flip angle: 10°; section thickness: 1.0 mm with no gap; matrix size: 448×314; field of view: 320 mm); and post-contrast sagittal and coronal images. A 10-cc bolus of gadoteridol (ProHance, Bracco Imaging, Milan, Italy) was intravenously injected to each patient.
3.3. Imaging Analysis
Each imaging study was reviewed by a radiologist with 16 years of experience working with breast cancer patients. To avoid the impact of other imaging results, each imaging study was reviewed independently with two-week intervals. The breast composition was classified according to the Breast Imaging Reporting and Data system (BI-RADS) (American College of Radiology, Reston, VA, USA). Breast compositions “a” and “b” were classified as fatty, whereas breast compositions “c” and “d” were classified as dense. The patients were divided into two age groups: (1) elderly group (≥ 60 years); and (2) younger group (< 60 years). Also, the mammographic lesions were classified into the following types: (1) a mass with or without calcifications; (2) only calcifications; and (3) occult lesions invisible on MG.
To determine the tumor size, the longest diameter was considered in each imaging modality. On MRI, the longest diameter among the first dynamic axial, post-contrast sagittal, and post-contrast coronal images was determined as the tumor size by MRI. After tumor size measurements by MG, US, and MRI, they were compared with the size measurement of a pathologically confirmed tumor. Differences in tumor size between imaging and pathological findings were classified as > 0.5 cm or ≤ 0.5 cm; a size difference of ≤ 0.5 cm was defined as concordance. The tumor T stage was determined based on the largest tumor size.
3.4. Histopathology of Breast Cancer
The pathological characteristics of breast cancer investigated in this study were as follows: surgical method, lesion size, T stage, estrogen receptor (ER), progesterone receptor (PR), human epidermal growth factor receptor 2 (HER2), histological grade, ductal carcinoma in situ (DCIS) component, phenotype, and tumor histology. The ER and PR were considered positive if nuclear staining was observed in more than 1% of the nuclei. The HER2 expression was classified as negative when the immunohistochemical staining score was negative or 1+. On the other hand, a staining score of 3+ was classified as HER2-positive. If the staining score was 2+, fluorescence in situ hybridization (FISH) was performed to confirm gene amplification.
The tumor grade was classified according to the modified Black nuclear grade. Moreover, the phenotypes were classified into the following categories: luminal A (ER-positive and/or PR-positive, and HER2-negative); luminal B (ER-positive and/or PR-positive, and HER2-positive); HER2-enriched (ER-negative, PR-negative, and HER2-positive); and triple-negative (ER-negative, PR-negative, and HER2-negative). E-cadherin staining was used to differentiate between lobular and ductal carcinomas.
3.5. Data Analysis
The clinicopathological characteristics of the patients were summarized as mean and standard deviation (SD) for age and lesion size and as number and percentage for other variables. Student’s t-test was performed to compare continuous variables. Chi-square and Fisher’s exact tests were performed to compare categorical variables and differences in tumor size measurements by the imaging modalities. To determine the tumor T stage, agreement between the results of imaging and pathology was examined. The kappa coefficient was used to measure agreement. The degree of agreement was evaluated based on the following criteria: slight, 0 - 0.2; fair, 0.2 - 0.4; moderate, 0.4 - 0.6; substantial, 0.6 - 0.8; and almost perfect, 0.8 - 1.0 (11). Moreover, the sensitivity, specificity, and accuracy of each imaging modality for identifying T stages ≥ 2 were measured. Multivariate logistic regression analysis was performed to identify the predictors of differences in tumor size measurements. Statistical analyses were performed using Jamovi version 1.2.22 (Jamovi Project, Sydney, Australia) (12). The level of statistical significance was set at P < 0.05.
4. Results
4.1. Clinicopathological Characteristics of the Patients
The mean age of the patients was 63.1 ± 9.82 years (range: 50-88 years). The elderly group included 78 patients aged ≥ 60 years (56.9%), while the younger group consisted of 59 patients < 60 years (43.1%). The elderly group included 56 fatty breasts (20 a + 36 b categories) and 22 dense breasts (22 c + 0 d categories), while the younger group included 10 fatty breasts (0 a + 10 b categories) and 49 dense breasts (39 c + 10 d categories) (P < 0.001). In terms of the lesion types, the frequency of masses with or without calcification was higher in the elderly group, whereas the frequency of only calcifications and occult lesions was higher in the younger group (P < 0.001). The most common histology was invasive ductal carcinoma (IDC) (110/137, 80.3%), followed by invasive lobular carcinoma (ILC) (9/137, 6.6%), invasive tubular carcinoma (5/137, 3.6%), and other histological types (13/137, 9.5%). Table 1 summarizes the clinicopathological characteristics of the patients.
| Characteristics | Total (n = 137) | Age, y | P-value | |
|---|---|---|---|---|
| ≥ 60 (n = 78) | < 60 (n = 59) | |||
| Age, y | 63.1 ± 9.82 | 70.0 ± 7.34 | 54.1 ± 2.94 | |
| Breast density | < 0.001 | |||
| Fatty | 66 (48.2) | 56 (71.8) | 10 (16.9) | |
| Dense | 71 (51.8) | 22 (28.2) | 49 (83.1) | |
| Lesion type on MG | < 0.001 | |||
| Mass with or without calcifications | 102 (74.5) | 72 (92.3) | 30 (50.8) | |
| Calcifications only | 18 (13.1) | 5 (6.4) | 13 (22.0) | |
| Occult lesion | 17 (12.4) | 1 (1.3) | 16 (27.1) | |
| Surgery | 0.377 | |||
| BCS | 87 (63.5) | 52 (66.7) | 35 (59.3) | |
| Mastectomy | 50 (36.5) | 26 (33.3) | 24 (40.7) | |
| Estrogen receptor | 0.424 | |||
| Negative | 46 (33.6) | 24 (30.8) | 22 (37.3) | |
| Positive | 91 (66.4) | 54 (69.2) | 37 (62.7) | |
| Progesterone receptor | 0.611 | |||
| Negative | 57 (41.6) | 31 (39.7) | 26 (44.1) | |
| Positive | 80 (58.4) | 47 (60.3) | 33 (55.9) | |
| HER2 | 0.102 | |||
| Negative | 96 (70.1) | 59 (75.6) | 37 (62.7) | |
| Positive | 41 (29.9) | 19 (24.4) | 22 (37.3) | |
| Histological grade | 0.055 | |||
| Low | 16 (11.7) | 9 (11.5) | 7 (11.9) | |
| Intermediate | 66 (48.2) | 43 (55.1) | 23 (39.0) | |
| High | 39 (28.5) | 16 (20.5) | 23 (49.0) | |
| NA | 16 (11.7) | 10 (12.8) | 6 (10.2) | |
| DCIS component | 0.770 | |||
| Negative | 53 (38.7) | 31 (39.7) | 22 (37.3) | |
| Positive | 84 (61.3) | 47 (60.3) | 37 (62.7) | |
| Phenotype | 0.415 | |||
| Luminal A | 76 (55.5) | 46 (59.0) | 30 (50.8) | |
| Luminal B | 18 (13.1) | 8 (10.3) | 10 (16.9) | |
| HER2-enriched | 23 (16.8) | 11 (14.1) | 12 (20.3) | |
| Triple-negative | 20 (14.6) | 13 (16.7) | 7 (11.9) | |
| Histology | 0.423 | |||
| Invasive ductal carcinoma | 110 (80.3) | 64 (82.1) | 46 (78.0) | |
| Invasive lobular carcinoma | 9 (6.6) | 5 (6.4) | 4 (6.8) | |
| Invasive tubular carcinoma | 5 (3.6) | 2 (2.6) | 3 (5.1) | |
| Invasive micropapillary carcinoma | 4 (2.9) | 3 (3.8) | 1 (1.7) | |
| Mucinous carcinoma | 3 (2.2) | 0 (0.0) | 3 (5.1) | |
| Invasive solid papillary carcinoma | 3 (2.2) | 2 (2.6) | 1 (1.7) | |
| Medullary carcinoma | 1 (0.7) | 1 (1.3) | 0 (0.0) | |
| Invasive metaplastic carcinoma | 1 (0.7) | 0 (0.0) | 1 (1.7) | |
| Adenoid cystic carcinoma | 1 (0.7) | 1 (1.3) | 0 (0.0) | |
Clinicopathological Characteristics of the Patientsa
4.2. Analysis of Tumor Size Measurements
On MRI, tumor size differences of ≤ 0.5 cm were significantly higher in the elderly group than in the younger group (75.7% vs. 54.5%; P = 0.013) (Table 2). The agreement of tumor T stage between MRI and pathology was also higher in the elderly group than in the younger group (kappa coefficient = 0.818 vs. 0.386) (Table 3). Regarding the diagnostic performance of MRI for T stages ≥ 2, the sensitivity, specificity, and accuracy were all higher in the elderly group than in the younger group (1.000, 0.875, and 0.914 vs. 0.800, 0.657, and 0.709, respectively) (Table 4).
| Differences | Total | Age, y | Age + density | Age + density + lesion type | |||
|---|---|---|---|---|---|---|---|
| ≥ 60 | < 60 | ≥ 60 years | ≥ 60 years + mass | ||||
| Fatty | Dense | Fatty | Dense | ||||
| MG vs. pathology | |||||||
| Number | 120 | 77 | 43 | 56 | 21 | 53 | 19 |
| ≤ 0.5 | 73 (60.8) | 57 (74.0) | 16 (37.2) | 46 (82.1) | 11 (52.4) | 46 (86.8) | 10 (52.6) |
| > 0.5 | 47 (39.2) | 20 (26.0) | 27 (62.8) | 10 (17.9) | 10 (47.6) | 7 (13.2) | 9 (47.4) |
| P-value | < 0.001 | 0.008 | 0.004 | ||||
| US vs. pathology | |||||||
| Number | 136 | 78 | 58 | 56 | 22 | 53 | 19 |
| ≤ 0.5 | 83 (61.0) | 52 (66.7) | 31 (53.4) | 41 (73.2) | 11 (50.0) | 40 (75.5) | 9 (47.4) |
| > 0.5 | 53 (39.0) | 26 (33.3) | 27 (46.6) | 15 (26.8) | 11 (50.0) | 13 (24.5) | 10 (52.6) |
| P-value | 0.118 | 0.050 | 0.043 | ||||
| MRI vs. pathology | |||||||
| Number | 125 | 70 | 55 | 50 | 20 | 47 | 17 |
| ≤ 0.5 | 83 (66.4) | 53 (75.7) | 30 (54.5) | 42 (84.0) | 11 (55.0) | 42 (89.4) | 10 (58.8) |
| > 0.5 | 42 (33.6) | 17 (24.3) | 25 (45.5) | 8 (16.0) | 9 (45.0) | 5 (10.6) | 7 (41.2) |
| P-value | 0.013 | 0.011 | 0.011 | ||||
| Agreement | Total | Age, y | Age + Density | Age + density + lesion type | |||
|---|---|---|---|---|---|---|---|
| ≥ 60 | < 60 | ≥ 60 years | ≥ 60 years + mass | ||||
| Fatty | Dense | Fatty | Dense | ||||
| MG | |||||||
| Number | 120 | 77 | 43 | 56 | 21 | 53 | 19 |
| Kappa | 0.485 | 0.560 | 0.356 | 0.697 | 0.200 | 0.747 | 0.329 |
| US | |||||||
| Number | 136 | 78 | 58 | 56 | 22 | 53 | 19 |
| Kappa | 0.577 | 0.708 | 0.420 | 0.794 | 0.505 | 0.820 | 0.553 |
| MRI | |||||||
| Number | 125 | 70 | 55 | 50 | 20 | 47 | 17 |
| Kappa | 0.611 | 0.818 | 0.386 | 0.822 | 0.800 | 0.898 | 0.881 |
Agreement of Tumor T Stage Between Imaging and Pathological Findingsa
| Diagnostic performance | Total | Age, y | Age + density | Age + density + lesion type | |||
|---|---|---|---|---|---|---|---|
| ≥ 60 | < 60 | ≥ 60 years | ≥ 60 years + mass | ||||
| Fatty | Dense | Fatty | Dense | ||||
| MG | |||||||
| Sensitivity | 0.756 | 0.731 | 0.790 | 0.882 | 0.444 | 0.875 | 0.500 |
| Specificity | 0.747 | 0.824 | 0.583 | 0.846 | 0.750 | 0.892 | 0.818 |
| Accuracy | 0.750 | 0.792 | 0.674 | 0.857 | 0.619 | 0.887 | 0.684 |
| US | |||||||
| Sensitivity | 0.729 | 0.769 | 0.682 | 0.882 | 0.556 | 0.875 | 0.625 |
| Specificity | 0.864 | 0.942 | 0.750 | 0.949 | 0.923 | 0.973 | 0.909 |
| Accuracy | 0.816 | 0.885 | 0.724 | 0.929 | 0.773 | 0.943 | 0.790 |
| MRI | |||||||
| Sensitivity | 0.905 | 1.000 | 0.800 | 1.000 | 1.000 | 1.000 | 1.000 |
| Specificity | 0.783 | 0.875 | 0.657 | 0.889 | 0.833 | 0.941 | 0.900 |
| Accuracy | 0.824 | 0.914 | 0.709 | 0.920 | 0.900 | 0.957 | 0.941 |
Diagnostic Performance of the Imaging Studies in Identifying T Stages ≥ 2a
T-stage agreement between MRI and pathology was higher than US or MG (kappa coefficient = 0.818 for MRI vs. 0.708 and 0.560 for US and MG, respectively) (Table 3). Regarding the diagnosis of T stages ≥ 2 in elderly patients, MRI showed the highest sensitivity (MRI: 1.000; US: 0.769; and MG: 0.731) and accuracy (MRI: 0.914; US: 0.885; and MG: 0.792), while US showed the highest specificity (MRI: 0.875; US: 0.942; and MG: 0.824) (Table 4).
4.3. Predictors of Tumor Size Differences
In the multivariate logistic regression analysis, lesion type was found to be a contributing factor for tumor size differences in all imaging studies. Calcification type was more likely to show a tumor size difference of > 0.5 cm compared to mass type on MG (odds ratio [OR] = 17.136, P < 0.001), US (OR = 4.276, P = 0.043), and MRI (OR = 3.978, P = 0.047). Breast density affected tumor size differences in MG and MRI. Dense breasts were more likely to show a tumor size difference of > 0.5 cm compared to fatty breasts on MG (OR = 3.163, P = 0.025) and MRI (OR = 4.086, P = 0.016). Moreover, the histological grade affected tumor size differences on US. Compared to histological grade 1, grade 3 showed a higher probability of differences > 0.5 cm (OR = 8.888, P = 0.021) (Table 5).
| Predictors | Estimate | Standard error | P-value | Odds ratio | 95% confidence interval | |
|---|---|---|---|---|---|---|
| Lower | Upper | |||||
| MG vs. pathology | ||||||
| Breast density | 1.151 | 0.516 | 0.025 | 3.163 | 1.151 | 8.688 |
| Lesion type (c/m) | 2.841 | 0.816 | < 0.001 | 17.136 | 3.462 | 84.820 |
| US vs. pathology | ||||||
| HG (3/1) | 2.184 | 0.949 | 0.021 | 8.888 | 1.384 | 57.083 |
| Lesion type (c/m) | 1.453 | 0.718 | 0.043 | 4.276 | 1.046 | 17.473 |
| MRI vs. pathology | ||||||
| Breast density | 1.407 | 0.582 | 0.016 | 4.086 | 1.306 | 12.783 |
| Lesion type (c/m) | 1.380 | 0.696 | 0.047 | 3.978 | 1.016 | 15.571 |
Multivariate Logistic Regression Analysis for Predicting Tumor Size Differences > 0.5 cma
4.4. Comparison of Tumor Size in Respect of Breast Density and Lesion Type
In a comparison of tumor size measurements, by adding breast density to age group as predictors, the percentage of differences ≤ 0.5 cm further increased on MG (46/56, 82.1%) and MRI (42/50, 84.0%) in the elderly group with fatty breasts. With the addition of lesion type as a predictor, the elderly group with fatty breasts and mass-type lesions showed the highest percentage of differences ≤ 0.5 cm on MG (46/53, 86.8%), US (40/53, 75.5%), and MRI (42/47, 89.4%) (Figures 1 and 2, and Table 2).
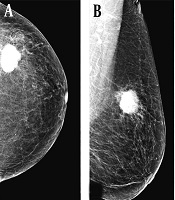
 was almost entirely fatty. The left craniocaudal and mediolateral oblique views showed a round hyperdense mass with a microlobulated margin in the left upper outer breast; C, The transverse ultrasound revealed an irregular hypoechoic mass with a microlobulated and angular margin; D, Contrast-enhanced axial breast MRI showed an oval heterogeneous enhancing mass in the left deep portion of the breast near the pectoralis muscle. The patient underwent breast-conservation surgery, and the lesion was confirmed as invasive ductal carcinoma (IDC). The pathological size of the mass was 2.7 cm. The mass size was measured to be 2.7, 2.3, and 2.8 cm on MG, ultrasound, and breast MRI, respectively.")
A 67-year-old woman visited our hospital with a complaint of a left breast mass. A and B, The breast composition on mammography (MG) was almost entirely fatty. The left craniocaudal and mediolateral oblique views showed a round hyperdense mass with a microlobulated margin in the left upper outer breast; C, The transverse ultrasound revealed an irregular hypoechoic mass with a microlobulated and angular margin; D, Contrast-enhanced axial breast MRI showed an oval heterogeneous enhancing mass in the left deep portion of the breast near the pectoralis muscle. The patient underwent breast-conservation surgery, and the lesion was confirmed as invasive ductal carcinoma (IDC). The pathological size of the mass was 2.7 cm. The mass size was measured to be 2.7, 2.3, and 2.8 cm on MG, ultrasound, and breast MRI, respectively.
 was heterogeneously dense. The left craniocaudal and mediolateral oblique views showed grouped microcalcifications in the left outer central deep region of the breast (white arrows); C, The anti-radial ultrasound revealed an irregular hypoechoic mass with spiculated margins and microcalcifications; D, Contrast-enhanced sagittal breast MRI showed a regional heterogeneous non-mass enhancement in the left central portion of the breast. The patient underwent a modified radical mastectomy, and the lesion was confirmed as invasive ductal carcinoma (IDC) and ductal carcinoma in situ (DCIS). The pathological size of the lesion was 3 cm. The lesion size was measured to be 1.1, 1.7, and 3.5 cm on MG, ultrasound, and breast MRI, respectively.")
A 78-year-old woman visited our hospital due to abnormal mammographic findings. A and B, The breast composition on mammography (MG) was heterogeneously dense. The left craniocaudal and mediolateral oblique views showed grouped microcalcifications in the left outer central deep region of the breast (white arrows); C, The anti-radial ultrasound revealed an irregular hypoechoic mass with spiculated margins and microcalcifications; D, Contrast-enhanced sagittal breast MRI showed a regional heterogeneous non-mass enhancement in the left central portion of the breast. The patient underwent a modified radical mastectomy, and the lesion was confirmed as invasive ductal carcinoma (IDC) and ductal carcinoma in situ (DCIS). The pathological size of the lesion was 3 cm. The lesion size was measured to be 1.1, 1.7, and 3.5 cm on MG, ultrasound, and breast MRI, respectively.
In a comparison of T-stage agreement by adding the predictors, the elderly group with fatty breasts and mass-type lesions showed the highest T-stage agreement in all imaging studies, with an almost perfect agreement on US (kappa coefficient = 0.820) and MRI (kappa coefficient = 0.898) (Table 3). Regarding the diagnostic performance of T stages ≥ 2, the specificity and accuracy of all imaging modalities were the highest in elderly patients with fatty breasts and mass-type lesions. Among the evaluated modalities, MRI showed the highest sensitivity, while US showed the highest specificity. The accuracy of MRI and US was similar in the elderly patients (Table 4).
5. Discussion
The use of breast MRI has steadily increased in recent years for various indications. Stout et al. (13) investigated the trends of breast MRI, based on the automated medical claims data from Harvard Pilgrim Health Care (HPHC, USA). The frequency of breast MRI increased by almost 16 folds from 16.5 per 10,000 women in 2000 to 104.8 per 10,000 in 2011. Regarding the indications for MRI, the use of this modality for diagnosis and treatment increased from 14.9 per 10,000 women in 2003 to 44.4 per 10,000 in 2011. Killelea et al. (14) used the surveillance, epidemiology, and end results (SEER)-Medicare Linked Database from 2000 to 2009 and reported the increased use of breast MRI from 0.8% in 2000-2001 to 25.2% in 2008 - 2009. They reported that the age-specific rates followed similar trends, with an increase over time across all ages (13, 14).
The advantages of preoperative breast MRI include the accurate measurement of lesion size, detection of additional lesions, and evaluation of axillary lymph nodes; nevertheless, it does not provide equal benefits for all patients. Among various conditions, MRI was useful for the premenopausal state, high breast density, and lobular histology (15-18). Given these limitations, many guidelines have recommended the selective use of breast MRI (19-21). Elderly patients often have a menopausal state and low breast density, which are assumed to reduce the benefits of MRI for this group compared to younger patients. Pilewskie et al. (10) reported that the benefits of MRI were the highest in patients with an occult primary cancer, whereas MRI was not beneficial in evaluating the extent of lesions in elderly breast cancer patients aged ≥ 70 years.
In this study, the accuracy of tumor size measurements by MRI was examined in elderly patients and compared with conventional imaging studies. The predictors of the accuracy of tumor size measurements were also investigated in different imaging studies. MG and MRI showed a significantly higher probability of tumor size differences ≤ 0.5 cm in patients aged ≥ 60 years. In the assessment of T stage, the agreement between imaging and pathology and the diagnostic performance of each imaging modality were found to be higher for patients aged ≥ 60 years.
The higher accuracy of tumor size measurements in the elderly was assumed to be related to the characteristic features of this age group. As shown in Table 1, the ratio of fatty breasts and mass-type lesions was significantly higher in the elderly group. In the multivariate logistic regression analysis, the breast density and lesion type were found to be important predictors of tumor size differences; the lesion type especially affected tumor size measurements in all imaging studies. The imaging and pathological findings showed the highest T-stage agreement in patients aged ≥ 60 years with fatty breasts and mass-type lesions. Similarly, the sensitivity, specificity, and accuracy of imaging modalities were the highest in these patients.
It is well-established that breast density affects lesion detection, and the degree of lesion masking in dense breasts is speculated to affect tumor size measurements. Breast density is thought to be related to not only lesion detection and size measurements by MG, but also size measurements by US, based on the background parenchymal echotexture. Ko et al. (22) reported that tumor size could be measured accurately in patients with the following clinicopathological features: age > 50 years, postmenopausal state, tumor size < 2 cm, a homogeneous parenchymal echo pattern, and no DCIS component. Among the features, a homogeneous parenchymal echo pattern was associated with the following characteristics: age ≥ 50 years, postmenopausal state, fatty breasts, and minimal/mild background parenchymal enhancement on MRI. Kim et al. (23) reported that mammographic density and parity were significantly correlated with the background parenchymal echo. The background parenchymal echo was more heterogeneous in dense breasts. This indicates that mammographic density was strongly related to the background parenchymal echotexture of US, affecting tumor size measurements. On the other hand, Khalayleh et al. (24) reported no significant difference in tumor size measurements between imaging and pathological findings in respect of breast density. Nevertheless, it should be noted that they measured the mean tumor size in all patients and compared the mean radiographic tumor size with the mean pathological tumor size. In the present study, tumor size differences were measured in each patient. The results directly reflected tumor size differences at an individual level. Previous studies reported that the background parenchymal enhancement on MRI is not particularly related to mammographic density in both pre- and postmenopausal states (25, 26). Regardless of the effect of background parenchymal enhancement on tumor size measurements, MRI seemed to increase the accuracy of measurements in fatty breasts in the present study.
The most frequent histology of breast cancer in the current study was IDC, followed by ILC. Although ILC is a histology type that benefits from MRI (21), this carcinoma was found in a small proportion of patients in our study, and it did not significantly affect tumor size measurements. Regarding tumor grades, histological grade 3 was associated with tumor size differences > 0.5 cm in the US measurements. According to previous studies, a high tumor grade is related to the sonographic features of a strong posterior enhancement, weak shadowing, and a circumscribed margin (27, 28). These sonographic features were reported to improve the accuracy of lesion size measurements, whereas in our study, a contradictory trend was found. Ko et al. also reported that the accuracy of tumor size measurements did not vary depending on the histological grade (22); however, this finding requires validation in future research.
The present study had some limitations. First, this was a retrospective study that only included patients from a single institution. Second, the review of imaging studies was performed by a radiologist, which might have caused a selection or interpretation bias. Third, histological evaluations were insufficient due to the small sample size. Finally, although ILC was the main tumor that benefited from MRI, it was only found in 6.6% of the patients in our study, which is insufficient for proper analysis.
In conclusion, the accuracy of tumor size measurements by MRI was higher in patients aged ≥ 60 years. Breast density and lesion type affected tumor size measurements in the imaging studies. The accuracy of tumor size measurements increased in elderly breast cancer patients with non-dense breasts and mass-type lesions. In the assessment of tumor T stage, MRI showed the highest sensitivity, while US showed the highest specificity.
