


1. Background
Today, dementia is one of the most important healthcare challenges. In 2019, there were more than 50 million people living with dementia globally, as estimated by the Alzheimer’s Disease International (ADI). During the pathological process of Alzheimer’s disease (AD), beta-amyloid accumulation starts 10 to 15 years before the development of cognitive disorder, and there is no known treatment after complete neurodegeneration (1). Until recently, AD was diagnosed based on the criteria proposed by the National Institute of Neurological and Communicative Disorders and Stroke (NINCDS) and the Alzheimer's Disease and Related Disorders Association (ADRDA) published in 1984 (2). The sensitivity of these criteria was estimated at 81%, and they were revised in 2011 (3). Nevertheless, a definite diagnosis can be only made according to the postmortem or pathological studies of the brain. Besides the clinical criteria used by clinicians, research criteria and biomarkers, such as amyloid positron emission tomography (PET) imaging and cerebrospinal fluid (CSF) measurements, may predict pathologies in the preclinical stage (4).
Cerebral blood flow (CBF) is associated with changes in an individual’s cognitive performance, as well as the risk of dementia, as reported in the literature (5). The arterial spinal labelling (ASL) magnetic resonance imaging (MRI) technique is alternatively used for CBF measurements in longitudinal studies (6). This technique has been effectively used to detect pathologies other than dementia (7), including brain tumors (8), acute stroke (9), occlusive cerebrovascular diseases (10), and epilepsy (11). However, validation is needed in the clinical setting in future research on different pathological disorders (12).
2. Objectives
This study aimed to examine the feasibility and variability of perfusion maps derived from pulsed arterial spin labeling (PASL) MRI in a heterogeneous group of patients with cognitive disorders.
3. Patients and Methods
3.1. Study Population
Individuals with a suspected cognitive disorder (reported by the person or a close family member) were included in this study. The exclusion criteria were as follows: contraindications for MRI; the presence of a known neurological disorder affecting cognitive functions; baseline MRI findings, indicating multi-infarct dementia, normal pressure hydrocephalus, or a brain tumor; history of psychotic disorders or major depression; alcohol or substance abuse; and abnormal laboratory findings interfering with the study.
Out of 134 patients with cognitive disorders, 85 patients (38 males and 47 females), admitted to the neurology and neuroradiology clinics of our hospital, were included. Thirty-one patients were diagnosed with depression, and seven patients were diagnosed with a subjective memory impairment (SMI) (patients without neuropsychological defects and normal mental examinations, but with complaints of cognitive disorders). The patients were classified into groups of mild cognitive impairment (MCI), AD, depression, and SMI, based on the clinical diagnosis before ASL MRI (Table 1).
| Diagnosis | Male (n) | Female (n) | Average MMSE score | Mean age | Total (n) |
|---|---|---|---|---|---|
| AD | 11 | 12 | 26.3 | 79 | 23 |
| MCI | 13 | 11 | 28.4 | 62 | 24 |
| Depression & SMI | 14 | 24 | 29.5 | 46.5 | 38 |
Abbreviations: AD, Alzheimer’s disease; MCI, mild cognitive impairment; Depression & SMI, depression and subjective memory impairment; MMSE, mini-mental state examination.
This cross-sectional study was approved by the institutional ethics committee. Informed consent forms for routine MRI, including permission for using images pertaining to the patients anonymously, were obtained.
3.2. Neurological Examinations
All patients were evaluated by a neurologist in a mental examination, and a neuropsychological evaluation was performed by a psychologist. The standard neuropsychological test batteries included personal and general information, as well as orientation to time, place, and person, digit span performance, mental control, mathematical skills, abstract thinking, fluency, similarity tests, judgment testing, visual memory, clock drawing test, and verbal learning test for verbal memory. Also, mental examinations included the mini-mental state examination (MMSE) and either Addenbrooke’s cognitive examination-revised (ACE-R) or Montreal cognitive assessment (MoCA), based on the clinical decision.
The diagnoses of AD and MCI were established based on the clinical criteria, according to the results of mental examinations, clinical dementia rating (CDR), and neuropsychological tests. Depression was also screened using Beck’s Depression Inventory. The average MMSE score was calculated for each group and measured to be 28.4 for the MCI group, 26.3 for the AD group, and 29.5 for the depression and SMI groups. Besides, the patients underwent hemogram tests, liver panel tests, and thyroid function tests, and the levels of vitamin B12, cholesterol, folic acid, electrolytes, and vitamin D were measured.
3.3. MRI Technique and Examination
All MRI procedures were performed using a 3T Magnetom Skyra (Siemens AG Healthcare, Erlangen, Germany) with a 24- or 32-channel head coil. For morphological examinations, routine T1- and T2-weighted images were acquired in three orthogonal planes at a 1.0 mm isotropic resolution (1 mm slices), using a Magnetization Prepared Rapid Acquisition Gradient Echo (MPRAGE) sequence. Moreover, structural scales were used to measure atrophy and white matter density, including the global cortical atrophy (GCA) scale, Fazekas white matter scale, medial temporal lobe atrophy scale, Koedam parietal lobe scale, and the National Institute of Neurological Disorders and Stroke-Association International pour la Recherche et l'Enseignement en Neurosciences (NINDS-ARIEN) criteria for vascular infarcts and white matter lesions.
In this study, 3D PASL MRI images were acquired with flow-sensitive alternating inversion recovery (FAIR) labeling and QII saturation, combined with a 3D turbo gradient- and spin-echo (3DGRASE) readout, based on the following parameters: single inversion time (TI), 1800 ms and bolus duration, 700 ms (one slab with 38 slices with a 4-mm thickness in two measurements). Also, single-shot echo-planar imaging (EPI) was performed with an EPI factor of 21, a turbo factor of 18, a flip angle of 180, a bandwidth of 2,604 Hz/Px, echo spacing of 0.5, and TR/TE of 5000/15.72 ms, with no partial Fourier imaging and a three-minute acquisition time.
The labeling slap was located parallel to the morphological image planes. After acquiring two control and two tagged images, inline calculation of CBF maps (matrix size, 128 × 128; 3.6 × 3.6 × 4 mm) was performed automatically in the voxel plane using subtraction with a t-test. The qualitative perfusion images were first analyzed by optimal windowing and then co-registered with MPRAGE images on a Syngo workstation (Siemens AG, Berlin, Germany) for further evaluation. The color perfusion maps were inspected for all brain sections. All images were reviewed by two experienced neuroradiologists with the European Diploma in Neuroradiology. They were blinded to the ASL MRI indications of all patients and were asked to evaluate all lobes visually, particularly for the presence of hypoperfusion in the posterior parietal lobes, which is typical of AD. Next, the readers re-evaluated the images blindly long after the first evaluation (minimum of a two-year interval) to measure reproducibility. In this qualitative ASL MRI study, brain normalization methods with template images and correction of cortical atrophy were not needed, similar to CBF quantification studies.
3.4. Statistical Analysis
Statistical tests were performed to evaluate qualitative data on CBF maps after dichotomization of perfusion patterns, such as normal perfusion and hypoperfusion. Chi-square test was used to compare bilateral parietal hypoperfusion between the groups. The Minitab 17.2.1 software (LEADTOOLS© 1991-2002, Lead Technologies, Inc., USA) was used for data analysis. A 95% confidence interval (CI) was considered to represent the effect size. Moreover, Tukey’s post-hoc range test was used to evaluate observer agreement. The inter-observer agreement was expressed by kappa coefficients. The Fleiss’s kappa values were above 0.75, indicating an excellent agreement.
4. Results
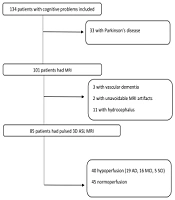
Out of 134 individuals with cognitive disorders, 85 patients with cognitive tests and MRI results, including pulsed 3D ASL sequences, were included in this study (Figure 1). The patients were divided into groups according to the results of mental examination and neuropsychiatric tests, based on which a diagnosis was established. Structural MRI was performed to rule out other causes of memory problems (e.g., hydrocephalus, tumor, stroke, and vascular dementia) and support the diagnosis of AD according to structural clues, such as hippocampal or global atrophy. As shown in the flowchart (Figure 1), three patients with vascular dementia and 11 patients with hydrocephalus were excluded from the study based on the morphological assessments. All AD patients had medial temporal lobe atrophy (MTA) scores > 2, although it was not a specific finding for diagnosis. Regarding other morphological criteria, MTA was not evaluated, as it was out of the scope of this study.
.")
The flowchart of patient enrollment (MRI, magnetic resonance imaging; ASL, arterial spinal labelling; AD, Alzheimer’s disease; MCI, mild cognitive impairment; SMI, subjective memory impairment).
The ASL control and tagged images were first evaluated for artifacts, such as motion and susceptibility, and then, inline calculation of CBF maps was performed (Figure 2). The ASL perfusion map results were classified as normal, hypoperfusion, and hyperperfusion. All hypoperfusion patterns were bilateral parietal hypoperfusion (in the parietal lobe and posterior cingulate gyrus). None of the maps indicated hyperperfusion, while 40 patients showed hypoperfusion. The patterns of hypoperfusion and normoperfusion were also compared between the groups (Figure 3).
 images show bilateral parietal hypoperfusion derived from; B, Two control and two tagged images.")
A, Inline-calculated cerebral blood flow (CBF) images show bilateral parietal hypoperfusion derived from; B, Two control and two tagged images.
 maps coregistered on Magnetization Prepared Rapid Acquisition Gradient Echo (MPRAGE) images; A, Using a Neuro 3D task on a Syngo platform; B, Normoperfusion in a depressed patient compared to; C, Hypoperfusion in the bilateral parietal lobes in an Alzheimer’s disease (AD) patient.")
Cerebral blood flow (CBF) maps coregistered on Magnetization Prepared Rapid Acquisition Gradient Echo (MPRAGE) images; A, Using a Neuro 3D task on a Syngo platform; B, Normoperfusion in a depressed patient compared to; C, Hypoperfusion in the bilateral parietal lobes in an Alzheimer’s disease (AD) patient.
The ratio of patients with bilateral parietal hypoperfusion was the highest in the AD group (83%) and the lowest in the depression group (13%), while it was null in the SMI group. The results showed that the corresponding ratio was significant in the AD and MCI groups (P < 0.01) as compared to patients with depression and SMI (95% CI: 61.22 - 95.05, 44.68 - 84.37, and 4.41 - 28.09, respectively). There was no significant difference between the AD and MCI groups regarding the rate of bilateral parietal hypoperfusion (67%). The depression and SMI groups had no cognitive deficits based on the neuropsychiatric tests (Table 2).
| Diagnosis (n) | Total | Hypoperfusion (n) | Hypoperfusion (%) | Confidence interval (95%) |
|---|---|---|---|---|
| AD | 23 | 19 | 82.61 | 61.22 - 95.05 |
| MCI | 24 | 16 | 66.67 | 44.68 - 84.37 |
| Depression & SMI | 38 | 5 | 13.16 | 4.41 - 28.09 |
Abbreviations: MRI, magnetic resonance imaging; PASL, pulsed arterial spinal labelling; AD, Alzheimer’s disease; MCI, Mild cognitive impairment; Depression & SMI, Depression and subjective memory impairment.
Complete agreement was found in 89% of the total population; the expected agreement was 0.50. Interobserver agreement was also determined by measuring the kappa coefficient (0.78; 95% CI: 0.65 - 0.91). The post-hoc test revealed that agreement was the highest in the depression + SMI group and the lowest in the MCI group (92 and 83%, respectively). The observed agreement was 88% in the AD group (Table 3).
| Variables | Observer 2 | Total | |
|---|---|---|---|
| Hypoperfusion (n) | Normoperfusion (n) | ||
| Observer 1 | |||
| Hypoperfusion (n) | 36 | 5 | 41 |
| Normoperfusion (n) | 4 | 40 | 44 |
| Total | 40 | 45 | 85 |
Abbreviations: MRI, magnetic resonance imaging; PASL, pulsed arterial spinal labelling.
5. Discussion
This study was conducted on patients with cognitive disorders, who had been provisionally diagnosed with AD, MCI, depression, or SMI, based on the mental examinations and neuropsychiatric tests performed by the neurologists. All patients underwent PASL MRI. The CBF maps were visually evaluated by the neuroradiologists for brain perfusion. The results of the present study are twofold. First, bilateral parietal hypoperfusion on inline-calculated CBF maps, derived from 3D PASL MRI, was significant in the AD and MCI groups. The hypoperfusion rate was more remarkable in the AD group compared to the MCI group. On the other hand, the rate of hypoperfusion was significantly low in the depression group and even null in the SMI group. These results have been approved in many clinical and research studies, including a preliminary comparative prospective study by Johnson et al. (13).
Biomarkers, such as the CSF amyloid and tau levels, are used in research, and occasionally, for approving a clinical diagnosis. These methods require lumbar puncture, which can be challenging for the elderly and uncooperative patients. However, well-established non-invasive markers, including fluorodeoxyglucose (FDG) PET and PET with ligands that bind to fibrillar amyloid plaques are not readily available, affordable, or rapid methods. Although PET scan of amyloid-beta ligands and CSF biomarkers has high sensitivity for early AD (14), it shows limited sensitivity for clinical staging and disease progression follow-up (15). Since its application along with prodromal and clinical biomarkers of neurodegeneration for AD, FDG PET has shown a great potential for early detection and monitoring of AD (16). In a recent study, ASL was shown to be a reliable and cost-effective alternative to 18F-FDG PET in clinical research (17).
ASL MRI, as a functional PET technique, uses magnetically labeled blood protons as a tracer to measure brain perfusion without exposure to ionizing radiation (18). In this technique, there is no need for an exogeneous tracer (decaying in a specific period). ASL adds less than three minutes to the routine structural MRI procedure for cognitive disorders. The duration of the procedure was two minutes and five seconds for all patients in our daily practice. There has been an approximately 0.50% decline per year in CBF in healthy older individuals, as found in an ASL MRI study (19). Likewise, by using CBF as a biomarker, we can predict the future cognitive function of the elderly population (20).
The cognitive changes in the elderly population may be related to decreased CBF and reduced supply of oxygen and nutrients in the cerebral gray matter during the accumulation of metabolic products (21). In ASL MRI of AD patients, hypoperfusion is typically detected in the temporoparietal cortex, posterior cingulate cortex, and precuneus; these cognitive areas are specific to memory (22). The finding indicating a reduction in CBF agrees with previous metabolism studies using PET, which are more extensive (23). Also, ASL MRI is a useful predictor of conversion from MCI to AD (24). Studies show that ASL MRI is a sensitive method, even in the preclinical stages of AD. Hypoperfusion in the posterior cingulate cortex was detected in healthy elderly people with cognitive impairments in an 18-month period (25).
Similarly, FDG PET may be a strong predictor of conversion from MCI to AD up to 24 months before the emergence of clinical symptoms (26). Besides, ASL MRI, which appears to be sensitive to disease progression, can be used as a measure of response to treatment (27). Based on the findings, the more advanced the stage of AD is, the lower the level of CBF will be in different stages of neurodegenerative diseases in a wide spectrum ranging from normal cognition to AD dementia (28). It seems that ASL MRI can help detect MCI patients with an AD pathology by evaluating cognitive deficits in very early phases and ruling out other cognitive disorders, such as depression.
Additionally, another aspect of this study was the qualitative analysis of inline-calculated CBF maps derived from 3D PASL MRI, which demonstrated an excellent interobserver agreement. The post-hoc analysis revealed that agreement was more evident in the dominantly normoperfused depression and SMI groups, followed by the dominantly hypoperfused AD group. Overall, there are different available labeling methods, such as continuous, pulsed, and velocity-selective ASL. In continuous ASL, a constant gradient is applied in the direction of the flow along with a constant radiofrequency (RF) pulse, while pseudo-continuous ASL uses a long series of short RF and gradient pulses. In PASL, a single RF pulse or a short train of pulses is used to rapidly invert magnetization in a slab. Magnetization of blood is inverted proximal to the brain in the former techniques, while in velocity-selective ASL, the labeling pulse lacks spatial selectivity and involves the whole brain imaging volume.
In the last decade, many studies have been carried out to assess the consistence and strength of ASL perfusion, based on continuous or pulsed labeling methods. The reliability and reproducibility of ASL perfusion images have been investigated in different centers, using different scanners with different sequences and ASL methods (29-31). In a multicenter reproducibility study of ASL, it was introduced as a reliable perfusion method in routine clinical practice, without the need for a research setting (29). PASL, as the most common ASL method, is provided by many manufacturers, with instantaneous spatially selective saturation or inversion pulse, echoplanar readout, and inline calculation of CBF maps (32, 33).
The reliability and reproducibility of ASL perfusion in a healthy population are crucial for both diagnosis and follow-up in the evaluation of disease progression. Jiang et al. reported a good interrater agreement in cognitively normal individuals using PASL MRI (6). Interestingly, the reliability level decreased to moderate over a one-year period, indicating the importance of proper slice positioning and coregistration in longitudinal studies. Based on the intra- and multicenter reproducibility analyses in healthy individuals, all methods, but single TI PASL, yielded comparable results (31). The 2D ASL EPI sequences might be used for the inline calculation of relative CBF maps (in mL/g/min), which are derived from the blood flow voxel by voxel over time. The quantitative estimation of CBF might require advanced software programs, which are not routinely supplied by manufacturers; for clinical convenience and ease, no third-party software was used in this study.
There are several limitations in this study, including the small number of patients, selected from a single center with no long-term follow-up. In this clinical study, no healthy control group was included, whereas the depression and SMI groups were diagnosed with clinical tests; these clinical tests were accepted as the reference standard tests. Besides, the reviewing radiologists might not have been completely blinded. When analyzing depression and SMI patients as the control subjects, the reviewing radiologists could identify normal perfusion patterns, which indicated the relatively young age of these patients. Also, the reproducibility and variations of test measurements, especially interobserver variability, might have been affected by the staff’s long-term collaboration with each other. The qualitative assessment and dichotomic statistical analysis were also some other limitations. However, the present study mainly aimed to propose a simple and practical clinical method for patients with a cognitive impairment. We also aim to provide further information about this group in a future longitudinal study.
In conclusion, PASL MRI may be a valuable method for evaluating patients with cognitive disorders, using a qualitative assessment of perfusion maps. ASL perfusion can be a non-invasive, rapid, and reliable biomarker to improve the diagnosis of patients with cognitive disorders. Although it was previously considered as a research tool, it has become easily accessible and feasible for clinical use owing to recent technological advances. However, translating ASL into clinical practice still requires the development and validation of standardized guidelines.
