


1. Background
Currently, cone beam computed tomography (CBCT) is an acceptable dental imaging modality used for every field in dentistry including implant planning, orthodontics, and maxillofacial surgery (1). Compared to other dental imaging techniques, CBCT has great advantages such as excellent spatial resolution, overlap of teeth, and acquisitioning three dimensional (3D) volumes of dental arches and surrounding tissues (2, 3).
In addition, images obtained from CBCT have excellent tissue contrast due to eliminating blurring and provide orthogonal views by reducing projection effects (4). CBCT has further advantages such as cost beneficience and considerably reduced effective radiation dose compared to regular CT (5).
While CBCT has the capability of producing 3D images with significantly less radiation than conventional CT, settings of the device plays a key role in the resulting radiation dose. The setting parameters include kilovoltage peak (kVp) and milliamperage (mA) (6, 7).
Previous studies have shown that both the lower and the higher exposure settings in medical CT units result in acceptable image quality (6-10). Although conventional dental imaging modalities still deliver lower radiation doses to patients, for some special cases in orthodontic treatment planning, undoubtedly a CBCT is preferred over a CT image (8).
Ludlow and co-workers found that as a dose sparing technique, dental CBCT is recommended compared to standard clinical scans for dental and maxillofacial radiographic imaging. Effective dose of standard scan of dental protocol (International Commission on Radiological Protection [ICRP]-2007) with multidetector computed tomography (MDCT) 1.5 to 3 times greater than that of using dental CBCT with average field (8).
Pauwels and co-workers showed that the dose for different organs varies in a wide range of value because of several factors such as radiation exposure setting, characteristics of primary beam and beam positioning respect to sensitive organs (9).
In another study, Pauwels and co-workers tried to optimize the kVp setting for a particular CBCT. They found that with the highest available kVp setting, the most optimal contrast is achievable at a fixed dose. There was a great potential for dose reduction through mA with a minimal loss in image quality (11).
Palomo and co-workers investigated various exposure settings, filters, and different collimation, and they found that lower settings and using the available collimation options a result in reduction in radiation dose (12).
In recent years, the number of accessible CBCT units has increased and new models have continuously been established. These devices cover a wide-ranging variability in terms of essential setting parameters including kVp, mA, filtration, and field of view. In addition, there is a degree of possibility in many devices for selecting certain exposure factors. The amount of absorbed dose in organs and the image quality for each scan depends on the type of device and imaging protocols. Radiation dose and image quality with the field of view are important factors by which the satisfaction of a certain CBCT unit can be determined regarding to the “as low as reasonably achievable” (ALARA) principle (13, 14).
To determine the risk of radiation for patients from X-ray imaging modalities, the effective dose is the preferable parameter over other alternatives (15-18). In dosimetry, it is impossible to directly place any kind of dosimeter inside an internal organ of body. Therefore, in order to measure the effective dose, an anthropomorphic phantom representing of an average human is frequently used (19).
2. Objectives
In the present study, we aimed to evaluate the effect of mA variation on the absorbed dose of the mandible and salivary glands according to various values of mA routinely used in CBCT.
3. Materials and Methods
In this study, a two dimensional film dosimetry method is represented by using radiographic film, and using the head phantom the effect of different milliamparages has been investigated on the distribution and amount of the received dose.
3.1. Phantom Construction
In this study, the measurements were performed by using a head phantom made of soft tissue-equivalent materials. The tissue-equivalent substitutes used for the phantom should meet two goals: similar physical properties to human tissue, such as density and attenuation coefficients, and simplicity of integration into the phantom construction process (20). A urethane-based resin was used to simulate the X-ray attenuation and density of human soft tissue. Another material combined from urethane-based and calcium carbonate (CaCO3) was used to match human bone tissue within the diagnostic energy range (80 - 120 kVp) (21).
Various factors were considered for designing and constructing the phantom. Regarding jaw dimension, teeth positioning and other segments of the dentomaxilla area, phantom designing was performed considering capability of dosimetry within mentioned situations in two parts including the head and jaw. The phantom was designed based on actual axial sections of a patient CT scan. Therefore, the geometry of each structure was matched accurately to the real head and radiological image of the phantom had great precision (21).
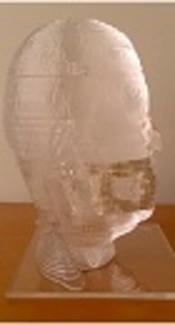
In the first step, we created a 3D file from CT scan images of a normal patient using 3D-Doctor software. Then, we extracted some parts of the maxillofacial area in Rhino software and a 3D file compatible to carbon dioxide laser (Co2-laser) machine was created and cut from perspex as soft tissue material. Bone equivalent material was a combination of a polyurethane based resin and CaCo3 that was prepared using a laboratory mixer. At last we used some simple tools to embed this material in the desired segments (21). Figure 1 shows the slices of the phantoms in which equivalent bone material was embedded and the completed head phantom.

A, The slices of the phantom in which bone equivalent material was embedded, B, The constructed phantom using perspex and urethane-based resin.
The selected areas for dosimetry were the sections in which the parotid gland, submandibular gland, and mandibular bone were placed. To achieve this goal, the precise locations of bones were determined so that the difference in the absorbed radiation dose between soft tissue and bone was clear. It should be noted that all slices of the phantom were prepared using automatic laser cutter. This laser cutter was moved along the border of the organ which was imported to the software. The imported data to software were derived from the CT scan of the patient directly. Finally, the constructed phantom was imaged by a Siemens 16-slices CT scanner in order to obtain Hounsfield unit measurements of the equivalent soft and bone tissues (Figure 2). The obtained Hounsfield units were 38 and 902 respectively which was in good agreement with real soft and bone tissue.

CT scan of some slices of the constructed phantom
3.2. Dosimetry
In this study, a radiographic film (AGFA ORTHO CP-GU) was used for evaluating the dose distribution in the phantom. This film is suitable for measurements of dose in the energy ranges of 20 - 200 kVp X-rays (22). Optical density and dose radiation of this film has a linear relationship. The size of film used for dosimetry was 18 × 24 cm. Each film was placed in a specific packet composed of three different layers for protection against light and humidity.
In the first step, the film calibration curve was obtained by using the analogue radiology machine Varian-A-192 tube. The machine calibration curve as a function of kVp and mAs is derived by MATLAB software based on dose values measured in various kVp and mAs by the associated company. Then film response relative to radiation exposure is measured and calculated by the given specific dose with 0.5 mGy to 15 mGy exposure on discrete sections of the film. After processing, the films were scanned by Microtek-9800 XL scanner, and the film calibration curve was acquired by an in-house MATLAB software (22). In order to produce an equal condition for calibration setting, the film was placed at 100 cm distance of the tube under a 2 cm Plexiglass sheet.
Dosimetry was performed with a CBCT Soredex Cranex 3D device. Regarding the capability of manual setting, the mA was considered as a varying factor and then scans were performed in the usual conditions of dental imaging of adults at 90kVp.
We specified the situation of the mandible, parotid and submandibular glands on two adjacent slices on the phantom based on the atlas of anatomy. Then, the films were placed between the two slices anatomically compatible with the desired organs (Figure 3).
The total of six CBCT scans were obtained, with 2, 4, 6, 8, 10 and 12 mA at 90 kVp. For all these measurements as a routine procedure, gantry was rotated around the phantom in 180 degree arc in the counter clockwise (CCW) direction. For every value of mA, measurements were repeated three times. The films were placed between the two slices anatomically compatible with the desired organs (Figure 3). These values of 6, 8 and 10 milliamperage are commonly used for adult dental scans. After processing and developing of the films, each one was scanned by a Microtek-9800 XL film scanner. This scanner has the capability of film scans with large sizes. All the images were saved in TIF format to keep the maximum information of the films. Using calibration curve of the film (Figure 4), the absorbed dose of each point was calculated by an in-house MATLAB software.

The film was placed between the two slices anatomically compatible with the desired organs.
Finally, distribution of absorbed doses and isodose curves were obtained. The average values of three values of absorbed dose for each organ and the standard deviation were also calculated with MATLAB software. We performed a Tukey-Kramer (Tukey’s W) multiple comparison analysis of ANOVA test using SPSS-20 software (IBM SPSS Statistics for Windows, Version 20.0. Armonk, NY: IBM Corp) used for evaluating the relationship between absorbed dose and mA at each part of the dentomaxillofacial area.

Calibration curve of the film
4. Results
Table 1 illustrates the dose for each part selected on the phantom and Table 2 shows the ratio of average doses at 2, 4, 6, 8 and 10 mA settings to dose at 12 mA setting and 90 kVp. In addition, P value was calculated between absorbed dose related to every paired mAs in each organ. Also, Pearson coefficient was calculated for any of organs between for each value of mAs and its related absorbed dose. Isodose curves obtained by MATLAB software of 90 kVp, 6 mA and field size 6 × 4 is demonstrated in Figure 5.
| Scanned area | Average dose (mGy) | P value for every paired mAs | Correlation coefficient between mAs and dose | |||||
|---|---|---|---|---|---|---|---|---|
| 2 mA | 4 mA | 6 mA | 8 mA | 10 mA | 12 mA | |||
| Right mandible | 2.95 | 3.60 | 5.76 | 8.22 | 10.67 | 12.55 | < 0.05 | 0.99 |
| Left mandible | 2.87 | 3.27 | 5.53 | 7.96 | 10.33 | 12.19 | < 0.05 | 0.99 |
| Right parotid | 1.88 | 2.59 | 4.04 | 5.91 | 8.19 | 10.23 | < 0.05 | 0.99 |
| Left parotid | 1.86 | 2.42 | 3.85 | 5.08 | 7.35 | 9.89 | < 0.05 | 0.99 |
| Right submandibular | 1.78 | 2.50 | 3.95 | 5.80 | 7.9 | 9.98 | < 0.05 | 0.99 |
| Left submandibular | 1.98 | 2.50 | 3.80 | 5.44 | 7.43 | 9.15 | < 0.05 | 0.99 |
Abbreviations: mA, milliamperage; mGy, milligray.
| Scanned area | Average dose ratio | |||||
|---|---|---|---|---|---|---|
| 2 mA | 4 mA | 6 mA | 8 mA | 10 mA | 12 mA | |
| Right mandible | 0.23 | 0.29 | 0.46 | 0.65 | 0.84 | 1.00 |
| Left mandible | 0.23 | 0.27 | 0.45 | 0.65 | 0.85 | 1.00 |
| Right parotid | 0.18 | 0.25 | 0.39 | 0.58 | 0.80 | 1.00 |
| Left parotid | 0.19 | 0.24 | 0.39 | 0.51 | 0.74 | 1.00 |
| Right submandibular | 0.18 | 0.25 | 0.39 | 0.58 | 0.79 | 1.00 |
| Left submandibular | 0.22 | 0.27 | 0.41 | 0.59 | 0.81 | 1.00 |
Abbreviation: mA, milliamperage.

Isodose curves for the 90 kVp, 6 mA and field size 6 × 4. The color codes represent dose distributions in different parts in mGy.
5. Discussion
As shown in Table 1, increasing mA has resulted in an increase in the average absorbed dose delivered to each part. As it has been represented in Table 1, for all scanned areas, the increase of absorbed dose by increase of mA is meaningful for 95% confidence. Correlation coefficient between mA and absorbed dose for each value of mA related to any of organs is positive and it shows that there is a positive correlation between mA and absorbed dose for any organ in each value of mA. The maximum and the minimum absorbed dose is placed in the area related to the right mandible and the left submandibular gland, respectively. By changing the value of mA from 2 to 12, absorbed dose varied significantly, with a maximum 5.44-fold variation between the highest and lowest dose for the right parotid.
In this study, average variations of absorbed dose versus mA in CBCT Soredex Cranex 3D for different parts of jaw and face have been evaluated. As mentioned in the previous sections, in order to meet ALARA principle, it is necessary to exist a balance between dose and image quality. Previous studies show that low exposure settings of radiation factors in medical CT scan units might result in similar image quality to higher exposure settings (5-10).
This study shows that increase in milliamprege of the device from 2 to 12 mA in routine condition in which kVp is set on 90, shows a meaningful increase in the absorbed dose. This result is in conformity with a study conducted by Palomo et al. (12). In both studies a considerable dose reduction was obtained by low exposure setting (12).
Kwong et al. evaluated the image quality of CT scan of the maxillary sinus in 40 patients with constant kVp and varying mA and concluded that there was a significant difference between absorbed dose of low and high exposure settings (5) which is in agreement to this study.
In this study, the absorbed dose received to the area related to the right parotid gland had the maximum value among other salivary glands. These results are completely in agreement with the study performed by Khajooei-Fard et al. in which the averaged absorbed dose delivered to the right and left parotid gland was 8.1 mGy and 7.3 mGy respectively with 90 kVp and 6 mA (23). In addition, according to our results, increasing the average absorbed dose in the right mandible was in good agreement with values obtained by Palomo et al. (12).
To conclude, with adherence to the previous studies, setting the radiation factors such as mA and kV in order to reach an optimization between absorbed dose and image quality is still considered as a controversial issue. In this study, a special phantom was developed that enabled one to perform direct film dosimetry inside the simulated organs. The phantom had similar radiological properties to one specific patient with the average size. In this project, it was found that there was a significant relationship between the increase of milliamperage and increase of absorbed dose of different parts of the maxillafacial area including submandibular glands, parotid glands and mandibular bone imaged by CBCT Sordex Cranex 3D unit. Therefore, regarding the significant effect of lower exposure settings on absorbed dose reduction, evaluation of image quality by varying exposure factors is strongly recommended in future studies in order to optimize exposure settings to accomplish the goal of preserve image quality.
