


.jpg)
1. Background
Coronary artery disease (CAD) is the presentation of coronary atherosclerosis, which causes luminal narrowing of the coronary arteries by accumulation of lipid rich, fibrous, or calcified plaques to the vascular wall (1). Atherosclerotic plaque may be characterized as (1) lipid plaques with extracellular lipid with a fibrous cap, (2) fibrous plaque, and (3) calcified plaques and complex thrombotic lesions subsequent to rupture. Fibrous plaques, calcified plaques and complex lesions may cause substantial stenosis of the coronary arteries, leading to territorial ischemia and dysfunction of the affected myocardium (2). By contrast, lipid plaques, which are known to bear the highest risk of causing future cardiovascular events are usually non-stenotic (1). They may rupture and form a thrombotic occlusion, resulting in immediate or acute coronary events. Most patients with acute coronary syndromes who present with unstable angina have the risk of acute myocardial infarction, and sudden coronary death. Therefore, in acute coronary syndrome, the atherosclerotic plaque composition seems to be a critical factor for determining the risk of rupture and subsequent thrombotic catastrophic event, rather than the degree of vascular stenosis (3). Assessment of the coronary lumen, evaluation of the vessel wall and atherosclerotic plaques may offer very important information about the prognosis of such patients, with possible prediction of the response to treatment. However, detection and characterization of vulnerable plaques is a challenging task that may need invasive techniques such as coronary angiography (CA), intravascular ultrasound (IVUS) (4), optical coherent tomography (OCT) (5) and plaque thermography (6). An ideal diagnostic tool should be reliable, non-invasive and able to detect and characterize an unstable plaque which may potentially result in an acute coronary syndrome. Currently, two emerging and promising techniques, namely, computed tomography (CT) (7, 8) and magnetic resonance imaging (MRI) (9), are widely accepted by the medical imaging community as they are non-invasive and have the potential to evaluate luminal stenosis and characterize plaque components.
MRI is a useful system to evaluate cardiac morphology, cardiac function, myocardial perfusion and myocardial viability. It shows advantages over CT, due to lack of ionizing radiation and possessing an acceptable soft tissue resolution for atherosclerotic plaques. However, MRI has limited application because of the long overall examination time for coronary artery plaque characterization.
Computed tomography (CT) is perceived to have the potential of being one of the most important non-invasive diagnostic imaging modalities which can be used in coronary artery disease. It provides three dimensional map of the x-ray attenuation coefficient with sub-millimeter resolution, 0.33 seconds scan time and robust data collection enabling cardiac imagers to produce reformatted high resolution images in any given image plans (10).
The determination of tissue density expressed as Hounsfield Unit (HU value or CT-number) is a standard technique in CT and is used as a surrogate marker for tissue composition in most of the studies (11).
Most of the scientists performed plaque characterization using conventional multi-detector CT (MDCT) by using calculating the Hounsfield number (Hounsfield unit; HU) which is related to the attenuation coefficient of the material under study. In their analysis, they used the CT-number (HU value) of the desired area in the plaque region. They found that there is a substantial overlap between mean HU values of soft (lipid core) and intermediate (fibrous) plaque. It was, therefore, concluded that differentiation of “vulnerable” from stable plaques, based on their HU values may not be as reliable because non-calcified plaque components have similar chemical compositions and hence, there is considerable overlap in HU values (12).
Differences in tissue contrast may not be easily discernible at any single X-ray energy available on current clinical scanners. In 1976, Alvarez and Macovski (13) proposed dual-energy CT (DECT) as a method to further increase the contrast resolution. In this method, the same object is scanned at two different energies. While the conventional CT aims at finding the shape and size of the objects, embedded in the patient’s body, DECT tries to determine the shape and size as well as the composition of the object.
It was shown by Rutherfored et al. (1976) that computed tomography provides a tool for precise measurement of linear attenuation coefficients of materials (14). These attenuation coefficients can be measured at different x-ray energies and from such data it is possible to obtain separate measures of electron density (ρe) and an effective atomic number (Zeff) for the same object. This is the process of tissue characterization. They could discriminate dermoid cyst and meningioma by this method when the measurements were done at tube voltages 140 and 100 kVp. In 1979, Chiro et al., used 140 and 90 kVp computed tomography for brain scan. Their theoretical calculations and experimental studies indicated that dual-energy CT can provide clinically useful tissue signatures, not only for metallic deposits, calcification and bone or injected iodine, but was also helpful for the identification of different types of parenchyma tissues and body fluids (15).
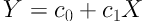
In 2003, Heismann et al. showed that the mass density ρ and effective atomic number Zeff of the absorber can be extracted by ρZ projection algorithm from at least two attenuation values µ(V1), µ(V2) with different spectral weighting. The effective atomic number (Zeff) describes the chemical classification and mass density determines physical morphology of the absorbing material. Both these parameters are used to characterize the material. Although for many substances the HU values for two different tube voltages can overlap, by applying (ρZ) projection algorithm they could separate these samples and characterize them (16).
Boll et al. (2006) and Johnson et al. (2007) used dual energy computed tomography (90 and 140 kVp) and subtraction method to enhance the qualitative imaging capabilities. They concluded that spectral dual-energy MDCT imaging of atherosclerotic coronary artery specimens using standard CT scanners will allow tissue characterization. In 2008, they used dual source CT (DSCT) in their studies and concluded that dual-energy MDCT with image post processing techniques enhanced the accuracy of calcified plaque quantification beyond the scope of single-energy MDCT, by using optical coherent tomography (OCT) as the reference standard (7, 17).
Further studies are needed to validate CT modalities for the assessment of coronary plaque composition, to provide better differentiation of lipid-rich from fibrous-rich plaques (18).
The present study has the following sections, (1) calibration-inversion of DECT data (2) using the above DECT inversion algorithm to determine the (ρe, Zeff ) values of plaque samples, and (3) characterization and discrimination of plaques in terms of their (ρe, Zeff) values. Although many authors continue to characterize materials on the basis of their HU values, it can give errors, because the HU values depend upon several instrumental factors of the CT machine, including the source spectrum, filtration and detector efficiency.
2. Objectives
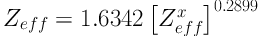
Our aim in this study was to eliminate these instrument dependent factors. To achieve this, we calibrated the CT machine with respect to ρe and Zeff, by experimentally determining the HU (100) and HU (140) of substances, whose ρe and Zeff are known. This calibration gave us the inversion coefficients for determining the ρe and Zeff of unknown substances from their observed HU (100) and HU (140) values. For characterization of non-calcified coronary artery plaque, we used the HU (100), HU (140) data and applied the above inversion algorithm to calculate their (ρe, Zeff). These quantities (ρe, Zeff) were directly related to the chemical characteristics of the plaque material and were thus used as basic inputs for plaque characterization.
3. Materials and Methods
3.1. Ex-Vivo Study
This study was approved by the ethical committee of the All India Institute of Medical Sciences (AIIMS), New delhi, India. Left coronary artery of 59 subjects were dissected while the cadavers were fresh (the time elapsed from the time of death was under 24 hours). The excised coronary arteries were from 6 females and 53 males with the age ranges between 20 and 70 years. Samples were selected from the left part of the heart containing left coronary ostium, left main coronary artery (LMCA), left anterior descending artery (LAD), and part of the left circumflex (LCX) of the human cadaver. This selection was based on the prevalence of the plaque on the left coronary artery especially in its proximal segment. Coronary artery samples were extracted from the cadavers who had died from a non-cardiac event. Samples were kept in 0.9% normal saline and refrigerated at 4 degrees Celsius. Maximum duration from the extraction of sample from cadaver and scanning time was 4 hours.
Coronary artery samples were removed from saline just prior to scanning. Left coronary artery was washed by injection of normal saline into the left coronary ostium in order to remove the blood from the coronary arterial lumen. Viscous solution of contrast agent (300 mgI / ml Ominpaque) was prepared by mixing methyl-cellulose with the solution iodinated contrast material in distilled water. The concentration of the viscous material was 2% weight by weight. The CT slices produced by this concentration were accepted by the cardiac radiologist for coronary artery wall evaluation (Figure 1A-C). The viscous form of the contrast could be easily injected into the coronary artery by inserting the tip of the syringe into the left coronary ostium. Injection was stopped when the leakage of contrast material was seen from the end of the coronary artery branches. Small amounts of contrast, ejected due to leakage were removed very carefully from the end of the coronary artery branches.
Contrast material in a viscous form was retained in the coronary artery during the scanning procedure. Also, it coats the coronary artery wall permitting better visualization of the coronary artery wall.
Each sample was placed on the scanning table to mimic the process of scanning a real patient for coronary CT angiography (CTA). The coronary ostium was placed in the cranial position and the length of the LAD was oriented along the z-axis of the scanner.
Ex-vivo samples were scanned by Dual Source CT SOMATOM Definition Syngo CT 2008G (Siemens AG, Wittelsbacherplazz, DE-80333 Munchen, Germany). PBV protocol was used to scan coronary artery sample. This protocol uses 100 and 140 kVp, 64 × 0.6 mm beam width, pitch of 0.25, 0.33s rotation time, automatic tube current modulation (typical mAs values were 15), and the data collected at 360 degree was used to reconstruct the CT images. This protocol uses a demo electrocardiogram (ECG) with 60 beats/minute. B26f convolution kernel was used to reconstruct CT images with 0.6 mm slice thickness. Data collection diameter or scan field of views (SFOV) were 50 cm in all cases. Matrix size was 512 × 512 and MMWP workstation was used to perform DECT post processing on the raw data.
Two cardiac radiologists with more than 3 years of experience were asked to interpret the images independent of each other and they were blinded to the final pathology result.
On our suggestion to select only non-calcified plaques, the cardiac radiologists rejected the ex-vivo CT images when they could identify any trace of calcification in coronary artery plaque images.
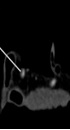
Maximum intensity projection (MIP) and multi-planar reconstruction (MPR) were used to evaluate the presence of the non-calcified plaque throughout the coronary artery lumen by the cardiac radiologist. Actually, all cases where non-calcified plaque were found in the proximal part of LAD and bifurcation of LMCA and LCX, non-calcified plaques were seen identically in MIP images and MPR views. Therefore, MIP images were used to determine the position of non-calcified plaque for future visual assessment (Figure 1B) in the present study. It has to be mentioned that MIP views were used only to assess the presence of non-calcified plaque. Therefore, we were not interested in any data such as slice thickness of the MIP images as they were unnecessary for the inversion procedure. Also, we reminded ourselves again that we were searching the non-calcified plaque in the proximal segment of the LAD and in the region of LMCA and LCX bifurcation portion. Visual evaluation was used in this study to verify the adequacy of DECT images to detect non-calcified plaque. Cardiac radiologist used true axial images (Figure 1C) that were made on the basis of MIP images to evaluate and characterize the type of non-calcified plaque.
, maximum intensity projection (MIP) CT image (B) and axial CT image (C) of non-calcified plaque (shown by arrow adjacent to contrast agent inside the lumen). This sample was collected from a 58-year-old man. Based on the histopathology report, this is a fibro-lipid with a thin fibrous cap, and spotty calcification.")
Gross photograph (A), maximum intensity projection (MIP) CT image (B) and axial CT image (C) of non-calcified plaque (shown by arrow adjacent to contrast agent inside the lumen). This sample was collected from a 58-year-old man. Based on the histopathology report, this is a fibro-lipid with a thin fibrous cap, and spotty calcification.
True axial images from the whole length of the non-calcified plaque were used to measure the density or HU value of the non-calcified plaque at two different energies (100 and 140 kVp) in each slice. Size of the region of interest (ROI) is a very important factor in our study. The size of the ROI was selected on the basis of the size of the non-calcified plaques. ROI had to be inside the plaque and should not contaminate the neighbouring structures, avoiding partial volume effect. The typical size of the selected ROI was between 1.1 and 5mm2. CT images that did not allow more than 3 pixels in the ROI were excluded from this study. The mean and standard deviations of the HU values for the circular ROI were measured three times for each slice to enhance its reliability. Each ROI contained minimum 3 pixels to prevent statistical uncertainty.
HU values of the structures surrounding the non-calcified plaque such as the border of the wall of the coronary artery, the fat surrounding the coronary artery wall, and the contrast material inside the lumen of the coronary artery were measured at 100 and 140 kVp to evaluate the possibilities of the overlapping (cross-reading) between the HU values of these structures in DECT images (Figure 2).
Samples of the coronary artery which were categorized to have non-calcified plaque (by the cardiac radiologist) were cut cross-sectionally and thin tissue sections were obtained from the center part of the plaque (Figure 1A). These samples were preserved in 10% formalin and sent to the pathology department. Samples were fixed in paraffin, cut into 5µm slices and stained by hematoxyline eosin for histologic evaluation of the plaque.
 which are used to measure the Hounsfield unit (HU) value on the fat surrounding coronary artery, the border of fat and wall of the non-calcified plaque, and contrast material in the lumen of coronary artery close to plaque.")
The location of the region of interest (ROI) which are used to measure the Hounsfield unit (HU) value on the fat surrounding coronary artery, the border of fat and wall of the non-calcified plaque, and contrast material in the lumen of coronary artery close to plaque.
3.2. Experimental Study for DECT Calibration
In this study, chemical compounds with known effective atomic number (Zeff) and electron density (ρe) were used to calibrate the DECT machine. These calibration samples were prepared by using high-purity samples of water, methanol, and acetic acid. Apart from these pure compounds, we also prepared aqueous solutions of glucose, sucrose, glycerol, citric acid, hydrochloric acid, and potassium hydroxide (19) in suitable compositions. These chemical compounds were selected due to similarity of their Zeff and ρe values with those of the typical substances that are present in non-calcified plaque. Chemicals were of analytical purity and were purchased from Merck Chemicals Company. The details of the experimental work are described in Ref. (20). These chemical solutions of known composition were filled in test tubes which were placed at the center of a water filled phantom, the test tubes being thus immersed in water. Both the phantom and test tubes were made of Poly Methyl Methacrylate (PMMA).
Different concentrations of known chemical solutions were prepared (in weight/weight %) by using digital balance (DENVER Instrument MXX 123, Gottingen, Germany) with 0.01 mg accuracy. Temperature measurements during the experiments were done by using a digital thermometer (Nuclear Associates 07 - 402, Hicksville, NY) with ± 0.5°C accuracy. Temperature of the CT room during experiments was fixed at 22 ± 0.5°C. The standard method, based on the use of specific gravity bottle, was employed to measure the density of all chemical solutions. The error in density measurement was less than 1%.
Test tubes were filled with liquid samples in pure form and as aqueous mixtures and inserted into the water filled phantom. The phantom containing test tubes was next placed on top of the scanning table in such a way that the length of the test tube was aligned along the Z axis of the scanning table and was perpendicular to the scanning plane Figure 2 in Ref (20). The phantom and all the samples in the test tubes were scanned by Dual-Source CT which would also be used subsequently to scan the ex-vivo coronary artery samples. For calibration, the phantom was scanned at 100 and 140 kVp and axial slices of the chemical compounds were reconstructed by 5 mm slice thickness. The circular ROI was placed at the center of each test tube, inside the chemical solutions, without contamination with the neighbouring structures. Mean and standard deviation of HU values were recorded for each ROI. The same procedure was repeated three times and average HU values from these three observations were used to enhance the validity of statistical estimations and analysis. For the same reason, care was taken to select a circular ROI containing 104 pixels in all measurements; thus, statistical fluctuations being minimal. The maximum standard deviation for the selected ROIs was 12. This shows that the maximum error on the mean value of the HU was 0.32%. Thus, from Equation 21 (20) we calculated the error in the mean HU value to be typically 0.32%- which is acceptable.
3.3. Theoretical Background for DECT Inversion
The HU(V1) and HU(V2) (V1 = 100 and V2 = 140kVp) values of the known chemical compounds (ρe, Zeff) were used to calculate the DECT inversion coefficients. As is known, the HU(V) of the scanned sample is expressed by Equation (1):
Where µ̂(V) and µ̂w(V) are the average linear attenuation coefficients of scanned material and water, respectively. It is known that the linear attenuation coefficient of the scanned material is a function of energy of the x-ray photons, effective atomic number and electron density of the scanned material. Linear attenuation coefficient in the range of x-ray energies used in diagnostic radiology (such as CT scanning) is given by Equation (2):

The linear attenuation coefficient due to Compton scattering is weakly dependent on the
energy of the x-ray photons, and directly proportional to the electron density of the material.
Photoelectric absorption, on the other hand, depends strongly on the x-ray photon energy (E) and the effective atomic number of the material, the dependence being (ρe × (ZeffX) / E3). Since the x-ray photons produced by x-ray sources are not monoenergetic, the HU(V) given by the CT machine describes the attenuation coefficient, µ̂(V), averaged over the source spectrum.
From Equation 1, we can define a quantity F(V) to be in Equations (3) and (4)
and

where the first term is the contribution from Compton scattering and the second term is from the photoelectric effect. Thus, by taking the ratio of F(V1) and F(V2) for two different excitation voltages of the x-ray tube we get,
which depends on Zeffx alone, ρe being eliminated, where we have defined f (V1, V2) by Equation 6:
Thus, if the coefficients a0 and a1 are known, we are able to determine (Zeffx) of the substance, from the experimental values of f (V1, V2), where f (V1, V2) is calculated from the observed HU(V1) and HU(V2) values of the substance.
For finding the inversion coefficients, a0 and a1, we take samples with known values of (Zeffx) and measure their HU(V1) and HU(V2) with the CT machine that is being calibrated. From these HU values, f (V1, V2) are calculated and fitted to Equation 5. With a0, a1 determined, Equation 4 serves as the inversion algorithm for (Zffx).
From our numerical study of the photoelectric mass attenuation coefficients of substances with different Zeff values, we found that Zeff is related to (Zeffx), as is shown by Equation 7:
where the values of the mass attenuation coefficients were taken from the NIST tables.
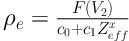
The value of Zeff being known, we have to address next the task of finding the electron density, ρe. On defining, Y = F(V2) / ρe and X = Zeffx we find that we can write Equation 8:
By making least square fit of the data with Equation 8 for known chemical compounds, the coefficients c0 and c1 can be calculated. This method becomes accurate when HU values of the higher kVp (for example 140kVp) are used, since at those energies photoelectric effect is insignificant and Zeffx has hardly any contribution to the HU values. Once c0 and c1 are determined from the data, Equation 8 is the inversion algorithm for finding (ρe). In other words,
HU(V2) of unknown materials can be used in Equation 8 to predict ρe to be,
4. Results
4.1. Results of Ex-Vivo Study
Non-calcified plaque was found in 21 (36%) ex-vivo coronary artery samples out of 59. The locations of non-calcified plaques were in the proximal segment of the LAD and at the bifurcation point of the main left coronary artery into LAD and LCX. In DECT, no calcification was detected in any of these 21 cases with pathologic proof of non-calcified plaques (Figures 1B and 1C). In all cases in which cardiac radiologists reported non-calcified plaque in these regions (in the proximal segment of the LAD and the bifurcation of LMCA and LCX), macroscopic evaluation could show the presence of non-calcified plaque in the course of coronary artery at the same place.
In DECT images of the ex-vivo samples of non-calcified plaque, discrimination between fibrous, fibro-lipid and lipid core plaques is not possible, the images are the same as MDCT images produced with conventional CT.
CT images have shown that non-calcified plaques have different length and the composition of the plaque is not uniform throughout the span of the plaque. For any particular kVp, the HU values were significantly different at successive axial slices of each non-calcified plaque (Figure 3A). This was true for both HU (100) and HU (140) in every plaque that we have studied.
It is known that in bone and contrast materials, HU values decrease with the increasing effective energy of the x-ray photons. In these substances HU (100) > HU (140). In contrast, for fat, HU values increase with the increasing effective energy of x-ray photons, i.e. for fat HU (100) < HU (140). It can be seen in Figure 3A that in each slice of non-calcified plaque HU (100) can be greater (in most of the cases), very close, or less than HU (140). This finding re-confirms the results published by Okayama et al. (21).
 and HU(140) for each slice in true axial CT images measured through the whole length of non-calcified plaque (A) and neighbouring structures of the non-calcified plaque such as fat surrounding the coronary artery (B), border of fat and wall of the coronary artery, non-calcified plaque and contrast material inside the lumen of the coronary artery (<a href=\"#A13970REF19\">19</a>)")
HU(100) and HU(140) for each slice in true axial CT images measured through the whole length of non-calcified plaque (A) and neighbouring structures of the non-calcified plaque such as fat surrounding the coronary artery (B), border of fat and wall of the coronary artery, non-calcified plaque and contrast material inside the lumen of the coronary artery (19)
Figure 3B demonstrates the HU values of the structures surrounding non-calcified plaque; namely (a) the wall of the coronary artery, (b) the adipose tissue surrounding the wall of the coronary artery and (c) the contrast material within the lumen of the coronary artery. These areas are completely distinguishable from one another with minimal or no HU cross-reading contamination from their surroundings.
As mentioned earlier, the chemical compounds with a wide range of Zeff and ρe (Figure 4A) were used so that they fall within the range of non-calcified plaque compositions. The Zeff and ρe of chemical compounds mimic fat, soft tissue, fibrous tissue and low concentration of contrast materials. Figures 3B and 4B demonstrate that the HU values of non-calcified plaques and the surrounding structures are very similar to the same values (HU values at 100 and 140 kVp) of chemical compounds that were used in this study. Using these semi-qualitative observations, the Zeff and ρe values were calculated for non-calcified coronary artery plaque, utilizing the inversion procedure. Subsequently, we examined whether these values can be used to characterize the sub-type of non-calcified plaque.
 versus HU (140) of the chemical compound used for calibration inversion purposes (<a href=\"#A13970REF19\">19</a>)")
Scatter diagram of A, Zeff and ρe 1023 and B, HU (100) versus HU (140) of the chemical compound used for calibration inversion purposes (19)
4.2. Results of DECT Inversion of Non-Calcified Plaque
HU values of 21 non-calcified plaques at 100 and 140 kVp were measured for all slices through the length of each plaque. Therefore, there are 208 unbiased data points for each HU value used in this study which is quite enough for statistical evaluation and accuracy. While the HU (100) and HU (140) values of non-calcified plaques are different for each slice inside the plaque, the HU values do not give any information regarding the nature of the plaque by itself (Figure 5).
 versus HU (140) of 208 data points of non-calcified coronary artery plaques belonging to 21 human heart cadaver samples")
Scatter diagram of HU (100) versus HU (140) of 208 data points of non-calcified coronary artery plaques belonging to 21 human heart cadaver samples
The coefficients of inversion, found by calibration of the CT machine, were used in the inversion algorithms to convert the HU (100) and HU (140) values into the Zeff and ρe. Figure 6 demonstrates the scatter diagram of the result of inversion of these HU values for all the 208 data points. Every data point in the scatter diagram shows the Zeff and ρe value for a given slice in the non-calcified plaque samples.
; and Region D: there is no sample")
Zeff versus ρe 1023 of non-calcified coronary artery plaque from 208 sections. Region A: represents the fibrous part; Region B: represents fibrous plaque plus lipid with calcification; Region C: corresponds to lipid with calcification with hardly any fibrous parts (thin fibrous cap); and Region D: there is no sample
It is known that plaque consists of (a) fibres, (b) lipid, and (c) calcium phosphate. We assume that these constituents are present in weight/weight% proportion w1: w2: w3, respectively.
Further, the typical (ρe, Zeff) values for lipids, fibers and calcium phosphate are (5.5, 3.0 × 10²³ / cm3), (6.5, 4.4 × 10²³ / cm3) and (19, 9.4 × 10²³ / cm3), respectively. But our DECT inversion results (Figure 6) show that (ρe, Zeff) of non-calcified plaque are higher than those for pure fibrous and lipid materials. It can be attributed to very small amount of calcium phosphate, present in the plaques. Histopathology study also reported micro-calcification (about 2µm in size) in the lipid part of the non-calcified plaques.
Elemental analysis of the results of DECT inversion for (ρe, Zeff) shows that plaque material can have different proportions of lipid (w1), fibrous material (w2) and calcium phosphate (w3). The scatter diagram in Figure 6 shows that the (ρe, Zeff) points in the scatter diagram lie in four distinct regions. We now intend to correlate the locations of these points with the composition of the plaque. The values of the effective atomic number and electron density (ρe, Zeff) are to serve as the parameters for identification of the nature of the coronary artery plaque. Since elemental compositions of these substances are not exactly known (known in a broad sense though) one has to depend on the known qualitative features about these substances.
In Figure 6 the material whose (ρe, Zeff) values lie in quadrant A, can be clearly identified to be fibrous plaque. Fibers are made of a mixture of proteins, water and other minerals. Owing to the presence of a considerable amount of water in proteins (molecular basis of the fiber) the fibrous and lipid parts remain segregated, due to immiscibility of water and lipids. Also, with the increasing fibrous content, the proportion of lipid and calcium decreases.
The modeling for the ones in which (ρe, Zeff) lie in quadrants B and C is difficult. It is known that most lipids, e.g., fats and triglycerides in their pure form have density lying in the range, 0.9 - 0.96 gm / cc. Since lipids have a tendency to acquire micro-calcification, their electron densities in the plaque may be higher than those for pure lipids and the values of the effective atomic numbers may be considerably higher. We found that as the concentration of lipid increases, the concentration of calcium phosphate also increases in the plaque. Calcium phosphate is seen to be present in the lipid-rich part of the plaque. This was also reported by van der Berg et al. (22). The parts in quadrants B and C represent fibro-lipid parts with calcification and are modeled in terms of varying compositions of proteins, lipids and calcium. We can conclude that data points in quadrant C of Figure 6 have less fiber, as compared to those in quadrant B. As we note, there is no sample of those (ρe, Zeff) points that lie in quadrant D of Figure 6.
Therefore, based on the above elemental model, we conclude that:
(a) In ex-vivo samples diagnosed as lipid-rich, the large number of slices showed that w2 > 0.5, i.e. lipid content was more than 50% by weight;
(b) Similarly, in samples that were found as fibrous plaque, we found that there were large portions with w1 > 0.5;
(c) In plaques diagnosed with thin fibrous cap, there were large parts with w1 < 0.15, and several sections with w1 < 0.3, i.e. presence of fiber was found to be low;
(d) In samples without visible (either in CT image or in histopathology) micro-calcification, there were sections with w3 < 0.03, i.e. with an extremely low calcium content.
Thus, with DECT inversion we can get semi-quantitative estimates of w1, w2, and w3. These estimates can enable us to determine a method by which we can distinguish between different types of non-calcified plaques like (a) fibrous (region A of Figure 6), (b) fibro-lipid (region B of Figure 6), and (c) lipid rich with thin fibrous cap (region C of Figure 6) plaques. It has to be noted that fibro-lipid and lipid rich plaques contain micro-calcification. Classifications based on histopathology study corroborated our finding in 63% of the cases.
5. Discussion
Physical techniques are becoming more and more important as diagnostic tools for physicians, particularly since about a hundred and twenty years ago when x-rays were discovered. The most recent application of x-rays is in the Dual Energy Computed Tomography (DECT) for chemical characterization of unseen objects, for non- invasive diagnostics. In this paper, we have tried to examine this possibility with DECT for characterization of coronary artery plaque, a method that can prove to be an asset for cardiologist and radiologist alike, the ultimate beneficiary being the patient.
This study showed that DECT inversion is able to convert HU(V1) and HU(V2) of the scanned slice into ρe and Zeff of the scanned sample. Also, it is shown that from the results of our DECT inversion algorithm we can distinguish the non-calcified plaque to be (a) fibrous, (b) fibro-lipid (c) lipid type with significant calcium contents. Thus, while the CT image of non-calcified plaque cannot discriminate lipid and fibrous plaques and also is not able to show micro-calcification inside the lipid plaques, DECT inversion can make these distinctions on the basis of the calculated Zeff and ρe values. Also, from qualitative analysis of Zeff and ρe it was concluded that non-calcified plaques containing lipid have micro-calcification which cannot be seen in CT images but can be corroborated with histopathology studies. A. Vedre et.al. have also stated that cholesterol aggregates can be found around the calcium part and have studied the evolutionary process of aggregate formation (23). Molecular structure of cholesterol shows that it has polar head and a non-polar tail, where its polar head is small but the non-polar part is longer. Therefore, cholesterol does not dissolve in water and the non-polar part of cholesterol attracts large number of lipid and fatty acids. As a consequence, it is natural that micro-calcification is present in non-calcified plaque in lipid part of the plaque (23, 24).
It should be stated that histopathology study with light-microscopy evaluation is able to reveal the micro-calcifications only when the size of micro-calcification is greater than 2 µm. As shown by the present study, DECT inversion can detect the presence of even smaller quantities of calcium. What is even more promising is that although, micro-calcifications of size less than the spatial resolution of the CT system cannot be seen in the CT image, it has significant effects on HU values (shift the HU values to the higher side). Thus, DECT inversion is able to demonstrate the existence of micro-calcifications which could not be seen by light-microscopy or in CT images.
The importance of the DECT inversion developed in this study is that the results are independent of the characteristics of the CT machine. We are able to extract important chemical parameters, like ρe and Zeff of the material. This is achieved by calibrating the CT machine with known samples. This calibration-inversion algorithm can be used to determine the (ρe and Zeff) values of any unknown material.
In summary, the present work combines several steps. Firstly, we have standardized a method for CT scanning of ex-vivo coronary artery, by injecting contrast material in viscous form, a method that was first used by Becker et.al. (25). By this, we have developed a method that allows enough time to scan ex-vivo samples without any risk of losing contrast enhancement in the quality of the image, as was checked by radiologists.
Next, from this study we could develop a new method to determine chemical composition (ρe, Zeff) of non-calcified plaque by using DECT inversion. All factors regarding source spectrum or detector efficiency are eliminated by this single stroke of calibration (19, 26). This can also be checked by model calculations based on mass attenuation table (27). Pixel by pixel tissue decomposition by this method is also possible and would be developed as a very useful method to determine the vulnerability of coronary artery plaque. It will help physicians to take proper decision and on time treatment of CAD patients.
This study is our first attempt to do experimental work with ex-vivo coronary artery. It has to be repeated in several cases and then linked to the study with living patients, once its repeatability and reproducibility are established.
For this, we are in the process of setting up experimental phantoms that closely represent the human heart. That will provide further advance to our aim of characterization of coronary artery plaque through diagnostic medical imaging by DECT inversion.
