


1. Background
With the expansion of abdominal cross-sectional image in clinical practice, the number of renal lesions discovered daily has incidentally increased. Multidetector computed tomography (CT) is the cornerstone of imaging investigation for characterizing and evaluating renal mass discovered serendipitously (1-3). CT protocols for renal mass evaluation may include pre-contrast phase and post-contrast consisting of corticomedullary phase, nephrographic phase and excretory phase (4, 5). Renal artery CT angiography (CTA), equivalent to the image of corticomedullary phase, is often performed to provide additional valuable information for surgical planning and assessment of the renal artery anatomy (5). However, a major concern with respect to those multiphase techniques is often the involvement of a higher radiation dose, which have indicated to be associated with increased cancer risks by other studies (6); One further critical issue is how to minimize the radiation dose for patients and provide high image quality to radiologists for the diagnosis.
Compared with the traditional filtered back projection (FBP) reconstruction method, iterative reconstruction algorithms can improve image quality by using multiple reconstruction iterations to decrease the artificial and image noise without degrading spatial resolution and compromising the overall image quality. Therefore, sinogram affirmed iterative reconstruction (SAFIRE) as a new technique applying iterative reconstruction algorithms has been implemented in abdominal CT angiography to improve image quality by reducing image noise. Initial results demonstrated that the iterative reconstruction might improve the feasibility at low tube voltage (7, 8). Such a technique provides the potential to reduce the radiation dose for patients suspected with renal lesion in CT examinations and facilitates respective clinical diagnosis and treatment.
2. Objectives
Based on the novel technique of iterative reconstruction, the purpose of this study was to investigate the image quality, radiation dose, feasibility for renal artery CTA at 80 kVp among patients performed abdominal CT examination in comparison to a standard 120 kVp acquisition with FBP, and optimizing the scan and reconstruction parameters for renal artery CTA.
3. Patients and Methods
3.1. Patients
This prospective study obtained institutional review board approval at the Affiliated Hospital of Guizhou Medical University (AHGMU). Sixty patients performed abdominal CT examination were enrolled into this study from April 2015 to March 2016 in AHGMU.
Inclusion criteria: 1, Patients suspected with renal mass or abdominal pain by clinic; 2, Patients age: 18 - 80 years; 3, Body mass index (BMI) of each patient was lower than 28 kg/m2.
Exclusion criteria: 1, Patients with renal mass after surgery; 2, Patients with the history of serious hypersensitivity reaction to contrast media; 3, Patients with renal insufficiency (estimated glomerular filtration rate (eGFR) < 60 mL/min/1.73m2); 4, Insufficient cardiac function; 5, Inability to hold breath to meet CTA requirement; 6, Patients with manifest thyrotoxicosis; 7, Pregnant women; 8, Patients who underwent other clinicals trial at the same time; 9, Inability to meet study requirements during experiments.
Randomization procedure: Assign 80 kVp or 120 kVp CT protocol to patients randomly according to the order of enrolment in this prospective study, the randomization procedure was based on the random number and block randomization by using SPSS software (version 23.0).
3.2. CT Protocols for Renal Artery CTA
Sixty consecutive patients underwent 128-slice multi-detector CT (MDCT) scanning (SOMATOM definition AS+, Siemens, Germany).
For the 80 kVp group, the settings were as follows: tube voltage 80 kVp, tube current 400 - 500 mAs, collimation 128 × 0.6mm, 1 mm slice thickness, 500 mm field of view (FOV);
For the 120 kVp group, the settings were: tube voltage 120 kVp, tube current and collimation were 200 - 250 mAs and 128 × 0.6 mm, 1 mm slice thickness, 500 mm FOV.
CT image datasets were reconstructed with SAFIRE at 80 kVp, and with FBP at 120 kVp. The acquisition followed craniocaudal direction, while breath holding, a series of unenhanced images of the upper abdomen were taken to evaluate the position of the renal region. The data of renal artery CTA were obtained at 25 - 30 seconds after administration of contrast medium (iopromide, 370 mgI/mL, 80 mL) injection at a flow rate of 3.0 mL/s by high pressure injector at the left superficial vein in the antecubital fossa. The scan parameters included a rotation time of 0.5 seconds, a pitch of 0.6 and a matrix of 512 × 512.
3.3. CT image Reconstruction
For renal artery CTA, all the CT images datasets were reconstructed at the workstation (Syngo CT Workplace VE40B), different iterative reconstruction strength levels and FBP algorithm were also reconstructed based on its original datasets. CT images with 1mm thickness and no intersection gap were generated for renal artery CTA. Multiplanar reformation (MPR) images and maximum intensity projection (MIP) images (including axial, sagittal, coronal image) were also generated, and these images were subsequently loaded into picture archiving and communication system (PACS) workstation (Syngo.plaza, Siemens) for evaluation by two experienced abdominal radiologists with a five-point scale.
3.4. Quantitative Assessment for Renal Artery CTA
With regards to the quantitative assessment of renal artery CTA, the signal intensity measurement was performed for each patient in corticomedullary phase contrast enhanced image datasets at workstation by means of Hounsfield units (HU). The CT attenuation of abdominal aorta (AO), right renal artery (RRA), left renal artery (LRA), erector spinae major (ESM), fat of subcutaneous abdominal wall (FSAW) and air were measured by placing the regions of interest (ROI) on the axial images. ROIs were drawn as large as the vessel lumen, and avoided the calcification of lumen wall or artifacts. Standard deviation (SD) of CT attenuation of air at the level of renal artery about 1 cm distal to the anterior abdominal skin was defined as background noise. Depending on the data of CT value, contrast to noise ratio (CNR) and signal to noise ratio (SNR) were calculated using the following formula:


Where CTvessels is the CT value of renal artery and other vessels, CTmuscle is the CT value of erector spinae major, SD is standard deviation of CT value of air.
3.5. Qualitative Assessment for Renal Artery CTA
All the MPR and MIP CTA images were evaluated by two experienced abdominal radiologists with 10 and 11 years experience who were blinded to the CT scanning parameters reviewed with a five-point scale.
Image quality was scored as follows:
For the overall image:
score of 1 = poor;
score of 2 = suboptimal;
score of 3 = diagnostic;
score of 4 = superior;
score of 5 = excellent.
Image quality was scored as follows for the sharpness of renal artery:
score of 1 = unacceptable anatomical structure and detail;
score of 2 = poor anatomical structure and detail;
score of 3 = acceptable anatomical structure and detail;
score of 4 = preferable sharpness of anatomical structure and detail;
score of 5 = ideal sharpness of anatomical structure and detail.
The detail of image quality was scored as follows for the segment of renal artery displayed in MPR and MIP image:
score of 1 = main renal artery;
score of 2 = first segment of renal artery;
score of 3 = second segment of renal artery;
score of 4 = third segment of renal artery;
score of 5 = four segment of renal artery.
Diagnostic confidence was also evaluated by a five-point scale:
score of 1 = very poor confidence,
score of 2 = suboptimal confidence,
score of 3 = acceptance confidence,
score of 4 = superior confidence,
score of 5 = excellent confidence.
The score of image quality ≥ 3 was satisfactory with clinical application.
3.6. Radiation Dose Assessment
Volume CT dose index (CTDIvol) and dose length product (DLP) were recorded according to the radiation dose report in the CT scanning. Effective dose (ED) and size-specific dose estimate (SSDE) were calculated for each patient according to the size of the body, including the size of lateral (LAT) dimension and anterior-posterior (AP) dimension at the level of the renal artery. Percentage dose reduction (DR) ratio was also computed in accordance with the following formula:


Where fsize32Xis the size-specific body radiation dose estimate conversion factor (9), CTDI120kVp is CTDIvol valued at 120 kVp and CTDI80kVp is CTDIvol valued at 80kVp. SSDE120kVp is considered as the mean value of SSDE in 120 kVp group, SSDE80kVp is considered as the mean value in 120 kVp group, k refers to the body region, age and kV-specific dose conversion factor (10).
3.7. Statistical Analysis
A statistical analysis was performed by utilizing SPSS software for Windows (version 23.0, SPSS Inc., Chicago, IL). Continuous variables were expressed as mean ± SD. The normality assumption of variables was conducted according to the Kolmogorow-Smirnov Z test. Categorized variable (gender) was analyzed by Chi-square test. Age was executed by the independent-sample T test. As for the 80 kVp-FBP group, 80 kVp-S4 and 120 kVp-FBP, the CT attenuation of AO, RRA, LRA, FSAW, AIR, ESM, SD, CNR and SNR of renal artery were analyzed by two-tailed paired-samples T test or independent-sample T test. Qualitative score was performed by Mann-Whitney U or Wilcoxon test among qualitative variables (overall image quality, vessels sharpness, segmental displayed in MIP or MPR, diagnostic confidence). As for the differences of subgroups (S1 - S5) at 80 kVp, quantitative assessment and qualitative assessment were both determined with the nonparametric Friedman’s test and performed pairwise comparisons, the significant difference level was adjusted. Radiation dose of the 80 kVp groups and 120 kVp group was tested by two-tailed, unpaired t-test.
Kappa analysis and percentage agreement were considered to evaluate the qualitative analysis and performed through MedCalc software (MedCalc 15.2.2, Mariakerke, Belgium). Definitions of inter-observer agreement on the basis of k value were as follows:
k values less than 0.20 were an indication of poor strength agreement,
k values between 0.21 and 0.40 were an indication of fair strength of agreement,
k values between 0.41 and 0.80 were an indication of moderate strength of agreement,
k values between 0.81 and 1.00 were an indication of very good strength of agreement.
P < 0.05 was considered as statistically significant.
4. Results
4.1. Patients Characteristics
Imaging evaluation of all 60 patients was performed with multislice CT at 80 kVp or 120 kVp acquisition. There were no significant differences in the patients’ age (P = 0.205), as well as sex between 80 kVp group (male 13, female 17) and 120 kVp group (male 14, female 16) (P = 1.000). There were 35 patients diagnosed with renal cyst by ultrasound, six patients had a renal lesion by lumbar vertebra CT examination, seven patients had an abnormal intensity signal of the kidney by lumbar vertebra MRI examination, 12 patients were suspected of a renal mass by means of hematuria.
4.2. Radiation Dose Assessment
According to the CT protocol we performed in this study, the CTDIvol for renal artery CTA at 80 kVp was much lower compared with those of 120 kVp acquisition ((10.1 ± 1.2) mGy vs. (15.0 ± 2.6) mGy, P < 0.001). The dose reduction of CTDIvol was 32.7%, the dose reduction of SSDE was 31.2% (P < 0.001). The dose reduction of ED and DLP was 40.0% and 39.6%, respectively (all Ps < 0.001).
4.3. Quantitative Analysis for Image Quality
As shown in Table 1 and Table 2, image quality was analyzed through detailed data for quantitative analysis. A significant statistical difference can be seen in terms of the mean CT value of AO, RRA, LRA, ESM and the SD of air for 80 kVp group with iterative reconstruction strength level 4 or with FBP versus 120 kVp group with FBP (All Ps < 0.05) (Table 1). The CT values of AO, RRA, LRA, ESM within the 80 kVp group were higher than the CT values of those in the 120 kVp group. The mean noise (SD of air) gradually decreased in the 80 kVp subgroups when increasing iterative reconstruction strength levels (S1 - S5) (Table 2). Compared with the 120 kVp group, the noise of 80 kVp with iterative reconstruction level 4 was lower than that of 120 kVp with FBP (P < 0.001). However, the noise of 80 kVp with FBP was higher than that of 120 kVp with FBP (P < 0.001) (Table 1). For CNR and SNR of RRA, and LRA, a significant statistical difference in terms of CNR and SNR between the 80 kVp group conducted with iterative reconstruction strength level 4 or FBP and 120 kVp group with FBP, CNR and SNR values of RRA, and LRA within the 80 kVp groups were higher than CNR and SNR values of those in the 120 kVp group. The mean CNR and SNR values gradually increased with increasing iterative reconstruction strength levels (Table 2) (Figure 1).
, 80 kVp-sinogram affirmed iterative reconstruction (SAFIRE) and 120 kVp-FBP. The CT values of abdominal aorta (AO), right renal artery (RRA), left renal artery (LRA), erector spinae major (ESM) were higher at 80 kVp than CT values of those at 120 kVp (A-E). The image noise decreased in the 80 kVp subgroups (S1 - S5) with increasing SAFIRE strength levels (F). However, the contrast to noise ratio (CNR) and signal to noise ratio (SNR) of renal artery increased in the 80 kVp subgroups with increasing SAFIRE strength levels (G-J). The overall image quality, vessel sharpness, segmental renal artery displayed in maximum intensity projection (MIP) and multiplanar reformation images (MPR) (K-N) were satisfactory with clinical practice (O).")
Comparison of quantitative and qualitative assessment among 80 kVp-filtered back projection (FBP), 80 kVp-sinogram affirmed iterative reconstruction (SAFIRE) and 120 kVp-FBP. The CT values of abdominal aorta (AO), right renal artery (RRA), left renal artery (LRA), erector spinae major (ESM) were higher at 80 kVp than CT values of those at 120 kVp (A-E). The image noise decreased in the 80 kVp subgroups (S1 - S5) with increasing SAFIRE strength levels (F). However, the contrast to noise ratio (CNR) and signal to noise ratio (SNR) of renal artery increased in the 80 kVp subgroups with increasing SAFIRE strength levels (G-J). The overall image quality, vessel sharpness, segmental renal artery displayed in maximum intensity projection (MIP) and multiplanar reformation images (MPR) (K-N) were satisfactory with clinical practice (O).
| Subject | 80 kVp | 120 kVp | P value | P value | P value | |
|---|---|---|---|---|---|---|
| FBP | S4 | FBP | 80 kVp-FBP vs. 80 kVp-S4 | 80 kVp-FBP vs. 120 kVp-FBP | 80 kVp-S4 vs. 120 kVp-FBP | |
| AO | 542.4 ± 125.3 | 542.6 ± 125.1 | 328.8 ± 75.0 | 0.230b | < 0.001c | < 0.001c |
| RRA | 514.1 ± 126.7 | 519.4 ± 127.9 | 317.8 ± 76.6 | < 0.001b | < 0.001c | < 0.001c |
| LRA | 501.3 ± 128.7 | 506 ± 130.1 | 319.2 ± 72.9 | < 0.001b | < 0.001c | < 0.001c |
| FSAW | -99.8 ± 26.8 | -99.2 ± 27.3 | -93.1 ± 17.3 | 0.055b | 0.028c | 0.091c |
| AIR | -1000.8 ± 2.8 | -999.6 ± 2.6 | -1001.1 ± 2.1 | < 0.001b | 0.684c | 0.023c |
| ESM | 61.7 ± 7.8 | 61.7 ± 7.8 | 56.2 ± 7.2 | 0.746b | 0.007c | 0.007c |
| SD | 9.9 ± 2.8 | 5.8 ± 2.3 | 8.0 ± 1.6 | < 0.001b | < 0.001c | < 0.001c |
| RRA-CNR | 49.67 ± 21.9 | 88.8 ± 41 | 34.8 ± 13.6 | < 0.001b | 0.008c | < 0.001c |
| RRA_SNR | 56.3 ± 22.9 | 100.6 ± 43 | 42.3 ± 15.4 | < 0.001b | 0.016c | < 0.001c |
| LRA-CNR | 47.8 ± 20.7 | 85.2 ± 38.7 | 35.1 ± 13.6 | < 0.001b | 0.019c | < 0.001c |
| LRA-SNR | 54.4 ± 21.5 | 97 ± 40.5 | 42.5 ± 15.4 | < 0.001b | 0.035c | < 0.001c |
| Overall image quality | 3.7 ± 0.5 | 4.3 ± 0.6 | 4.4 ± 0.6 | 0.001d | < 0.001e | 0.412e |
| Vessel sharpness | 4.0 ± 0.3 | 4.5 ± 0.5 | 4.6 ± 0.4 | < 0.001d | < 0.001e | 0.515e |
| Segmental dislayed in MIP | 4.5 ± 0.5 | 4.6 ± 0.5 | 4.8 ± 0.4 | 0.083d | 0.035e | 0.095e |
| Segmental dislayed in MPR | 4.5 ± 0.5 | 4.6 ± 0.5 | 4.8 ± 0.4 | 0.564d | 0.011e | 0.026e |
| Diagnostic confidence | 4.1 ± 0.5 | 4.4 ± 0.5 | 4.6 ± 0.5 | 0.010d | < 0.001e | 0.061e |
Abbreviation: AO, Abdominal aorta; CNR, Contrast-to-noise ratio; ESM, Erector spinae major; FBP, Filtered back projection; FSAW, Fat of subcutaneous abdominal wall; LRA, Left renal artery; MIP, Maximum intensity projection; MPR, Multiplanar reformation images; RRA, Right renal artery; S1-S5, SAFIRE strength level 1-5; SD, Standard deviation; SNR, Signal-to-noise ratio.
aValues are expressed as mean ± SD.
bDetermined with the paired-samples T test.
cDetermined with the independent-sample T test.
dDetermined with Wilcoxon test.
eDetermined with Mann-Whitney U test.
| Subject | 80 kVp | P value | ||||
|---|---|---|---|---|---|---|
| S1 | S2 | S3 | S4 | S5 | ||
| AO | 542.5 ± 125.3 | 542.5 ± 125.2 | 542.6 ± 125.2 | 542.6 ± 125.1 | 542.6 ± 125.1 | 0.045b |
| RRA | 515.4 ± 127.1 | 516.8 ± 127.3 | 518.1 ± 127.6 | 519.4 ± 127.9 | 520.7 ± 128.2 | < 0.001b |
| LRA | 502.5 ± 129 | 503.7 ± 129.4 | 504.8 ± 129.6 | 506 ± 130.1 | 507.3 ± 130.5 | < 0.001b |
| FSAW | -99.6 ± 26.9 | -99.1 ± 27 | -99.3 ± 27.2 | -99.2 ± 27.3 | -98.9 ± 27.4 | 0.038b |
| AIR | -1000.7 ± 3.0 | -1000.4 ± 2.8 | -1000 ± 2.7 | -999.6 ± 2.6 | -999.2 ± 2.5 | < 0.001b |
| ESM | 61.7 ± 7.8 | 61.7 ± 7.8 | 61.7 ± 7.8 | 61.7 ± 7.8 | 61.7 ± 7.8 | 0.172b |
| SD | 9.0 ± 2.6c,d,e | 7.9 ± 2.5d,e | 6.8 ± 2.4e | 5.8 ± 2.3 | 4.6 ± 2.2 | < 0.001b |
| RRA-CNR | 54.7 ± 24.2c,d,e | 62.9 ± 27.9d,e | 74.3 ± 33.2e | 88.8 ± 41 | 113.6 ± 52.7 | < 0.001b |
| RRA_SNR | 62 ± 25.3c,d,e | 71.3 ± 29.2d,e | 84.2 ± 34.8e | 100.6 ± 43 | 128.7 ± 55.5 | < 0.001b |
| LRA-CNR | 52.6 ± 22.8c,d,e | 60.5 ± 26.4d,e | 71.3 ± 31.2e | 85.2 ± 38.7 | 108.8 ± 49.2 | < 0.001b |
| LRA-SNR | 60 ± 23.8c,d,e | 68.8 ± 27.5d,e | 81.2 ± 32.5e | 97 ± 40.5 | 123.8 ± 51.6 | < 0.001b |
| Overall image quality | 4.0 ± 0.7 | 4.1 ± 0.6 | 4.2 ± 0.6 | 4.3 ± 0.6 | 4.1 ± 0.5 | 0.264b |
| Vessel sharpness | 4.3 ± 0.6 | 4.4 ± 0.5 | 4.4 ± 0.5 | 4.5 ± 0.5 | 4.6 ± 0.5 | < 0.001b |
| Segmental displayed in MIP | 4.6 ± 0.5 | 4.6 ± 0.5 | 4.6 ± 0.5 | 4.6 ± 0.5 | 4.6 ± 0.5 | 1.000b |
| Segmental displayed in MPR | 4.6 ± 0.5 | 4.6 ± 0.5 | 4.6 ± 0.5 | 4.6 ± 0.5 | 4.6 ± 0.5 | 0.469b |
| Diagnostic confidence | 4.2 ± 0.6 | 4.2 ± 0.6 | 4.3 ± 0.4 | 4.4 ± 0.5 | 4.4 ± 0.5 | 0.034b |
Abbreviation: AO, Abdominal aorta; CNR, Contrast-to-noise ratio; ESM, Erector spinae major; FBP, Filtered back projection; FSAW, Fat of subcutaneous abdominal wall; LRA, Left renal artery; MIP, Maximum intensity projection; MPR, Multiplanar reformation images; RRA, Right renal artery; S1-S5, SAFIRE strength level 1-5; SD, Standard deviation; SNR, Signal-to-noise ratio.
aValues are expressed as mean ± SD.
bDetermined with the nonparametric Friedman’s test and performed pairwise comparisons among 80 kVp subgroups (S1 - S5), the significant difference level was adjusted.
cIn comparison to S3, P < 0.001.
dIn comparison to S4, P < 0.001.
eIn comparison to S5, P < 0.001.
4.4. Qualitative Analysis for Image Quality
For the qualitative analysis regarding image quality at 80 kVp and 120 kVp, the subjective image was evaluated by two experienced abdominal radiologists with a five-point scale. The overall image quality, vessel sharpness, segmental arteries displayed in MIP and MPR, and diagnostic confidence are summarized in Table 3. Inter-observer agreement was established between the two experienced radiologists (k = 0.600 - k = 0.940) (Table 4). The image quality of three groups was proved sufficient to support clinical diagnosis. The noise decreased when the iterative reconstruction strength levels increased. However, the “paint-brushed” artifact increased (Figure 2).
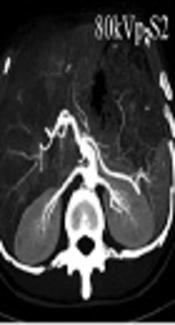
 and 80 kVp different strength levels (C - L) in terms of the subjective image quality of renal artery CT angiography (CTA). For the overall image quality, the renal artery CTA reconstructed by filtered back projection (FBP) at 120 kVp and by sonogram affirmed iterative reconstruction (SAFIRE) at 80 kVp could be accepted for clinical application (score ≥ 3). However, the image quality at 80 kVp presented more high-contrast than that at 120 kVp. Comparison was done between the two reconstruction methods for the main and segmental renal artery displayed in CT maximum intensity projection (MIP) or multiplanar reformation (MPR) images, most of the third segmental renal artery could be displayed. As for image noise, the noise decreased when strength levels were increased. However, “paint-brushed” artifact increased. Note: the renal lesion could be detected in the CT image with SAFIRE (I) or 120 kVp-FBP (A) (white arrow).")
Comparison of image quality between 120 kVp (A and B) and 80 kVp different strength levels (C - L) in terms of the subjective image quality of renal artery CT angiography (CTA). For the overall image quality, the renal artery CTA reconstructed by filtered back projection (FBP) at 120 kVp and by sonogram affirmed iterative reconstruction (SAFIRE) at 80 kVp could be accepted for clinical application (score ≥ 3). However, the image quality at 80 kVp presented more high-contrast than that at 120 kVp. Comparison was done between the two reconstruction methods for the main and segmental renal artery displayed in CT maximum intensity projection (MIP) or multiplanar reformation (MPR) images, most of the third segmental renal artery could be displayed. As for image noise, the noise decreased when strength levels were increased. However, “paint-brushed” artifact increased. Note: the renal lesion could be detected in the CT image with SAFIRE (I) or 120 kVp-FBP (A) (white arrow).
| Reconstruction methods | Reader 1 | Reader 2 | ||||||||
|---|---|---|---|---|---|---|---|---|---|---|
| Overall image quality | Vessel sharpness | Segmental displayed in MIP | Segmental displayed in MPR | Diagnostic confidence | Oerall image quality | Vessel sharpness | Segmental displayed in MIP | Segmental displayed in MPR | Diagnostic confidence | |
| 120 kVp-FBP | 3 (1/30) | 3 (2/30) | ||||||||
| 4 (13/30) | 4 (11/30) | 4 (7/30) | 4 (5/30) | 4 (11/30) | 4 (13/30) | 4 (15/30) | 4 (6/30) | 4 (6/30) | 4 (11/30) | |
| 5 (16/30) | 5 (19/30) | 5 (23/30) | 5 (25/30) | 5 (19/30) | 5 (15/30) | 5 (15/30) | 5 (24/30) | 5 (24/30) | 5 (19/30) | |
| 80 kVp-FBP | 3 (8/30) | 3 (2/30) | 3 (2/30) | 3 (9/30) | 3 (2/30) | 3 (3/30) | ||||
| 4 (21/30) | 4 (26/30) | 4 (13/30) | 4 (12/30) | 4 (22/30) | 4 (21/30) | 4 (26/30) | 4 (15/30) | 4 (16/30) | 4 (22/30) | |
| 5 (1/30) | 5 (2/30) | 5 (17/30) | 5 (18/30) | 5 (6/30) | 5 (2/30) | 5 (15/30) | 5 (14/30) | 5 (5/30) | ||
| 80 kVp-S1 | 3 (7/30) | 3 (2/30) | 3 (2/30) | 3 (6/30) | 3 (1/30) | 3 (2/30) | ||||
| 4 (17/30) | 4 (17/30) | 4 (12/30) | 4 (13/30) | 4 (20/30) | 4 (16/30) | 4 (19/30) | 4 (13/30) | 4 (12/30) | 4 (19/30) | |
| 5 (6/30) | 5 (11/30) | 5 (18/30) | 5 (17/30) | 5 (8/30) | 5 (8/30) | 5 (10/30) | 5 (17/30) | 5 (18/30) | 5 (9/30) | |
| 80 kVp-S2 | 3 (5/30) | 3 (2/30) | 3 (4/30) | 3 (1/30) | ||||||
| 4 (19/30) | 4 (19/30) | 4 (13/30) | 4 (12/30) | 4 (20/30) | 4 (18/30) | 4 (19/30) | 4 (12/30) | 4 (14/30) | 4 (21/30) | |
| 5 (6/30) | 5 (11/30) | 5 (17/30) | 5 (18/30) | 5 (8/30) | 5 (8/30) | 5 (11/30) | 5 (18/30) | 5 (16/30) | 5 (8/30) | |
| 80 kVp-S3 | 3 (3/30) | 3 (3/30) | ||||||||
| 4 (20/30) | 4 (18/30) | 4 (12/30) | 4 (12/30) | 4 (19/30) | 4 (19/30) | 4 (19/30) | 4 (13/30) | 4 (13/30) | 4 (20/30) | |
| 5 (7/30) | 5 (12/30) | 5 (18/30) | 5 (18/30) | 5 (11/30) | 5 (8/30) | 5 (11/30) | 5 (17/30) | 5 (17/30) | 5 (10/30) | |
| 80 kVp-S4 | 3 (2/30) | 3 (2/30) | 3 (1/30) | |||||||
| 4 (18/30) | 4 (15/30) | 4 (12/30) | 4 (14/30) | 4 (19/30) | 4 (19/30) | 4 (16/30) | 4 (13/30) | 4 (13/30) | 4 (19/30) | |
| 5 (10/30) | 5 (15/30) | 5 (18/30) | 5 (16/30) | 5 (11/30) | 5 (9/30) | 5 (14/30) | 5 (17/30) | 5 (17/30) | 5 (10/30) | |
| 80 kVp-S5 | 3 (2/30) | 3 (2/30) | ||||||||
| 4 (22/30) | 4 (11/30) | 4 (12/30) | 4 (12/30) | 4 (19/30) | 4 (22/30) | 4 (12/30) | 4 (13/30) | 4 (13/30) | 4 (20/30) | |
| 5 (6/30) | 5 (19/30) | 5 (18/30) | 5 (18/30) | 5 (11/30) | 5 (6/30) | 5 (18/30) | 5 (17/30) | 5 (17/30) | 5 (10/30) | |
Abbreviations: FBP, Filtered back projection; MIP, Maximum intensity projection; MPR, Multiplanar reformation images; S1-S5, SAFIRE strength level 1-5.
| Review Item | Kappa value (95% Confidence Interval) | ||||||
|---|---|---|---|---|---|---|---|
| 80 kVp-FBP | 80 kVp-S1 | 80 kVp-S2 | 80 kVp-S3 | 80 kVp-S4 | 80 kVp-S5 | 120 kVp-FBP | |
| 0verall image quality | 0.848 (0.655-1.000) | 0.857 (0.702-1.000) | 0.729 (0.511-0.948) | 0.918 (0.761-1.000) | 0.940 (0.824-1.000) | 0.933 (0.804-1.000) | 0.888 (0.744-0.917) |
| Vessel sharpness | 0.732 (0.378-1.000) | 0.879 (0.721-1.000) | 0.856 (0.664-1.000) | 0.930 (0.794-1.000) | 0.933 (0.805-1.000) | 0.930 (0.794-1.000) | 0.600 (0.324-0.876) |
| Segmental displayed in MIP | 0.867 (0.690-1.000) | 0.932 (0.800-1.000) | 0.932 (0.800-1.000) | 0.932 (0.800-1.000) | 0.932 (0.800-1.000) | 0.932 (0.800-1.000) | 0.902 (0.714-1.000) |
| Segmental displayed in MPR | 0.737 (0.505-0.968) | 0.795 (0.575-1.000) | 0.865 (0.686-1.000) | 0.932 (0.800-1.000) | 0.933 (0.803-1.000) | 0.932 (0.800-1.000) | 0.889 (0.676-1.000) |
| Diagnostic confidence | 0.853 (0.656-1.000) | 0.937 (0.815-1.000) | 0.932 (0.803-1.000) | 0.918 (0.761-1.000) | 0.927 (0.786-1.000) | 0.850 (0.645-1.000) | 0.856 (0.664-1.000) |
Abbreviations: FBP, Filtered back projection; MIP, Maximum intensity projection; MPR, Multiplanar reformation images; S1~S5, SAFIRE strength level 1~5.
5. Discussion
The results observed in this study indicated that the renal artery CTA at 80 kVp is feasible for patients with suspected renal mass whose BMI is less than 28 kg/m2. Such configuration is believed to be able to provide satisfactory images for clinical application with 32.7% CTDIvol and 31.2% SSDE radiation dose reduction. The optimal iterative reconstruction at level 4 could be recommended as future CT protocols for 80 kVp renal artery CTA.
The radiology community currently implements radiation dose of CT management procedures corresponding to the principle of ALARA (as low as reasonably achievable) (11-13). Therefore, the mechanisms for reducing the radiation dose at MDCT may include X-ray beam collimation, X-ray beam filtration, tube current modulation and adaptation for patient body habitus (automatic exposure control) and peak kilovoltage optimization, to improve the efficiency of the detection system and the noise reduction algorithms (14, 15). In our study, in order to obtain the relatively higher overall image quality with noise reduction algorithm technique of iterative reconstruction for diagnosis, we increased the tube current that was up to 400 - 500 mAs.
In this study, the noise reduction algorithms (iterative reconstruction) were adopted to provide high image quality of renal artery CT angiography at 80 kVp, while the radiation dose was reduced among patients with suspected renal mass. CTDIvol dose for the 80 kVp group had a 32.7% reduction, in comparison to the 120 kVp group. SSDE of each patient was calculated according to the size of the body for each patient, and the transverse and anteroposterior diameters of renal artery were both taken into consideration. SSDE value of (7.20 ± 0.27) mGy for the 80 kVp group had a 31.2% SSDE reduction in comparison to the 120 kVp group. Additionally, in comparison to the 120 kVp group, this study observed a reduction of approximately 39.6% DLP and 40.0% ED in the 80 kVp group through iterative reconstruction. Thus, it is assumed that the CT images at 80 kVp with iterative reconstruction could provide satisfactory image quality for renal artery CTA (Figure 2).
Recent research and literature on radiation dose and image quality with iterative reconstruction have suggested that SAFIRE can improve the image quality, and has the potential to reduce the radiation dose (16-20). In our study, there was significant difference found in terms of CNR and SNR of renal artery CTA between standard FBP reconstruction at 120 kVp and SAFIRE reconstruction at 80 kVp. With regards to the CT attenuation, which mainly relates to the tube voltage, the CT value is considerably larger in the lumen of the renal artery at 80 kVp than those at 120 kVp. Regarding image noise in this study, SAFIRE, as a novel reconstruction technique, is a raw-data-based iterative reconstruction algorithm that compares reconstructed and measured CT data in the raw data domain and iteratively corrects the images (21, 22). However, image noise of renal artery CTA showed a considerably higher amount at 80 kVp than performed at 120 kVp, and it is believed that SAFIRE reconstruction can reduce the image noise at 80 kVp, and provide higher image quality of renal artery for patients with suspected renal mass at 80 kVp for clinical practice. In addition, previous studies used SAFIRE strength level of 3 to investigate low radiation dose and image quality in the abdomen (7, 19). To our knowledge, this study has been the first attempt to focus on adopting different SAFIRE strength levels to achieve the optimal iterative reconstruction level based on raw data for evaluating the renal artery CTA. Our study results showed that CNR and SNR of the renal artery increased and the image noise decreased in the 80 kVp subgroups (S1 - S5). With increasing SAFIRE strength levels, the impression of CT images could appear “paint-brushed” or smooth overly (15, 20, 23). However, there was a little difference about the CT attenuation of abdominal aorta, right renal artery, left renal artery, erector spinae major, fat of subcutaneous abdominal wall and air. There was no significant statistical difference in the segmental renal artery displayed in MIP or MPR images. Therefore, this study concludes that the optimal SAFIRE strength level 4 can be recommended for renal artery CTA according to our results and experience and in daily clinical practice.
There are limitations for this study. First, the sample size in this study was relatively small and we did not include patients with higher BMIs. The results would have been more useful if we included patients whose BMIs were higher than 28 kg/m2 and formulated personalized CT protocols for renal artery CTA in the patients with renal mass based on the novel technique of iterative reconstruction. Second, the comparison between image quality of 80 kVp and that of 120 kVp was not conducted through the same individual subject.
In conclusion, using iterative reconstruction at a low tube voltage of 80 kVp could reduce the radiation dose while providing satisfactory quality of image that could facilitate clinical diagnosis of renal artery CTA, which could optimize the scan and reconstruction parameters of CT protocol in the patients with renal mass whose BMI lower than 28 kg/m2.
