


1. Background
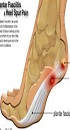
The plantar fascia (PF) is a thick connective tissue (aponeurosis) on the plantar side of the foot, which supports the structure of the longitudinal arch (1) and serves as a dynamic shock absorber for the foot during walking and running (2). Biomechanical imbalance and tensile forces on plantar fascia may lead to inflammation on the medial tuberosity of calcaneus on the inferior side, which is known as plantar fasciitis (1, 3). Plantar fasciitis (PFs) is one of the most common causes of heel pain (4).
Imaging plays an important role in the diagnosis of heel pain (5, 6). In diagnostic imaging of microtears and subsequent inflammation, an increase in the thickness of plantar fascia has been observed in its insertion (7, 8). Magnetic resonance imaging (MRI) is a standard imaging technique to quantify soft tissue of the foot such as plantar fascia (6). However, availability of MRI is often limited and not cost-effective for many clinical studies, especially in longitudinal and interventional studies (9). Ultrasonography is another imaging technique which is used for assessing different musculoskeletal disorders (10-13). It is also used to measure the thickness of plantar fascia, to monitor the effect of different interventions and to help therapists to follow the effects of therapeutic interventions in patients with plantar fasciitis (5, 14-18). Additionally, ultrasonography has many other advantages to use, such as being accurate, reliable, non-invasive, and free of radiation. It is also well-tolerated by patients and cost effective (7, 18, 19).
However, operator dependency is a major limitation for common use of ultrasound for ultrasonographic examinations (20). Only two studies have evaluated the inter-rater or intra-rater reliability (19, 21) of ultrasound in the plantar fascia. Plantar fasciitis most commonly occurs up to 2 cm of the heel (6). Measurement stations used to determine plantar fascia thickness varies widely from its insertion at the calcaneal tubercle, until 3 cm distal from its insertion at the calcaneal tubercle (16). According to a study by McNally and Shetty (2010), plantar fasciitis occurs in the insertion, at the calcaneal tubercle, until 1 cm distal to this (6).
In most studies, ultrasound examination of plantar fasciitis is performed with the patient in prone position (16). However, one study showed that there is no statistical difference in ultrasound measurements of plantar fascia thickness between prone and supine positions. As regards, prone position is more common for plantar fascia assessments due to patient comfort (22). Position of the knee is effective on the activity of hip extensors (23) and ankle plantar flexion (24). Placing the knee in flexion reduces activity of hip and ankle muscles. Based on this, it seems that knee flexion in prone position can help reduce lumbar lordosis. In addition, relaxing of the calf muscles can bring the ankle and toes closer to normal position and plantar fascia closer to normal length and thickness.
2. Objectives
The purpose of this study was to determine intra and inter-rater reliability of measurement precision of ultrasound assessment of plantar fascia thickness in a modified prone position. To the best of our knowledge, there is no published evidence to evaluate the intra and inter-rater reliability of the plantar fascia thickness measurement using ultrasound in Iran.
3. Patients and Methods
3.1. Study Design and Sampling
The study was approved by the ethics committee of the University of Social Welfare and Rehabilitation Sciences (No. USWR.REC.1395.130). Purposes of the study and the experimental procedure were described to participants and they were asked to sign a consent form if they agreed to the terms and conditions. Twelve healthy volunteers were recruited. Participants were included if they were older than 18 years, healthy, and had no lower extremity disorders. They were excluded if they had a history of foot surgery, fracture or pain.
3.2. Procedure
All subjects were asked to lay prone. A small cushion (Figure 1A) was placed under their abdomen to prevent increase in lumbar lordosis. A pad was used to place subjects’ shin at 30° angle (Figure 1B) to the examination table. Knees were fixed in flexion position (30 degrees) so calf and hamstring muscles were fully relaxed. Feet hanging freely over the pad edge, ankles and metatarsophalangeal (MTP) joints were held in neutral position (0° of plantar and dorsal flexion) (Figure 1B). Therefore, measurement was carried out with more control by raters.

A, Small cushion and foam, B, Position of volunteer, C, Placement of the probe on the plantar aspect of hindfoot
Initial real-time sonographic examinations of all subjects were performed by two raters (ASH and MN). Ultrasound measurements were carried out with a VF 5 - 12 MHZ linear array transducer (SSI-6000, SonoScape Medical Corp, Shenzhen, China). Both heels were scanned in two-dimensional (2D) real-time B mode. The transducer was placed in the sagittal plane over the plantar aspect of the medial calcaneal tuberosity (Figure 1C). Finally, the thickness of the plantar fascia was measured from the longitudinal view of the heel (in mm) at the calcaneus insertion and at 5 and 10 mm from the insertion. Scan depth was set to 3 cm (Figure 2). Three successive scans of both heels in each examination were saved in order to avoid error due to transducer obliquity (21). Ratleff suggests that multiple measurements increase the reliability and precision of ultrasound measurement of the plantar fascia (21). The transducer was removed from subjects’ feet after each examination and then repositioned. To avoid distorting the tissue being imaged, care was taken not to exert excessive pressure.

Normal plantar fascia. Longitudinal sonogram shows thickness of plantar fascia in three points
The schedule for ultrasound measurement was random. It was randomly defined whether examiner 1 or 2 would do the first measurement and which side to measure first. Volunteers were visited three times with an interval of 10 minutes.
3.3. Raters
The ultrasound measurement was carried out by two examiners using an ultrasound scanner. Examinations were conducted by a certified radiologist (ASH), who had 22 years experience and a trained examiner (MN), who was trained under the supervision of an expert radiologist (ASH). They were instructed and trained for test setup before starting the study in order to ensure that they were able to follow the study protocol and to reduce the risk of bias.
3.4. Data Analysis
Intraclass correlation coefficients (ICC), (95% confidence interval) was used for analyzing intra and inter-rater reproducibility (25). Taking into account the dependency of observations, linear mixed model ANOVA effects regression analysis was used to evaluate the effect of raters and time on measurements. All statistical analyses were performed using IBM SPSS Statistics for Windows, Version 22.0 (Armonk NY: IBM Corp.). A P value of less than 0.05 was considered statistically significant.
| Mean ± Std. Deviation | Range | |
|---|---|---|
| Age, y | ||
| Female | 38.67 ± 7.47 | 28 - 47 |
| Male | 31.83 ± 8.64 | 23 - 47 |
| Weight, kg | ||
| Female | 65.58 ± 15.98 | 51 - 95 |
| Male | 75.75 ± 10.40 | 63 -92 |
| Height, m | ||
| Female | 1.62 ± 0.053 | 1.55 - 1.68 |
| Male | 1.75 ± 0.095 | 1.60 - 1.87 |
| BMI, kg/m2 | ||
| Female | 24.77 ± 4.90 | 19.92 - 34.06 |
| Male | 24.55 ± 2.18 | 21.15 - 27.62 |
Characteristics of Subjects
4. Results
| Side | Left, mm | Right, mm | |||||||||||
|---|---|---|---|---|---|---|---|---|---|---|---|---|---|
| Measurement point | 0 | 5 | 10 | 0 | 5 | 10 | |||||||
| Raters | Measurement time | Mean ± SD | Range | Mean ± SD | Range | Mean ± SD | Range | Mean ± SD | Range | Mean ± SD | Range | Mean ± SD | Range |
| Rater 1 | First | 2.44 ± 0.46 | 1.56 - 3.17 | 2.12 ± 0.31 | 1.48 - 2.60 | 2.03 ± 0.27 | 1.50 - 2.40 | 2.33 ± 0.34 | 1.75 - 2.79 | 2.03 ± 0.24 | 1.75 - 2.60 | 1.98 ± 0.27 | 1.68 - 2.50 |
| Second | 2.44 ± 0.39 | 1.76 - 3.18 | 2.07 ± 0.30 | 1.57 - 2.58 | 1.96 ± 0.31 | 1.37 - 2.35 | 2.27 ± 0.34 | 1.80 - 2.75 | 2.02 ± 0.22 | 1.60 - 2.35 | 1.99 ± 0.26 | 1.68 - 2.43 | |
| Third | 2.44 ± 0.45 | 1.56 - 3.12 | 2.06 ± 0.28 | 1.50 - 2.45 | 2.00 ± 0.30 | 1.37 - 2.40 | 2.32 ± 0.25 | 1.87 - 2.75 | 1.99 ± 0.27 | 1.60 - 2.45 | 1.98 ± 0.30 | 1.53 - 2.40 | |
| Rater 2 | First | 2.43 ± 0.47 | 1.75 - 3.12 | 2.11 ± 0.27 | 1.69 - 2.50 | 2.04 ± 0.31 | 1.56 - 2.50 | 2.31 ± 0.41 | 1.60 - 2.87 | 2.04 ± 0.34 | 1.45 - 2.68 | 1.94 ± 0.39 | 1.43 - 2.71 |
| Second | 2.46 ± 0.39 | 1.81 - 3.12 | 2.13 ± 0.32 | 1.59 - 2.45 | 1.96 ± 0.33 | 1.44 - 2.50 | 2.27 ± 0.36 | 1.63-2.70 | 2.07 ± 0.41 | 1.50 - 2.75 | 1.96 ± 0.31 | 1.44 - 2.60 | |
| Third | 2.44 ± 0.42 | 1.69 - 3.12 | 2.13 ± 0.27 | 1.62 - 2.50 | 1.96 ± 0.32 | 1.37 - 2.43 | 2.29 ± 0.33 | 1.80 - 2.63 | 2.05 ± 0.33 | 1.50 - 2.50 | 1.96 ± 0.32 | 1.37 - 2.52 | |
Mean and Standard Deviation (SD) of Plantar Fascia Thickness
Twelve healthy volunteers (6 male and 6 female) were recruited in this study. The mean age for women was 38.67 (± 7.47) years and their mean body mass index (BMI) was 24.77 (± 4.90) kg/m2. The mean age in men was 31.83 ± 8.64 years and their body mass index body mass index (BMI) was 24.55 ± 2.18 kg/m2. The sample characteristics are summarized in Table 1.
Sample size was 12, the number of observations for each rater was 18 (three examination times [means of three successive scans of each heel were calculated on every examination time], three measurement points on both sides for each subject). Mean of plantar fascia thickness in three measurement points according to raters are provided in Table 2.
For each rater, 18 ICCs were calculated by three factors, (three measurement points, three times, and both sides). ICC was used to assess intra-rater between the first-second, first-third and second-third times, for three points on both sides.
Intra-rater reproducibility demonstrated a strong agreement between the rater’s measurements at different times. Due to the small difference between ICCs, mean of ICC for each rater was calculated and reported. Mean of ICC for intra-rater for the first rater was 0.904 ± 0.05 (range: 0.821 - 0.974) and for the second rater was 0.942 ± 0.03 (range: 0.870 - 0.985).
For inter-rater reproducibility, six ICC tests were performed on the mean of three examination time measurements for each rater, at three points on both sides. The ICC test showed high inter-rater reproducibility between two raters in all points (ICC > 0.85).
For calculating normal distribution of six outcomes, the Kolmogorov-Smirnov test was used and accepted (P value > 0.3).
The linear mixed model ANOVA was used to calculate the difference between the mean of three times measurements and difference between mean of two rater’s assessments. Six mixed model ANOVA analyses were calculated to evaluate the effect of raters, and time on measurements. The linear mixed effects regression results showed that the rater’s experience and time had no effect on the rater’s measurements (P value > 0.05) (Table 3).
| Variable | Level | Mean ± SE | P value | |
|---|---|---|---|---|
| PFL0 | Time | 1 | 2.435 ± 0.122 | 0.910 |
| 2 | 2.447 ± 0.122 | |||
| 3 | 2.435 ± 0.122 | |||
| Rater | 1 | 2.436 ± 0.121 | 0.825 | |
| 2 | 2.442 ± 0.121 | |||
| PFL5 | Time | 1 | 2.113 ± 0.082 | 0.829 |
| 2 | 2.099 ± 0.082 | |||
| 3 | 2.096 ± 0.082 | |||
| Rater | 1 | 2.083 ± 0.081 | 0.117 | |
| 2 | 2.122 ± 0.081 | |||
| PFL10 | Time | 1 | 2.034 ± 0.086 | 0.290 |
| 2 | 1.958 ± 0.086 | |||
| 3 | 1.980 ± 0.086 | |||
| Rater | 1 | 1.996 ± 0.085 | 0.668 | |
| 2 | 1.985 ± 0.085 | |||
| PFR0 | Time | 1 | 2.317 ± 0.094 | 0.865 |
| 2 | 2.271 ± 0.094 | |||
| 3 | 2.303 ± 0.094 | |||
| Rater | 1 | 2.306 ± 0.092 | 0.624 | |
| 2 | 2.289 ± 0.092 | |||
| PFR5 | Time | 1 | 2.034 ± 0.084 | 0.830 |
| 2 | 2.045 ± 0.084 | |||
| 3 | 2.019 ± 0.084 | |||
| Rater | 1 | 2.013 ± 0.082 | 0.277 | |
| 2 | 2.051 ± 0.082 | |||
| PFR10 | Time | 1 | 1.962 ± 0.085 | 0.897 |
| 2 | 1.981 ± 0.085 | |||
| 3 | 1.971 ± 0.085 | |||
| Rater | 1 | 1.986 ± 0.083 | 0.379 | |
| 2 | 1.957 ± 0.083 |
Mixed Model Rater-Time
5. Discussion
The purpose of this study was to evaluate the intra and inter-rater reliability of data recorded by ultrasound in measuring the thickness of plantar fascia. To the best of our knowledge, there was no published evidence to evaluate the intra and inter-rater reliability of plantar fascia thickness with ultrasound in Iran.
Evaluation of intra and inter-rater reliability of ultrasonographic measurements of plantar fascia thickness was performed in three points, at insertion, 5, and 10 mm from heel insertion. Previous studies suggest that changes in thickness in these points represent inflammation of plantar fascia. The current study found a strong correlation between the rater’s measurements at different times and high inter-rater reproducibility between two raters in all points.
This study, similar to the study conducted by Rathleff et al. (21) included healthy subjects. Unlike Rathleff, we controlled gender distribution among our sample size (Male = Female = 6). In the current study, age and BMI range were wider. The testing position in our study was prone and ankle and MTP joints were in neutral position. Volunteers were tested in three sessions with an interval of 10 minutes and measured longitudinally three times in each visit. The intraclass correlation coefficient for intra-rater (ICC > 0.821) and for inter-rater (ICC > 0.849) was stronger compared to the study conducted by Rathleff et al. (ICC > 0.770, and ICC > 0.82, respectively) with an acceptable level of reproducibility. One of the reasons for lower ICC in their study may be attributed to the effect of dorsiflexion in their measurements, the toe position in dorsiflexion to get higher clarity of the plantar fascia. Therefore, there is a possibility of variation of the thickness of plantar fascia due to differences in the angle of MTP joints in each measurement. Using different instruments could be another reason for getting different results.
Cheng et al. (19) measured the thickness of planter fascia in 11 patients with plantar fasciitis and 26 healthy volunteers in the longitudinal and transverse plane. For intra-rater reliability, plantar fascia thickness in healthy subject was assessed with an interval of one week. Parallel to their study, our results showed high reproducibility. The higher level of intra-rater ICC in their study could be due to their larger sample size (26 healthy people). Inter-rater reliability was assessed in both healthy (ICC > 0.77) and patients (ICC > 0.76) that was lower than current study. Measurement techniques were the same in both studies, but the slight difference between ICCs could be due to different instruments or different points of measurement of thickness of plantar fascia. They measured thickness of plantar fascia at the thickest part while in the present study measurements were taken at three points, (insertion to the heel, 5, and 10 mm from heel insertion). In addition, the age range of participants in the current study was 19 to 34 years with a mean age of 24.6 years, while the age range of participants in a study performed by Cheng was 24 to 79 years, considering the tissue of plantar fascia varies with aging (26).
To investigate the role of rater on assessment results in this study, the linear mixed model ANOVA effects regression was run and results showed that time had no effect on the accuracy of evaluation of rater’s measurements and rater experience had no impact on measurement results. Compared with studies that evaluated Achilles tendon (27) or patellar tendon (28), plantar fascia has a deeper structure, thus, the examiner should consider the overlying soft tissue, including skin and heel fat.
The limitation of this study was small sample size that could show its impact on the width of the confidence intervals.
In conclusion, the results of the present study indicate that both intra and inter-rater of measuring plantar fascia thickness at three points (insertion, 5, and 10 mm) using ultrasound seemed to be high. However, further large-scale studies are needed to support the findings of the present study.
