


1. Background
Laryngeal cancer is the second most common malignant tumor in the head and neck. Tumor stage is essential for determining the appropriate treatment strategies and evaluating prognosis for laryngeal carcinoma, which is based primarily on laryngeal cartilage invasion (1-5).
At present, CT examination is an important means for laryngeal cancer staging, which can not only clearly show the location and extent of the tumor, the relationship with the adjacent tissues, metastasis, but also evaluate laryngeal cartilage invasion. The CT appearance of laryngeal cartilage varies widely according to the different proportions of hyaline cartilage, cortical bone, and fatty marrow. The hyaline cartilage ossifies with aging and non-ossified cartilage and tumors show similar CT values, making them almost indistinguishable, especially when the tumor is located adjacent to non-ossified cartilage. Some researches reported laryngeal cartilage invasion sometimes overestimated, resulting in unnecessary total laryngectomies in some patients (6-9).
With dual-energy CT development, progress was made in the analysis of laryngeal cartilage invasion. Except for the routine scan images, iodine overlay images and spectral curve can be obtained. Iodine overlay images can describe the distribution of iodine, which can differentiate the tissue and lesion with mild enhancement. Dual- energy spectral curve can reflect the chemical composition of the tissue and lesion. Recently, dual-energy CT has been performed on several clinical fields (10-13), including the differentiation of renal lesions, and pulmonary diseases. Kuno et al. (4) made a qualitative analysis and reported dual energy CT can improve the diagnostic performance of laryngeal cartilage invasion with weighted-average images and iodine overlay images. This study was conducted to make a quantitative analysis of laryngeal cartilage invasion in patients with laryngeal carcinoma by measurement of iodine concentration and the spectrum curve.
2. Objectives
To evaluate the clinical value of dual-energy computed tomography with iodine overlay images and spectrum curve in the quantitative analysis of laryngeal cartilage invasion in patients with laryngeal carcinoma.
3. Patients and Methods
3.1. Patient Selection
From March 2012 to June 2016, One hundred and twenty patients with confirmed diagnosis of laryngeal carcinoma by surgical pathology (56 cases with laryngeal cartilage invasion and 64 cases without invasion) were collected, including 79 male and 41 female, age range 41 - 73 years, average age (59.3 ± 12.3) years. To ensure the study reliability, the cases collected were based on the following steps: CT examination was performed to determine whether there was cartilage invasion before operation. During operation, the surgeon determined whether there was cartilage invasion and the numbered cartilages were removed. All the cartilages removed were confirmed by post-operation pathology. According to the pathology result, the cases were grouped and the CT images were retrospectively analyzed. The following inclusion criteria were applied: dual-energy CT examination was finished before operation, intraoperative and postoperative details were recorded and pathological results were obtained. The study was approved by the Institutional Ethics Committee of Kunming Medical University. Written informed consent was obtained from all patients.
3.2. Scan Protocol
CT in all patients was performed by a second generation dual-source CT system (SOMATONM Definition Flash, Siemens Healthcare, Forchheim, Germany). The scan ranged from the inferior border of the mandible to the thoracic entrance. The routine scan, arterial phase and venous phase were done. The arterial phase and venous phase were carried out with dual-energy CT mode with the following parameters: collimation 128 × 0.6 mm, tube voltages tube A/B 100 and Sn140 kV, reference tube current 200 - 280 mAs with tube current modulation activated, pitch 0.8, rotation time 0.33 second. Total volume of 50 - 70 mL contrast agent (Iopromide, 320 mg iodine/mL, Bayer Schering Pharma, Berlin, Germany) was injected with a flow rate of 3 mL/s and followed by 30 mL saline flush at the same rate. Bolus tracking technique was used with a signal attenuation threshold of 100 Hu at the aortic arch.
3.3. Image Reconstruction and Analysis
All datasets were reconstructed with a slice thickness of 0.6 mm and increment of 0.4 mm with D30f kernels. The image datasets of arterial phase and venous phase (100 kV and Sn140 kV) were transmitted to the MMWP workplace (Siemens Syngo Multi Modality Workplace, MMWP, version 2012) and then were imported into dual-energy software and Liver VNC, Monoenergetic were chose respectively. The iodine overlay images and spectral curve of arterial and venous phases were obtained. The region of interest (ROI) was drawn as large as possible according to lesion size and was close to the lesion center. The iodine concentration of the tumors, invaded laryngeal cartilage, and non-invaded laryngeal cartilage were measured and the slope of spectral curve was calculated according to the formula (the slope was CT attenuation values of 40 - 100 KeV/60). Two attending doctors who were blinded to the patients’ clinical histories and histopathologic findings investigated cartilage invasion retrospectively and independently analyzed all images. If their evaluation results were different, a chief physician was invited to make a comprehensive analysis to reach a consensus. The laryngeal cartilage invasion was considered to be present with asymmetric sclerotic changes, erosion, lysis, and extralaryngeal tumor spread.
3.4. Statistical Analysis
Statistical analysis was performed on SPSS, version 21.0 (SPSS Inc, Chicago, IL) and the mean CT attenuation value of the tumors, invaded laryngeal cartilage and non-invaded laryngeal cartilage between arterial phase and venous phase, iodine concentration and the slope of spectral curve were analyzed by one-way ANOVA and McNemar test. Student-Newman-Keuls test (S-N-K) was used to make further pairwise comparison among the groups. P value ≤ 0.05 was considered as a significant difference. The area under the ROC curve was calculated. ROC curves were compared to determine the diagnostic performance.
4. Results
4.1. Routine Scan Images and Iodine Overlay Images
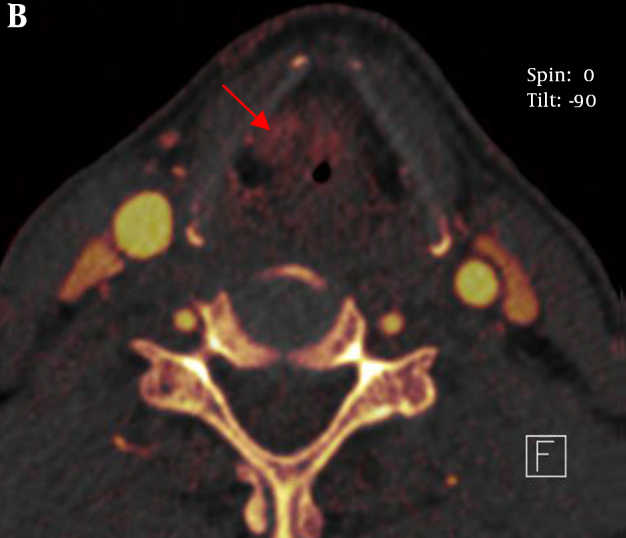
The sign of asymmetric sclerotic changes had no significant difference between routine scan images and iodine overlay images using McNemar test (P > 0.05) and they had the same sensitivity and specificity (77.8%, and 52.6%, respectively). However, the signs of erosion, lysis and extralaryngeal tumor spread had significant difference (P < 0.05). The sensitivity and specificity of iodine overlay images were superior to that of the routine scan images in the three signs (sensitivity and specificity of erosion: 92.3% vs. 61.5%, and 86.7% vs. 60.0%, respectively; lysis: 82.4% vs. 69.2%, and 81.8% vs. 66.7%, respectively; extralaryngeal tumor spread: 90.9% vs. 68.3%, and 100% vs. 63.5%, respectively (Table 1 and Figure 1).
; B, Iodine overlay image shows the right thyroid cartilage is complete and no bone destruction and clear fat gap is seen between the cartilage and the tumor (arrow).")
A, Routine scan image shows the right thyroid cartilage suspicious bone destruction (arrow); B, Iodine overlay image shows the right thyroid cartilage is complete and no bone destruction and clear fat gap is seen between the cartilage and the tumor (arrow).
| CT signs | Sensitivity | Specificity | |||||
|---|---|---|---|---|---|---|---|
| Routine scan images | Iodine overlay images | P value | Routine scan images | Iodine overlay images | P value | ||
| Sclerotic changes | 77.8 | 77.8 | > 0.05 | 52.6 | 52.6 | > 0.05 | |
| Erosion | 61.5 | 92.3 | < 0.05 | 60.0 | 86.7 | < 0.05 | |
| Lysis | 69.2 | 82.4 | < 0.05 | 66.7 | 81.8 | < 0.05 | |
| Extralaryngeal tumor spread | 68.3 | 90.9 | < 0.05 | 63.5 | 100 | < 0.05 | |
Comparison of CT Signs on Routine Scan Images and Iodine Overlay Imagesa
4.2. Mean CT Attenuation Value
The mean CT attenuation value of the tumors, invaded laryngeal cartilage and non-invaded laryngeal cartilage had significant difference in the routine scan, arterial phase and venous phase (F = 55.74, 6.84, and 15.06, respectively, P < 0.05). The mean attenuation of the tumors, invaded laryngeal cartilage and non-invaded laryngeal cartilage were 48.37 ± 9.39 Hounsfield unit (Hu), 82.04 ± 13.91 Hu, and 74.48 ± 12.65 Hu, on routine scan images, 49.67 ± 7.51 Hu, 72.93 ± 13.14 Hu, and 66.81 ± 11.58 Hu on arterial phase and 84.96 ± 21.94 Hu, 89.63 ± 17.78 Hu, and 88.89 ± 19.52 Hu on the venous phase, respectively. Moreover, further pairwise comparison (S-N-K) showed that there was statistically significant difference between the tumor and invaded laryngeal cartilage, invaded laryngeal cartilage, and non-invaded laryngeal cartilage (P < 0.05) (Table 2).
| Groups | Routine scan | Arterial phase | Venous phase |
|---|---|---|---|
| Tumor | 48.37 ± 9.39 | 49.67 ± 7.51 | 84.96 ± 21.94 |
| Invaded | 82.04 ± 13.91 | 72.93 ± 13.14 | 89.63 ± 17.78 |
| Non-invaded | 74.48 ± 12.65 | 66.81 ± 11.58 | 88.89 ± 19.52 |
| F value | 55.74 | 6.84 | 15.06 |
| P value | < 0.05 | < 0.05 | < 0.05 |
Comparison of the Mean Attenuation Among Tumor, Invaded Cartilage and Non-Invaded Cartilage in the Routine Scan, Arterial and Venous Phases (Hu)a
4.3. Comparison of the Slope of Spectral Curve Among Tumor, Invaded Cartilage and Non-Invaded Cartilage in the Arterial Phase and Venous Phases
The slope of spectral curve of the tumors, invaded laryngeal cartilage and non-invaded laryngeal cartilage had significant difference in arterial phase and venous phases (F = 82.69, and 50.14, respectively) (P < 0.05). Moreover, further pairwise comparison (S-N-K) showed a statistically significant difference among the three groups in the two phases (P < 0.05) (Table 3 and Figure 2).
| Groups | Arterial phase | Venous phase |
|---|---|---|
| Tumor | 2.53 ± 0.77 | 2.16 ± 0.84 |
| Invaded | 1.74 ± 0.69 | 1.49 ± 0.61 |
| Non-invaded | 0.37 ± 0.32 | 0.43 ± 0.36 |
| F value | 82.69 | 50.14 |
| P value | < 0.05 | < 0.05 |
Comparison of the Slope of Spectral Curve Among Tumor, Invaded Cartilage and Non-Invaded Cartilage in the Arterial and Venous Phases (Hu)a

A and B, The tumor and spectrum curve; C and D, Invaded cartilage and spectrum curve; E and F, Non-invaded cartilage and spectrum curve, which all show a descending curve, the tumor with the steepest spectrum curve and non-invaded cartilage with flat curve.
4.4. Comparison of the Iodine Concentration Among Tumor, Invaded Cartilage and Non-Invaded Cartilage in the Arterial and Venous Phases
The iodine concentration of the tumors, invaded laryngeal cartilage and non-invaded laryngeal cartilage had significant difference in the arterial phase and venous phase (F = 126.39, and 77.72, respectively) (P < 0.05). Moreover, further pairwise comparison (S-N-K) showed a statistically significant difference among the three groups in the two phases (P < 0.05) (Table 4 and Figure 3).

A, Iodine concentration of the tumors; B, Invaded laryngeal cartilage; C, Non-invaded laryngeal cartilage shows the iodine concentration of the tumor was the highest and non-invaded laryngeal cartilage smallest.
| Groups | Arterial phase | Venous phase |
|---|---|---|
| Tumor | 3.16 ± 0.88 | 2.13 ± 0.72 |
| Invaded | 1.84 ± 0.58 | 1.05 ± 0.42 |
| Non-invaded | 0.17 ± 0.56 | 0.20 ± 0.52 |
| F value | 126.39 | 77.72 |
| P value | < 0.05 | < 0.05 |
Comparison of the Iodine Concentration Among Tumor, Invaded Cartilage and Non-Invaded Cartilage in the Arterial and Venous Phase (mg/mL)a
4.5. Comparison of the Receiver Operating Characteristic (ROC) Curve of Mean CT Attenuation Value, the Slope of Spectral Curve and Iodine Concentration
The area under the curve (AUC) value of mean CT attenuation value in routine scan, arterial phase and venous phase were 0.064, 0.265, and 0.192, respectively. The AUC value of the slope of spectral curve in arterial phase was 0.970 and its selected cutoff was considered as 1.09. In this cutoff point, the diagnostic indices including sensitivity, specificity, PPV and NPV were 88.9%, 100%, 100%, and 82.6%, respectively. While the AUC value of the slope of spectral curve in venous phase was 0.944 and its selected cutoff was considered as 0.95. In this cutoff point, the diagnostic indices including sensitivity, specificity, PPV, NPV, PLR, and NLR were 81.5%, 96.3%, 91.7%, 77.3%, 7.76, and 19.30, respectively. The AUC value of the slope of iodine concentration in arterial phase was 0.995 and its selected cutoff was considered as 1.05. In this cutoff point, the diagnostic indices including sensitivity, specificity, PPV and NPV were 92.6%, 100%, 95.8%, and 100%, respectively. On the other hand, the AUC value of the slope of iodine concentration in venous phase was 0.905 and its selected cutoff was considered as 0.75. In this cutoff point, the diagnostic indices including sensitivity, specificity, PPV, NPV, PLR, and NLR were 77.8%, 88.9%, 91.3%, 82.6%, 7.00, and 24.5, respectively (Tables 5,6 and Figure 4).
| Groups | Sensitivity, % | Specificity, % | PPV, % | NPV, % | PLR | NLR |
|---|---|---|---|---|---|---|
| Arterial phase | 88.9 | 100 | 100 | 82.6 | - | 11.1 |
| Venous phase | 81.5 | 96.3 | 91.7 | 77.3 | 7.76 | 19.30 |
Diagnostic Indices of Slope of Spectral Curve in Arterial Phase and Venous Phase in Selected Cut-Off Points of Their ROC Curves
| Groups | Sensitivity, % | Specificity, % | PPV, % | NPV, % | PLR | NLR |
|---|---|---|---|---|---|---|
| Arterial phase | 92.6 | 100 | 95.8 | 100 | - | 7.4 |
| Venous phase | 77.8 | 88.9 | 91.3 | 82.6 | 7.00 | 24.5 |
Diagnostic Indices of Slope of Iodine Concentration in Arterial Phase and Venous Phase in Selected Cut-Off Points of Their ROC Curves
 curve of mean attenuation; B, The ROC curve of the slope of spectral curve; C, The ROC curve of iodine concentration (RS, routine scan; AP, arterial phase; VP, venous phase; RL, reference line).")
A, The receiver operating characteristic (ROC) curve of mean attenuation; B, The ROC curve of the slope of spectral curve; C, The ROC curve of iodine concentration (RS, routine scan; AP, arterial phase; VP, venous phase; RL, reference line).
5. Discussion
The accurate evaluation of the extent of tumor invasion and neoplasm staging is crucial for determining the appropriate treatment strategies for laryngeal cancer and evaluating prognosis. No accurate staging can cause laryngeal organ removal and laryngeal function loss, influencing the life quality of the patient severely. Early stages without cartilage invasion are initially treated with the intention of preserving the larynx. Cartilage invasion will affect the achievement ratio of radiotherapy and is a contraindication to preserve laryngeal pronunciation function (14, 15).
Becker believed magnetic resonance (MR) imaging seemed to be more sensitive than CT for detecting cartilage invasion. Nevertheless, there has been great discrepancy in different studies (16-18), some studies reported the specificity of MR imaging for detecting invasion of the thyroid cartilage is only 56% - 65%, while Taha et al. (17) found the accuracy of MRI can reach up to 88% for identification of inner thyroid lamina invasion and 85% for identification of outer thyroid lamina invasion to 90%. However, some researchers thought peritumoral inflammation can mimic cartilage invasion even on MR images, leading to a number of false-positive findings. Because inflammatory changes are most common in the thyroid cartilage, to a certain extent, the accuracy of MR imaging for detecting invasion of the thyroid cartilage may decrease. Kuno et al. (4) demonstrated noncalcified cartilage with tumor invasion, which showed iodine distribution, was easier to visually differentiate from healthy cartilage on dual-energy CT iodine overlay images.
Our study clearly showed laryngeal cartilage invasion and erosion with iodine overlay images and the results were similar to the study conducted by Kuno et al. However, we found the performance of asymmetric sclerotic changes had no significant difference between routine scan images and iodine overlay images, the iodine overlay images were not superior than the routine scan images. Though the iodine overlay images can show iodine distribution and outline gross morphology and the extent of laryngeal cartilage, sclerosed laryngeal cartilage had no iodine. Asymmetric sclerotic changes were considered an important sign to analyze laryngeal cartilage invasion. Laryngeal cartilage ossification shows various CT performances in different ages and different individuals, moreover, normal laryngeal cartilage can also appear out-of-step ossification. We think laryngeal cartilage invasion is overestimated by morphology alone. In our study, we made a quantitative analysis apart from morphology. So, it is not reasonable for asymmetry of the laryngeal cartilage to be judged as laryngeal cartilage invasion. It seems as a predictive sign rather than an absolute sign (19, 20), which also makes it difficult to evaluate laryngeal cartilage invaded for laryngeal cancer. Because iodine exists in the invaded laryngeal cartilage and non-invaded laryngeal cartilage has no iodine, iodine overlay images can differentiate invasion of the laryngeal cartilage from non-invaded laryngeal cartilage. Moreover, the signs of erosion, lysis and extralaryngeal tumor spread had significant difference. The sensitivity and specificity of iodine overlay images were superior to that of the routine scan images in the three signs.
Furthermore, we demonstrated that the iodine concentration of the tumor was higher than the invaded laryngeal cartilage in arterial and venous phases, while the iodine concentration of invaded laryngeal cartilage was higher than non-invaded laryngeal cartilage. We thought the possible reasons were as follows: (1) invaded cartilage contained cracking cartilage ingredients and cracking cartilage did not contain iodine, (2) new blood vessels in the cartilage tissue were less than the tumor tissue, (3) invaded laryngeal cartilage included some tumor tissue. However, the iodine concentration in the arterial phase was higher than that in the venous phase, which had a higher sensitivity and specificity.
The spectrum curve of the tumor, invaded cartilage, non-invaded cartilage in the arterial phase and venous phase showed a descending curve, however, non-invaded cartilage had a more gentle descending curve than the invaded cartilage, which indicated the spectrum curve was more meaningful in the invaded cartilage. Moreover, the slope of the spectrum curve had significant difference among the tumor, invaded cartilage, and non-invaded cartilage. Through analysis of iodine concentration and spectrum curve, we can make quantitative assessment on laryngeal cartilage invasion. Our study had the following limitations. First, laryngeal cartilages include thyroid cartilage, cricoid and arytenoid cartilages. In our study, we did not make detailed classification. Second, the size of laryngeal cartilages was small, which may cause some measuring errors in the region of interest affected by volume effect.
In conclusion, dual-energy CT can provide a new potential approach for laryngeal cartilage invasion diagnosis in order to guide selection of optimal operation plan and improve the prognosis.
