


1. Background
Lung cancer has become one of the biggest threats to human beings in recent years (1, 2). Early diagnosis and treatment play an important role in improving the survival rate of patients. For early stage lung cancer, pulmonary nodule is one of the apparent phenotypes in CT images. In CT scans, pulmonary nodule presents as a round opacity ball with a diameter in the range of 3 mm to 30 mm. Among different types of nodules, small-size pulmonary nodule with a diameter that ranges from 5 mm to 10 mm is particularly considerable in clinical diagnosis for radiologists. By comparing and estimating the nodule’s volume in different periods, radiologists can distinguish between malignant and benign nodules based on the volume doubling time of the nodule (3-6).
Since the characteristics of nodules are complex in CT scan, pulmonary nodule could be portioned into different categories. Based on the gray value distributions, nodules can be divided into solid, part-solid, and non-solid groups. According to the surrounding structures of pulmonary nodules, they could also be divided into three categories; namely, solitary, juxta-vessel, and juxta-pleural nodules. Among them, juxta-vessel and juxta-pleural nodules are defined mainly based on their position or location with the vessel and pleura. For example, juxta-pleural nodule is attached to the wall of the lung. Because nodule segmentation is a crucial step for further diagnosis, a number of studies have investigated and developed different methods to segment pulmonary nodules (7-13). Although many researchers proposed many methods to segment nodules, segmentation of juxta-pleural nodule still remains an issue. Due to the similar intensity with the attached pleura, it is difficult to determine the boundary between the nodule and chest wall. Juxta-pleural nodule segmentation is a difficult and challenging task.
To generate the mask of juxta-pleural nodule, most of the reported nodule segmentation algorithms get the complete boundaries of juxta-pleural nodules based on the lung contour correction method. Messay et al. (8) integrated image segmentation algorithms, namely threshold segmentation and morphological operation, with machine learning for segmentation of juxta-pleural nodules in CT images. Then candidate segmentations were selected by regression neural network (RNN). A set of extracted features were input into the neural network to get an optimal segmentation result. Lassen et al. (9) proposed a semi-automated method for the segmentation of sub-solid juxta-pleural pulmonary nodules with a user-drawn stroke on the largest dimension of the nodule. Then, region growing algorithm was performed based on the intensity analysis of the nodule images. The attached chest wall was removed by connected component analysis combining convex hull calculation. The segmentation result changes as the observer’s input changes. Kubota et al. (10) proposed a novel segmentation method which was composed of figure-ground separation, nodule core extraction, region growing, surface voxel extraction, and convex hull operation. However, these proposed segmentation methods are not valid when the juxta-pleural nodule presents obvious lobulation or spiculation.
Though several juxta-pleural nodule segmentation methods have been investigated and developed, some issues still remain unsolved. For example, the “rolling ball” method, which could also be considered as a morphological closing operation, is utilized to perform lung parenchyma correction before nodule extraction. However, due to the extremely varied nodule sizes, it is difficult to select a proper rolling ball radius that is suitable to all circumstances, and still needs quite a lot of human intervention. The traditional convex hull operation based lung correction method will be failed when it comes to nodules located in the mediastinum and cardiac region, where the boundary of lung parenchyma changes into concave. Segmentation approaches combined with machine learning algorithm can obtain a better result, but it relies on big data collection and is sensitive to types of nodules (8).
Considering the advantages and limitations of the segmentation algorithms reported in the published literatures, we have developed a juxta-pleural nodule segmentation approach based on transition region and chain code analysis. In brief, first, we draw a rectangular region to locate the nodule region based on the center point position of nodule. After selecting the region of interest (ROI) interactively, the nodules are segmented automatically. The segmentation algorithm involves two stages: Transition region based threshold segmentation and lung contour correction. To get a better corrected lung contour, an iterative weighted averaging based smoothing technique is employed before chain code analysis. Our proposed segmentation method aims to better delineate nodules’ ambiguous boundary, as well as correct lung parenchyma boundary properly.
The paper is organized as follows. Materials and methods are described in Section II, which is divided into 3 subsections of materials, methods and performance evaluation. The experiments and data analysis are reported in Section III. The advantages or contributions and the limitations of this study are discussed in Section IV. Finally, conclusions and future prospective works are described in Section V.
2. Objectives
To better support the following radiomics analysis, this study aims to propose and develop a novel segmentation method for small-size juxta-pleural pulmonary nodules.
3. Materials and Methods
3.1. Materials
The experiment dataset is collected from Lung Image Database Consortium (LIDC), which is a publicly available database aiming to facilitate computerized medical image analysis research (https://wiki.cancerimagingarchive.net/display/Public/LIDC-IDRI). The LIDC database is gathered from clinical thoracic CT scans. These scans were acquired with (peak) voltage ranges from 120 kVp to 140 kVp, X-ray current ranges from 40 and 627 mA, slice thickness ranges from 0.6 to 5 mm, and in-plane pixel size ranges from 0.461 to 0.977 mm. The convolution kernels used for image construction differ based on the manufacturer, and mainly classified as “standard”, “soft”, “slightly enhancing”, and “over enhancing” (11).
During the establishing procedure of LIDC thoracic CT database, a two-phase image annotation process (involving blinded-reading and unblinded-reading phase) was implemented by four experienced radiologists. Each radiologist independently delineated the boundaries of nodules with considerable diameters less than 30 mm and larger than or equal to 3 mm. The requested information about the marked lesions was recorded in a corresponding XML file. Considering the delineations of nodule contour differ from different radiologists’ point of view, we selected the intersection accepted by at least 3 out of 4 radiologists as ground truth in our experiment to make our evaluation standard more authentic.
We selected 50 juxta-pleural nodules from LIDC database to evaluate the performance of our method. CT images of juxta-pleural nodule were selected by radiologists from Shanghai Pulmonary Hospital. The location of each nodule in the CT images were already delineated and recorded in XML files. Table 1 shows the statistical analysis of the selected nodule images. The average CT value of the selected nodules was mainly below -100 HU. The diameter of the selected nodules ranged from 5 mm to 10 mm, which are accepted as small-size ones in clinical research. The small-size juxta-pleural nodules are majority of our study subjects.
| Average intensity of nodules | Count |
|---|---|
| [-494.35, -364.35] | 8 |
| [-364.35, -234.35] | 11 |
| [-234.35, -104.35] | 19 |
| [-104.35, 25.65] | 11 |
| [25.65, 155.65] | 1 |
Distribution of Nodules’ Average Intensity
3.2. Method
According to the CT images, the juxta-pleural pulmonary nodule, or pleural attached nodule, was located next to the chest wall. Since the intensity of the chest wall is similar to the adjacent nodules in CT scan, it is hard to delineate their boundaries by naked eyes. So, the key issue for segmenting juxta-pleural nodules is to settle the borderline between the nodule and the chest wall. In this paper, a threshold segmentation algorithm based on image transition region and chain code analysis were combined to define the boundary of the nodule. First, the center position and boundary of the nodule were delineated by parsing XML. Then, a 50 × 50 pixels region of interest (ROI) was automatically generated. The segmentation approach was performed on the basis of interactive selection of the 50 × 50 pixels ROI. The workflow chart of the proposed segmentation method is presented in Figure 1A.

A, Flow chart of the proposed segmentation method; B, An original nodule image; C, Image after preprocessing
3.2.1. Image Preprocessing
The ROIs were preprocessed to reduce unwanted noise and reserve boundary at the same time. Anisotropic diffusion, which was proposed by Perona and Malik in 1990 (14), was applied on the original cropped CT images. Unlike the traditional spatial filtering, anisotropic diffusion can blur the inner part of the object and preserve edge information at the same time (15).
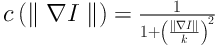
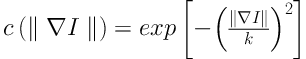
The anisotropic diffusion is defined as Equation 1. Equations 2 and 3 exhibit two different forms of the diffusion equation.
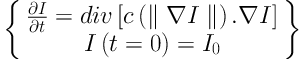

p represents the coordinate of current pixel.
3.2.2. Threshold Segmentation Based on Transition Region
The transition region (TR) is defined as the region locating between the object and background with a width of several pixels. Owing to frequent and intensive changes of pixels’ gray level in the transition region, its local variance is larger than that in other regions with less change in gray value. The TR based thresholding is built on the analysis of pixels’ gray value distribution in the transition region. To settle down a proper gray value threshold, TR based thresholding concerns more about pixels’ spatial information compared with the traditional threshold segmentation (16, 17).
In the TR based thresholding method, the transition region should be extracted before we settle down gray threshold. The existing transition region extraction methods are mainly based on pixels’ local entropy (18) and local complexity (19). The extraction of transition region influences the final segmentation result in certain degrees. To better support image segmentation, Li et al. (20) proposes a salient transition region based image segmentation approach which performs better in foreground extraction, and then applies it in the segmentation of single-object images in the real world. Specially, the transition region around the object is defined as salient transition region. To get a proper segmented mask of the object, the salient transition region is more representative than other transition regions in the image and is available to settle a more appropriate threshold to extract the foreground.
Juxta-pleural nodule may have an ambiguous boundary because of its pathological characteristics. It can also be regarded as “salient transition region” in CT images (20). The salient transition region is recognized based on local variance analysis method. After image preprocessing procedure, the salient transition region based foreground extraction is implemented by the following steps.
Step 1: The local variance of pixel
Step 2: The transition region is extracted according to Equation 6. Threshold segmentation with a threshold of

Comparison of segmentation results under different criteria of α values. A, Ground truth; B, Segmentation result with
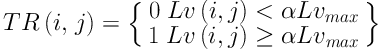
Step 3: The largest connected component in TR is labeled as the salient transition region in our segmentation experiment, and the salient transition region is represented as STR which locates at the nodule’s boundary, as is presented in Figure 1A.
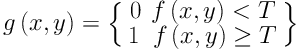
Step 4: The segmentation threshold of the ROI is settled based on the average and standard deviation of pixels’ gray level in the salient transition region generated in step 3. The threshold is determined by Equation 7, in which the parameter 0.85 was settled by experience after several times of tests.

Step 5: After the threshold segmentation, background regions, such as blood vessel, still remain in ROI, as is shown in Figure 1A. The foreground in nodule image sequence was extracted by 3D connected component labeling at last, remaining the largest connected component, as is shown in Figure 1A.
3.2.3. Lung Contour Correction
The juxta-pleural nodule is excluded in the lung parenchyma during the initial segmentation step due to the similar density between the lung nodule and the chest wall. Lung contour needs to be corrected to get the entire boundary of juxta-pleural nodule. After the foreground is extracted by threshold segmentation, lung contour repair procedure is performed that consists of two steps: (1) Smoothing the initial boundary of pulmonary parenchyma by using iterative weighted averaging; (2) identifying inflection points to repair lung lobe boundary by chain code analysis.
3.2.3.1. Iterative Weighted Averaging
The curvature of boundary pixel is an important feature during lung contour correction in our segmentation experiment. The inflection points on the lung parenchyma contour caused by the appearance of nodule mostly demonstrate larger curvature and change the boundary convexity (21). However, the perturbation or noise often occurs on the boundary line, which will influence the effectiveness of chain code analysis based lung contour correction. Therefore, it is necessary to perform boundary smoothing first.
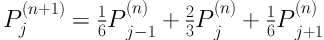
The iterative weighted averaging algorithm is used quite often to smooth signal by means of averaging the neighborhood (22). This method has also been used in Zhou et al.’s paper (23). Let

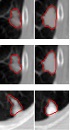
Comparison of the segmentation result with and without boundary smoothing before lung parenchyma correction. A, Original image of region of interest region of interest; B, Result of threshold segmentation based on transition region; C, Result of boundary smoothing; D, Result of the repaired lung parenchyma with boundary smoothing; E, Result of the repaired lung parenchyma without boundary smoothing; F, Ground truth; G, Segmentation result produced based on D; H, Segmentation result produced based on E.
3.2.3.2. Chain Code Analysis
Chain code analysis is a method using the direction code to describe boundary. The boundary pixels are encoded either with 8 connected or 4 connected chain codes.
The chain code analysis encoded with 8 connected components was performed according to the methodology proposed in our previous study (24). Then, we calculated the difference of chain codes between two adjacent pixels to identify the sudden changes in curvature or critical points which are caused by the appearance of juxta-pleural nodule. Two critical points would be connected if the distance between them is less than 20 pixels, which is valid to most of the nodules in the experimental sample.
The boundary of lung parenchyma mask in ROI was generated after the pairs of critical points were automatically connected. After correcting the contour of lung parenchyma mask, the holes were filled by using flood-fill algorithm. In order to repair all the lung parenchyma mask in our dataset, we set threshold of the jointed distance with 20 pixels. The lung parenchyma mask was denoted as

3.3. Performance Evaluation
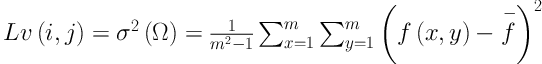
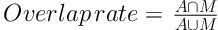
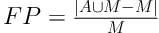
To evaluate the performance of our new method, we calculated the overlap rate, false positive rate (FP), sensitivity, and modified Hausdorff distance (MHD) to provide a comprehensive statistical measurement of segmentation result. Generally, the overlap rate, false positive rate, sensitivity and specificity are commonly used as region-based evaluation standards, and MHD, which is developed on the basis of Hausdorff distance, is utilized to measure the mismatch of different objects. Let


To further prove the robustness of our proposed segmentation approach, we added conducted additional experiments by using the CT images mixed with Gaussian noise to the origin ROIs. The variance of Gaussian noise ranges from 0.001 to 0.05 with a step of 0.005. We calculated the misclassification error (ME) to quantify and analyze the robustness of our method under different degrees of Gaussian noise. ME is defined as Equation 15:

where
The segmentation methods proposed in our paper were implemented in MATLAB 2015a. The platform runs on 64-bit Windows 10 operating system, 3.2 GHz processor, and 8 GB of RAM memory.
4. Results
Figure 3 shows an example of the juxta-pleural nodule. In Figure 3G and 3H, we compared and validated the effectiveness of iterative weighted averaging based smoothing technique. The experiment shows that the juxta-pleural nodule can be better segmented after lung contour smooth. It indicates that the iterative weighted averaging based segmentation method is an effective way to improve the segmentation performance. The lung contour correction based on iterative weighted averaging and chain code analysis draws the border between the thoracic cavity and the nodule properly.
To compare the effectiveness of transition regions generated by using different image features, we conducted an experiment by using TR thresholding method based on local variance feature and fuzzy feature based TR method. We also calculated the average overlap rate generated by applying local variance feature proposed in our study and fuzzy feature obtained in FCM algorithm. The results showed that our new method yielded higher overlap rate (0.77) than that yielded by FCM algorithm (0.67). It demonstrated that our method outperformed FCM for segmenting small size juxta-pleural nodules in CT scans.
Figure 4 shows examples of our segmentation results and ground truths. Comparing our results with ground truths, it can be seen that the results generated by the proposed method are close to the ground truths by segmenting different nodules. Table 2 summarizes and compares the average segmentation result of our new method and Mukhopadhya’s method by using the same dataset in this study. The method proposed in Mukhopadhya’s (12) study was a typical study focused on juxta-pleural nodule segmentation, which was developed on morphological and convex hull operation (4, 6, 10, 13). Comparing with Mukhopadhya’s method, our new method yielded higher overlap rate (76.93% vs 66.29%), sensitivity (86.65% vs 77%), and reduced the FPs (13.09% vs 20.30%), MHD (1.03 vs 2.42) and computational time (0.2s vs 0.39s) as well. To further compare the results generated by using our new method and Mukhopadhy’s method, we calculated the P value for each evaluation index. Table 2 illustrates the results generated by applying our new method and Mukhopadhy’s method. The results show that our new method yielded significantly higher performance than that yielded by Mukhopadhy’s under various evaluation indexes (P < 0.05).
| Mukhopadhyay’s method | Proposed method | P value | |
|---|---|---|---|
| Overlap rate | 66.29% ± 0.13 | 76.93% ± 0.06 | 0.7 × 10⁻⁵ |
| False positive rate | 20.30% ± 0.19 | 13.09% ± 0.09 | 0.02 |
| Sensitivity | 77.0% ± 0.16 | 86.65% ± 0.08 | 0.0003 |
| MHD | 2.42 ± 2.04 | 1.03 ± 0.56 | 0.3 × 10⁻⁴ |
| Elapsed time | 0.39 s/slice | 0.20 s/slice | - |
Comparison of the Average Segmentation Results Generated by Using Different Approaches with the Same Dataseta

Segmentation results obtained by the proposed approach. A, C, and E, Segmentation results; and B, D, and F, Ground truth
After comparing and analyzing the segmentation results, we can find that our new method outperforms the Mukhopadhya’s method. It indicates that our new approach has a potential to improve the segmentation performance of juxta-pleural nodule. Figure 5A - 5D also shows the same trend. Figure 5B and 5C illustrates and compares the results generated by Mukhopadhyay’s method and our new method, respectively. By using adaptive threshold yielded based on the histogram of salient transition region, transition region based thresholding segmentation algorithm can delineate nodule’s ambiguous edge more accuracy than Mukhopadhyay’s approach.
In order to further compare the results of our new method and Mukhopadhyay’s method, we draw the box plots of these two-different methods in Figure 5E. According to the experimental results shown in Figure 5E, the proposed method elaborates better stability. Both of the two segmentation methods also were implemented on the images mixed with 2D Gaussian noise with variance ranges from 0.001 to 0.05. Figure 5F shows and compares the mean misclassification error (MME) values generated by two methods under different variance. It can be seen that our new method achieved a lower MME value (0.049 vs 0.077), which indicates that our method is more robust than Mukhopadhyay’s method.
.")
Comparison of segmentation results generated by applying our new method and Mukhopadhyay’s method, repectively A, Nodule image; B, Segmentation result produced by Mukhopadhyay’s approach; C, Segmentation result produced by our approach; D, Ground truth; E, The four evaluation standards of the segmentation results; F, Comparison of MME values generated by using CT images mixed with different levels of Gaussian noise (MME, mean misclassification error; MHD, modified Hausdorff distance).
5. Discussion
Since nodule segmentation is a crucial step for further quantitative analysis, we developed a new method to segment juxta-pleural nodules in CT scans. In this study, we segment juxta-pleural nodules by using transition region based thresholding and chain code analysis. We first used an anisotropic diffusion algorithm to enhance the nodule regions. After enhancing the ROI with preprocessing step, the ROI region was smoothed, and the boundary of nodule was enhanced at the same time. Then, we extracted the foreground pixels by the method of threshold segmentation based on transition region, and repaired the boundaries applying a chain code analysis. The transition region based thresholding method used the gray value of pixels in transition region to compute the optimal threshold for juxta-pleural nodule region, and chain code analysis could remove the attached pleural from the ROI and correct the contour as well. In the contour correction process using chain code analysis, we applied the iterative weighted averaging based boundary smoothing technique to smooth the noisy point pairs. By observing the results of smoothed boundary and un-smoothed boundary (Figure 3), we found that the iterative weighted averaging based boundary smoothing method make a contribution to improve the segmentation performance. Finally, we obtained the final segmented pulmonary nodule mask by multiplying the binary image of foreground and corrected lung parenchyma mask.
In order to validate and evaluate the effectiveness of our new method, we computed and compared five evaluation indexes (i.e., overlap rate, false positive rate, sensitivity, modified Hausdorff distance, and computational time) by using 50 juxta-pleural nodules acquired from LIDC database. We compared and analyzed the segmentation results between our study and a widely used juxta-pleural pulmonary nodule segmentation approach developed by Mukhopadhyay (12) by using the same experiment dataset. Experimental results (i.e., results showed in Table 2 and Figure 5) demonstrated that our new method could improve the segmentation performance by comparing with the Mukhopadhyay’s method with the same dataset. Thus, it can be seen that our new method is an effective way to improve the segmentation performance by using transition region based thresholding and chain code analysis.
Meanwhile, despite the promising result, we also recognized a number of limitations in this study. First, our method was tested on a limited dataset involving only 50 juxta-pleural nodules. Hence, robustness of the reported results in this study needs to be further tested and validated with a large image dataset. Second, the parameters used in this study were configured with empirical experiment. Whether and how to configure these parameters automatically is also a task needed to be explored in the future studies. Third, in this study, the proposed segmentation method was only implemented on 2D images. Though a 3D segmentation method was not employed, we segmented all the slices of each nodule in CT scans to generate a 3D segmentation result. We will modify this 2D method into 3D segmentation algorithm in the future studies. Last, this is only a technologic developmental study, the clinical utility of this new method has not been tested. In future studies, the clinical application of this method should be investigated and explored.
In conclusion, the analysis of small-size lung nodules’ morphological and intensity information in pulmonary CT images is critical for radiologist’s diagnosis. To better support segmentation of small-size juxta-pleural pulmonary nodules, we propose and develop a segmentation approach based on transition region and chain code analysis. The segmentation scheme is established based on the gray distribution and morphological features of juxta-pleural pulmonary nodules. We first applied the thresholding segmentation based on image transition region to get foreground region in ROI. Then, iterative weighted averaging was combined with chain code analysis to repair the lung contour. Finally, the segmented foreground region and the repaired lung parenchyma were multiplied to generate the final segmentation result.
By applying the dataset collected from LIDC database, we have achieved an overlap rate of 76.93% with the false positive rate of 13.09%. The experiment results show our new method can segment small-size juxta-pleural nodules effectively and accurately with better robustness when compared with Mukhopadhyay’s method.
In comparison with the method reported in literatures, the proposed segmentation methodology can outperform them in avoiding insufficient segmentation and boundary leakage. It is also promising for clinical application. In future studies, we will optimize our method and validate the applicability and robustness of the segmentation approach with larger datasets.
